ABSTRACT
ROSS, KEVIN ANDREW. Evaluation of an Instrumented Sweating Manikin for Predicting Heat Stress in Firefighters’ Turnout Ensembles. (Under the direction of Roger Lee Barker)
This research studies relationships between measurements of heat loss through
firefighter turnout ensembles measured using a sweating thermal manikin and a guarded
sweating hot plate. Measurement techniques and results are compared. These two measures
of heat loss are also compared on their ability to explain thermal heat stress. The assessments
of thermal heat stress were provided in a report from an earlier physiological study where
human responses were evaluated during wear trials of firefighter protective gear.
The focus of this research was on the role of the instrumented sweating manikin as a
supplemental tool in predicting heat stress. Its human form makes it a logical intermediary
tool between a flat skin model (hot plate) and human subject testing. Thus, it was decided to
investigate its role by using it to evaluate six firefighter turnout ensembles where there was
existing data available for comparison to both hot plate and physiological test results.
The results of this study indicate that sweating thermal manikin measurements
provide a fuller explanation and prediction of heat stress assessments in physiological wear
trials than provided by a sweating hot plate. This is attributed to the ability of manikin tests
to evaluate the effects of garments’ insulating air layers and the contribution of clothing
design features to the total thermal burden. This research provides insights into the use of
instrumented manikins as research tools and as means of providing information useful for
predicting and explaining the results of physiological wear trials of firefighter protective
BVALUATION OF AN INSTRUMENTED SWEATING MANIKIN FOR PREDICTING HEAT STRESS IN FIREFIGHTERS' TURI{OUT ENSEMBLES
by
KEVIN AIIDREW ROSS
A thesis submitted to the Graduate Faculty of North Carolina State University
in partial fulfillment of the requirements for the Degree of
Master of Science
TEXTILE ENGINEERING
Raleigh
2005
APPROVED BY:
BIOGRAPHY
Kevin Andrew Ross was born February 11, 1981 to Donald and Joanne Ross in Riverside, California. He spent most of his youth growing up with his brother and sister in Wilmington, North Carolina where he attended elementary and middle school before finally graduating from John T. Hoggard High School in 1999.
Later in 1999, Kevin moved to Raleigh, North Carolina to begin life as a student at North Carolina State University. As a Textile Engineering student, Kevin kept busy at school with his studies and pursuit of a Spanish Minor. Outside of class, Kevin did a little bit of everything including working as a lifeguard, playing in various soccer leagues, getting involved with the Delta Kappa Phi Textile Fraternity and other organizations, trying to play the guitar, and cheering for the Wolfpack.
ACKNOWLEDGEMENTS
I would like to express my most sincere gratitude to my research advisor and project leader, Dr. Roger L. Barker for his advice, guidance, and support throughout my research. He seemed to possess a unique wisdom which was constantly a source of both comfort and inspiration. I would also like to thank all of the other members of my committee and the TPACC faculty who also provided encouragement and support.
I would like to especially recognize and thank Shawn Deaton for all of his help. Without his great store of knowledge and personal attention, with regard to help with the sweating manikin and sweating hot plate, none of this work would have been possible.
I am grateful to my fellow graduate students, especially those whom shared this project with me, for both their encouragement and camaraderie.
I am most particularly grateful to my best friend and companion, Kelly Goforth. She has offered me a tremendous amount of support and encouragement throughout my graduate studies in ways unimaginable. I only pray that I can be as equally supportive to her as she begins research for her graduate studies.
TABLE OF CONTENTS
LIST OF FIGURES ... vii
LIST OF TABLES... x
CHAPTER 1: INTRODUCTION ... 1
1.1 Purpose... 1
1.2 Research Objectives... 1
CHAPTER 2: LITERATURE REVIEW... 4
2.1 Need for Research... 4
2.1.1 Heat Stress and Heat Strain... 6
2.1.2 Heat Stress Development in Firefighter Garments ... 7
2.2 Heat Transfer ... 9
2.2.1 Dry Heat Transfer ... 9
2.2.2 Evaporative Heat Transfer ... 10
2.2.3 Environmental Conditions and Heat Transfer ... 11
2.3 Combating Heat Stress... 13
2.3.1 Clothing Considerations... 13
2.3.2 NFPA 1971 Standard ... 14
2.4 Firefighter Garments... 14
2.4.1 Outer Shell ... 15
2.4.2 Moisture Barrier... 16
2.4.3 Thermal Liner ... 17
2.5Modifying Clothing: Performance Evaluation... 18
2.5.1 Total Heat Loss Test ... 18
2.5.2 Development of the Total Heat Loss Test ... 19
2.5.3 ASTM F-1868 Standard... 21
2.5.4 Measuring Thermal Resistance... 22
2.5.5 Measuring Evaporative Resistance... 22
2.5.6 Calculations... 23
2.5.7 Balancing Total Heat Loss with Thermal Protective Performance ... 26
2.6 Limitations of the Sweating Hot Plate Test ... 29
2.6.1 Fabric versus Clothing ... 31
2.6.2 Heat Transfer with the Hot Plate ... 31
2.7 The Sweating Manikin as a Supplemental Tool ... 33
2.8 Physiological Wear Trials... 34
2.8.1 International Firefighter Protective Clothing Breathability Research Project. 35 2.8.1.1 Mild Environment Protocol ... 35
2.8.2 Field Evaluation of Protective Clothing Effects of Fire Fighter Physiology:
Predictive Capability of Total Heat Loss Test... 42
2.8.2.1 Extrication Simulation Protocol... 42
2.8.2.2 Ladder Company Simulation Protocol... 46
CHAPTER 3: EXPERIMENTAL... 52
3.1 Manikin Testing... 52
3.1.1 Dry Testing ... 57
3.1.2 Wet Testing... 63
3.2 Clothing Materials ... 72
3.2.1 Turnout Garments ... 73
3.2.2 Station Uniform ... 75
3.2.3 Garment Accessories ... 76
3.3 Hot Plate Testing... 82
3.4 Physiological Testing... 84
CHAPTER 4: RESULTS AND DISCUSSION... 86
4.1 Material Property Results ... 86
4.1.1 Material Weights... 86
4.1.2 Hot Plate Data... 88
4.1.3 Manikin Heat Transfer Data ... 89
4.2 Weight Change Results for Wet Testing with the Sweating Manikin... 91
4.2.1 Weight Changes Measured by Manikin and Water Supply Scales... 91
4.2.2 Weight Changes in Gear Measured with a Digital Scale... 93
4.3 Results from International Firefighter Protective Clothing Breathability Research Project ... 95
4.4 Discussion of Heat Transfer Data... 98
4.4.1 Thermal and Evaporative Resistances ... 99
4.4.2 Total Heat Loss... 104
4.5 Recovery During Rest: Discussion of the Predicted and Actual Range of Total Heat Loss ... 110
4.5.1 Recovery During Rest for Mild Environment Protocol... 111
4.5.2 Recovery During Rest for Warm Environment Protocol... 114
4.6 Correlations Between Hot Plate Values and Physiological Response... 116
4.6.1 Discussion of Differences in Field Evaluation Results and Breathability Research Project Results... 116
4.6.1.1 Differences in Test Conditions ... 116
4.6.1.2 Differences in Garments Evaluated ... 117
4.6.1.3 Differences in Testing Protocol ... 120
4.6.1.4 Summary of Differences ... 121
4.6.2 Inverse Hyperbolic Relationship Between THL and Core Temperature Response ... 122
4.7.2 Total Heat Loss Correlations ... 128
4.8 Correlations Between Manikin Values and Physiological Response ... 133
4.9 Correlations for Weight Change Results for Wet Testing with the Sweating Manikin... 136
4.9.1 Correlations for Weight Change Results Measured by Manikin and Water Supply Scales... 136
4.9.2 Correlations for Weight Change Results Measured by a Digital Scale ... 138
4.9.3 Variation in Weight Change Data... 140
4.9.4 Weight Gains of Station Uniforms and Turnout Liners... 141
4.9.5 Summary of the Value of Weight Change Data for the Manikin ... 142
4.10 Using the Sweating Thermal Manikin to Assess Where Heat Loss Occurs ... 143
CHAPTER 5: CONCLUSIONS AND RECOMMENDATIONS... 147
5.1 Summary of Results... 147
5.2 Implications for Future Use of the Sweating Manikin... 148
REFERENCES ... 151
APPENDIX... 157
A.1 Differences of Garments in Response to Various Factors ... 158
A.1.1 Manikin Heat Transfer Data ... 159
A.1.2 Manikin Data – Standard Conditions (25ºC, 65% RH) ... 160
A.1.3 Manikin Data – International Firefighter Protective Clothing Breathability Research Project, Warm Environment Protocol Conditions (39ºC, 35% RH) ... 161
A.1.4 Hot Plate Heat Transfer Data... 162
A.1.5 Hot Plate Data – Standard Conditions (25ºC, 65% RH)... 163
A.1.6 Manikin Data – International Firefighter Protective Clothing Breathability Research Project, Warm Environment Protocol Conditions (39ºC, 35% RH) ... 164
A.1.7 Weight Data – Manikin Testing... 165
A.1.8 Manikin Weight Loss... 166
A.1.9 Gear Weight Gain ... 168
A.2 Regression Diagnostics... 173
A.2.1 Error Assumptions ... 174
LIST OF FIGURES
Figure 2.1: On-Duty Firefighter Fatalities (1977-2003) ... 5
Figure 2.2: THL vs. TPP for Garment Composites from 4 Various Outer Shells, 3 Various Moisture Barriers and 5 Various Thermal Liners ... 27
Figure 2.3: Typical Negative Correlation between THL and TPP for Several Garments (Color Separated by Moisture Barrier) ... 28
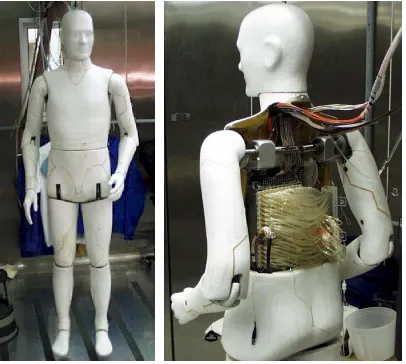
Figure 3.1: Sweating Manikin (Frontal View)... 53
Figure 3.2: Back View of Manikin’s Inner Components... 53
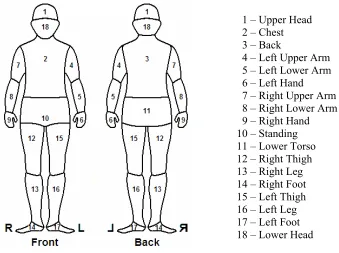
Figure 3.3: Front and Back Views of the Sweating Manikin showing Labeled Sections 54 Figure 3.4: Cross Sectional View of a Sweat Gland for the Sweating Manikin... 55
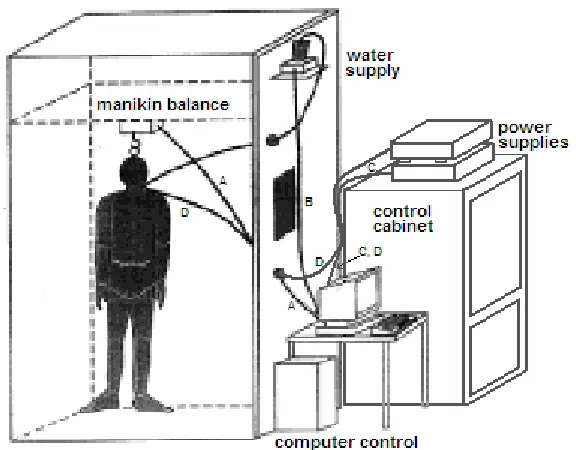
Figure 3.5: Control System for Sweating Manikin in Environmental Chamber ... 56
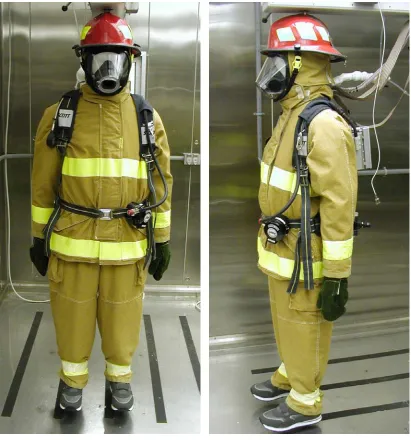
Figure 3.6: Front View of Fully Dressed Manikin ... 73
Figure 3.7: Side View of Fully Dressed Manikin... 73
Figure 3.8: Hot Plate in Environmental Chamber ... 84
Figure 3.9: Close-Up View of the Sweating Hot Plate... 84
Figure 3.10: Subject Dressed for the Warm Environment Protocol ... 85
Figure 3.11: Subject Exercising During the Warm Environment Protocol ... 85
Figure 4.1: Thermal Resistance (Rct) Measured by the Hot Plate ... 100
Figure 4.2: Thermal Resistance (Rt) Measured by the Manikin ... 100
Figure 4.3: Apparent Evaporative Resistance (ARet) Measured by the Hot Plate... 101
Figure 4.4: Evaporative Resistance (Ret) Measured by the Manikin ... 102
Figure 4.5: Evaporative Resistance (Ret) Measured by the Manikin Using Option 2 ... 103
Figure 4.6: Total Heat Loss Predicted by the Hot Plate for Standard Conditions... 104
Figure 4.7: Total Heat Loss Predicted by the Manikin for Standard Conditions ... 105
Figure 4.8: Total Heat Loss Predicted by the Hot Plate for Warm Environment Conditions... 106
Figure 4.9: Total Heat Loss Predicted by the Manikin for Warm Environment Conditions ... 106
Figure 4.10: Total Heat Loss Predicted by the Hot Plate for Standard Conditions divided the by Dry and Evaporative Components of Heat Loss... 108
Figure 4.11: Total Heat Loss Predicted by the Manikin for Standard Conditions divided the by Dry and Evaporative Components of Heat Loss... 108
Figure 4.12: Total Heat Loss Predicted by the Hot Plate for Warm Environment Conditions divided the by Dry and Evaporative Components of Heat Loss ... 109
Figure 4.13: Total Heat Loss Predicted by the Manikin for Warm Environment Conditions divided the by Dry and Evaporative Components of Heat Loss ... 109
Figure 4.14: Core Temperature Able to Recover During Periods of Rest for the Mild Environment Protocol ... 112
Figure 4.17: Boxplot for the Thermal Resistances of Garments Used for the ‘International Research Breathability Research Project’ and ‘Field Evaluation of
Protective Clothing Effects on Fire Fighter Physiology’... 118 Figure 4.18: Boxplot for the Evaporative Resistances of Garments Used for the
‘International Research Breathability Research Project’ and ‘Field Evaluation of
Protective Clothing Effects on Fire Fighter Physiology’... 118 Figure 4.19: Boxplot for the Total Heat Losses (Standard Conditions) of Garments Used for the ‘International Research Breathability Research Project’ and ‘Field Evaluation of Protective Clothing Effects on Fire Fighter Physiology’... 119 Figure 4.20: Correlation between 1/THL and Core Temperature Response found for the ‘Field Evaluation of Protective Clothing Effects on Fire Fighter Physiology’ (Ladder Company Simulation Results are shown in this Figure)... 122 Figure 4.21: No Significant Correlation between 1/THL and Core Temperature Response was found for the Mild Environment Protocol of the ‘International Breathability Research Project’... 123 Figure 4.22: No Significant Correlation between 1/THL and Core Temperature Response was found for the Warm Environment Protocol of the ‘International Breathability
Research Project’ ... 124 Figure 4.23: No Significant Correlation between the Thermal Resistance Measured by the Hot Plate and Thermal Resistance Measured by the Manikin ... 126 Figure 4.24: Relationship between the Evaporative Resistance Measured by the Hot Plate and the Evaporative Resistance Measured by the Manikin is likely to be Non-linear in Nature... 126 Figure 4.25: Relationship between Total Heat Loss and Evaporative Heat Loss on the Manikin shows a Near Complete Dependence ... 129 Figure 4.26: Possible Linear or Non-Linear Relationships between Total Heat Loss Predicted by the Manikin and Total Heat Loss Predicted by the Hot Plate for Standard Conditions... 131 Figure 4.27: Possible Linear or Non-Linear Relationships between Total Heat Loss Predicted by the Manikin and Total Heat Loss Predicted by the Hot Plate for Warm Environment Conditions ... 132 Figure 4.28: Good Correlation between Skin Temperature Response for the Warm
Environment Protocol and Total Heat Loss Predicted by the Manikin (Standard
Conditions)... 134 Figure 4.29: Vague Correlation between Skin Temperature Response for the Warm Environment Protocol and Total Heat Loss Predicted by the Hot Plate (Standard
LIST OF TABLES
Table 2.1: Mild Environment Protocol for Breathability Research Project... 36
Table 2.2: Warm Environment Protocol for Breathability Research Project ... 39
Table 2.3: Extrication Simulation Protocol for IAFF Field Evaluation... 44
Table 2.4: Ladder Company Simulation Protocol for IAFF Field Evaluation ... 46
Table 3.1: Scale Positions at which Weights were Recorded for Various States of Dress for Manikin Dry Testing ... 59
Table 3.2: Manikin Surface Area by Section... 61
Table 3.3: Scale Positions at which Weights were Recorded for Various States of Dress for Manikin Wet Testing... 65
Table 3.4: Outer Shell, Moisture Barrier, and Thermal Liner Construction for Garments 1-6 ... 74
Table 4.1: Dry System Weights ... 87
Table 4.2: Accessory Weights ... 88
Table 4.3: Hot Plate Heat Transfer Data... 89
Table 4.4: Manikin Heat Transfer Data ... 90
Table 4.5: Moisture Transfer in Manikin... 91
Table 4.6: Manikin Weight Loss Measured by Manikin Scale and Water Supply Scale 92 Table 4.7: Weight Gain in Turnout Gear ... 93
Table 4.8: Accessory Weight Gain by Garment Worn ... 94
Table 4.9: Weight Gain in Turnout Gear ... 95
Table 4.10: Physiological Results from Mild Environment Protocol... 96
Table 4.11: Physiological Results from Warm Environment Protocol... 97
Table 4.12: Weight Changes from Mild Environment Protocol... 98
Table 4.13: Weight Changes from Warm Environment Protocol... 98
Table A.1: Differences of Garments in Thermal Resistance measured on the Manikin 159 Table A.2: Differences of Garments in Evaporative Resistance measured on the Manikin ... 159
Table A.3: Differences of Garments in Evaporative Resistance measured on the Manikin via Option 2... 160
Table A.4: Differences of Garments in Total Heat Loss Predicted by the Manikin for 25ºC, 65% RH... 160
Table A.5: Differences of Garments in Dry Heat Loss Predicted by the Manikin for 25ºC, 65% RH... 160
Table A.6: Differences of Garments in Evaporative Heat Loss Predicted by the Manikin for 25ºC, 65% RH ... 161
Table A.7: Differences of Garments in Total Heat Loss Predicted by the Manikin for 39ºC, 35% RH... 161
Table A.9: Differences of Garments in Evaporative Heat Loss Predicted by the Manikin
for 39ºC, 35% RH ... 162
Table A.11: Differences of Garments in Evaporative Resistance measured on the Hot Plate... 162
Table A.12: Differences of Garments in Total Heat Loss Predicted by the Hot Plate for 25ºC, 65% RH... 163
Table A.13: Differences of Garments in Dry Heat Loss Predicted by the Hot Plate for 25ºC, 65% RH... 163
Table A.14: Differences of Garments in Evaporative Heat Loss Predicted by the Hot Plate for 25ºC, 65% RH ... 163
Table A.15: Differences of Garments in Total Heat Loss Predicted by the Hot Plate for 39ºC, 35% RH... 164
Table A.16: Differences of Garments in Dry Heat Loss Predicted by the Hot Plate for 39ºC, 35% RH... 164
Table A.17: Differences of Garments in Evaporative Heat Loss Predicted by the Hot Plate for 39ºC, 35% RH ... 164
Table A.18: Differences of Garments in Equivalent Sweat Rate measured by Manikin Scale and Water Supply Scale ... 165
Table A.19: Differences of Garments in Evaporation Rate measured by Manikin Scale and Water Supply Scale ... 165
Table A.20: Differences of Garments in Percent of Sweat Evaporated measured by Manikin Scale and Water Supply Scale... 165
Table A.21: Differences of Garments in Water Accumulation in Gear measured by Manikin Scale and Water Supply Scale... 166
Table A.22: Differences of Garments in Manikin Nude Weight Loss measured by Manikin Scale and Water Supply Scale... 166
Table A.23: Differences of Garments in Manikin Weight Loss in Station Uniform and Socks measured by Manikin Scale and Water Supply Scale... 166
Table A.24: Differences of Garments in Manikin Weight Loss in Underwear measured by Manikin Scale and Water Supply Scale... 167
Table A.25: Differences of Garments in Manikin Weight Loss in Gear (No Harness) measured by Manikin Scale and Water Supply Scale ... 167
Table A.26: Differences of Garments in Manikin Weight Loss in Gear (With Harness) measured by Manikin Scale and Water Supply Scale ... 167
Table A.27: Differences of Garments in Turnout Weight Gain ... 168
Table A.28: Differences of Garments in Turnout Coat Weight Gain... 168
Table A.29: Differences of Garments in Turnout Pants Weight Gain... 168
Table A.30: Differences of Garments in Turnout Liner Weight Gain... 169
Table A.31: Differences of Garments in Coat Liner Weight Gain ... 169
Table A.32: Differences of Garments in Pants Liner Weight Gain... 169
Table A.33: Differences of Garments in Station Uniform Weight Gain ... 170
Table A.34: Differences of Garments in Station Shirt Weight Gain ... 170
Table A.35: Differences of Garments in Station Pants Weight Gain ... 170
Table A.36: Differences of Garments in Helmet Weight Gain ... 171
Table A.38: Differences of Garments in SCBA Facepiece Weight Gain... 171
Table A.39: Differences of Garments in Gloves Weight Gain... 172
Table A.40: Differences of Garments in Shoes Weight Gain... 172
Table A.41: Differences of Garments in Underwear Weight Gain ... 172
Table A.42: Differences of Garments in Socks Weight Gain... 173
Table A.43: Differences of Garments in Accessory Weight Gain... 173
Table A.44: Test for Correlation Significance and Heteroscedasticity ... 174
Table A.45: Influential Diagnostics for ‘Rt (Manikin) vs. Rct (Hot Plate)’... 177
Table A.46: Influential Diagnostics for ‘Ret (Manikin) vs. ARet (Hot Plate)’ ... 177
Table A.47: Influential Diagnostics for ‘THL (Manikin, Standard) vs. THL (Hot Plate, Standard)’... 178
Table A.48: Influential Diagnostics for ‘THL (Manikin, Warm) vs. THL (Hot Plate, Warm)’... 179
Table A.49: Influential Diagnostics for ‘THL (Manikin, Standard) vs. Evaporative Heat Loss (Manikin, Standard)’ ... 180
Table A.50: Influential Diagnostics for ‘Ret (Manikin Option 2) vs. Ret (Manikin Option 1)’... 181
Chapter 1: Introduction
1.1 Purpose
Firefighting is a dangerous job and fatalities are an unfortunate, but inevitable part of the job. Since the United States Fire Administration (USFA) started tracking annual fatalities and their nature almost thirty years ago, there have been some disturbing trends that have warranted much research within the industry. During the last fifteen years, roughly 50% of the approximate 100 annual on-duty firefighter fatalities in the United States are attributed stress or overexertion [1]. This led the National Fire Protection Agency (NFPA) to form a committee on heat stress which was tasked with organizing research to address the topic.
The research led to the development of the Total Heat Loss (THL) test which was included as part of the NFPA 1971 standard for structural firefighting. The test uses a guarded sweating hot plate in order to determine the thermal and evaporative resistances of the garment materials. Since the development of the test, several studies have
investigated its ability to predict physiological responses in controlled wear trials using human subjects. Though different studies resulted in different conclusions, the THL test continues to be the standard for measuring the heat stress potential of turnout gear.
1.2 Research Objectives
plate and physiological testing. By testing the garments in the most realistic wearing conditions as possible, it may be possible to achieve more complete information as to how a garment could be expected to perform when worn in similar conditions in a
physiological wear trial. By comparing the hot plate, manikin, and physiological results I hope to validate the usefulness of the manikin for heat stress modeling and establish whether or not it can yield any beneficial information beyond that already capable by use of the sweating hot plate.
Specific major objectives and tasks of this research include:
1. Determine the relationship between heat transfer data (thermal resistance, evaporative resistance, and Total Heat Loss) measured by the sweating manikin and the hot plate
a. Measure the thermal and evaporative resistances of various turnout ensembles
b. Calculate predicted total heat loss on the manikin for standard hot plate conditions and physiological study conditions
2. Determine how heat transfer data measured on the manikin and hot plate compare with available physiological data
Chapter 2: Literature Review
2.1 Need for Research
The United States Fire Administration (USFA) has tracked and analyzed annual firefighter deaths for almost thirty years [2]. According to their reports, there have already been 64 on-duty U.S. firefighter fatalities this year (1/1/2005 to 7/31/2005) [3]. Of these fatalities, 38 (59.3%) have been classified as due to stress or overexertion. The ultimate cause of death in these fatalities has been a heart attack in 34 of the cases, cerebro-vascular accident (CVA) in another 2 cases, heat exhaustion in 1 case, and trauma in 1 case [3]. Often, during firefighting operations, heat stress and/or dehydration compromise the pumping of the heart leading to cardiovascular strain. This strain can be accompanied by insufficient blood flow to the heart and lead to chest pains or a heart attack [4]. The nature of these fatalities varies somewhat each year, but the overall numbers appear to be consistent with that which has been reported in the past.
From 1986 to 2003, an average 46.1% of on-duty firefighter fatalities were attributed to stress or overexertion [3, 5-23]1. During each of these years, stress or overexertion was the number one cause of on-duty fatalities, each year comprising
anywhere from 35.6% to 54.1% of the total on-duty fatalities [3, 5-23].2 Stress, including overexertion, has also been reported to make up a substantial amount of non-fatal
1 All numbers and calculations reflect the reported statistics for the annual report released for that year.
firefighter injuries in the past [24]. Figure 2.1 shows the reported number of on-duty firefighter fatalities from 1977 to 20033[22].
Figure 2.1: On-Duty Firefighter Fatalities (1977-2003)
The number of overall fatalities appears to be considerably lower in the latter 13 years in Figure 2.1 (since 1990 and excluding 2001) compared with the first 13 years (from 1977 to 1989). However, though the overall number of deaths seems to have decreased since 1977, there is little evidence to suggest that heat stress is any less of an issue. In fact, advancements in protective clothing that have been aimed at preventing burn injuries seem to have had a negative impact on heat stress [25]. Last year, the number of fatalities attributed to heat stress was 66, making up 56.4% of all on-duty fatalities reported [3].
or overexertion. The law declares that a firefighter will be considered to have died on-duty if he dies from a heart attack or stroke where his initial signs of illness were
observed either on-duty or within 24 hours after the end of a tour of duty in which he had engaged in non-routine, stressful or strenuous physical activity [2]. The increase in total fatalities reported by the USFA, because of the new definition of on-duty fatality by stroke or heart attack, is estimated to be between 6 and 8% [2]. This is not surprising since heart attacks (always overwhelmingly number one) and stokes (CVA) have consistently been the leading causes of fatalities that are attributed to stress or overexertion [3, 5-23]. This means that according to how we view things now, the number of heat- and stress- related deaths reported in the past is significantly lower than actually occurred. The need to address this issue of heat- and stress- related deaths with a considerable amount of research is obvious.
2.1.1 Heat Stress and Heat Strain
reaching core temperatures up to 41.4ºC indicating the true risk of heat-related illnesses or even death from heat stress in these realistic firefighting scenarios [29]. Reaching temperatures this high is especially dangerous because once the body temperature rises above about 40ºC the mechanisms that normally regulate body temperature around 37ºC stop working [28]. If the body is unable to lose heat, even small amounts of heat gained from working can cause heat strain within 30 minutes [2].
The ACGIH defines heat strain as “the overall physiological response resulting from heat stress.” [26]. One way to consider it is according to its engineering analogy in which strain is the result of an imposed stress [30]. Failure to treat heat strain
immediately can lead to a number of heat illnesses [26]. These illnesses include heat stroke (hyperthermia), heat exhaustion (heat prostration), heat cramps, heat rash (miliaria), transient heat fatigue, and fainting (syncope) [31]. Heat strain, when
combined with the exertion of typical firefighting duties, can also lead to cardiovascular strain due to decreased stroke volume [32]. This is thought to be a leading cause of heart attack and a major concern of the firefighting industry [32]. It is also possible that other heat-related deaths are reported as heart attacks or strokes since these deaths are often a diagnosis of exclusion and misclassified as one of these two, more familiar causes [33].
2.1.2 Heat Stress Development in Firefighter Garments
lose heat [34]. The weight, stiffness, and extra bulk at body joints all contribute to the turnout gear being an added metabolic burden in firefighting; wearing the complete ensemble with a Self Contained Breathing Apparatus (SCBA) typically increases heat production by about 30% over just the station uniform when performing the same task [34]. In addition to the extra work it entails, turnout gear also hampers the body’s ability to thermoregulate. If the body cannot lose heat, it will store it and become at risk of contracting a heat illness. The heat balance of the body is usually described by some variation of the following general equation:
Store = heat production – heat loss = (metabolic rate – external work) – (conduction + radiation + convection + evaporation + respiration) [27].
2.2 Heat Transfer
In order to combat heat stress, one must understand the relationship between the body, the clothing, and the environment and how they contribute to the development of heat stress. The first step in understanding this relationship is to understand the
mechanisms of heat transfer which define this relationship.
2.2.1 Dry Heat Transfer
insulations of the material layers alone [27]. Another unit that is used within the industry to describe a garment’s insulation is the clo unit. 1 clo equals 0.155 K·m²/W [36]. In a normal indoor environment, 1-clo ‘normal’ indoor clothing is the amount which will allow man to properly balance the heat produced at rest plus that which is lost through evaporation from his skin or water from his lungs [35, 37].
2.2.2 Evaporative Heat Transfer
A garment’s insulation is important in determining the heat loss ability of an individual; however, there is another unit that is, perhaps, a more important value when talking about heat stress in firefighter garments. With conduction, convection, and radiation often being avenues of heat gain during firefighting activities, heat loss by evaporation or through the lungs remain the only natural ways of passively cooling the body [38]. Heat loss through respiration occurs as one warms and moistens inspired air then releasing it to the environment; it can make up for up to 10% of the total heat production [27]. During firefighting, heat loss through respiration would mostly vary according to the rate at which one was breathing. Heat loss through evaporation, however, is a function of the garment materials and design. Firefighter turnouts, to be certified, are necessarily resistant to liquid flow [39]. Therefore, to evaporate through the firefighter garment, the sweat must travel through the garment’s moisture barrier as a vapor [40]. This can significantly reduce the ability of the body to cool itself by
there is a significant difference between garments that use moisture barriers which permit the transmission of vapor (breathable or semi-permeable garments) versus those which do not (non-breathable or impermeable garments). While some researchers have doubted that any noticeable differences would exist when worn in actual firefighting conditions, more recent studies have shown that in many cases physiological differences do exist [24, 34, 41-45]. At times, core body temperatures have been shown to be approximately 1.0 ºC lower when wearing breathable versus non-breathable garments [46]. The degree of breathability for a particular garment can be described in terms of its evaporative resistance (Ret [=] kPa·m²/W) [47]. Another common way of expressing a garment’s capability for evaporative heat transfer is by the permeability index (im). The
permeability index is normalized against an ideal condition of minimal still air alongside the naked skin and can range from 0 (totally impermeable) to 1 (totally permeable) [37, 48]. It is often used in conjunction with the clo value, termed the Permeability Index Ratio (expressed as i /clo), to indicate the percentage of maximum possible evaporative cooling obtainable for a particular garment in a particular environment [34]. Actual evaporative cooling is therefore regulated by both the evaporative resistance and insulation of the clothing [34].
m
2.2.3 Environmental Conditions and Heat Transfer
between the skin and the outside air [34]. This concept is apparent as you consider the governing equations for evaporative and dry heat loss:
Dry Heat Loss = (t – t )/I , sk a T where t = skin temperature,sk t = a air temperature, and I = T clothing insulation,
including air layers
Evaporative Heat Loss = (p – p )/R , where sk a T p = skin vapor pressure, sk P = air vapor pressure, and a R = clothing vapor resistance, T
including air layers [27].
than the skin temperature, sweat can always evaporate from the skin, even at 100% relative humidity [27].
2.3 Combating Heat Stress
Whether dry or evaporative, the ability of the body to lose heat depends on a number of factors including climate, the task, the characteristics of the person involved, and the clothing [49]. Usually, one would not be able to manipulate the environment, so must either modify the person, the task, or the clothing [34]. Modifying the person or the task are possibilities that are exist, but often are issues of training, logistics, or
practicality for the individual fire department [34]. Modifying the clothing is a job for scientists and engineers.
2.3.1 Clothing Considerations
2.3.2 NFPA 1971 Standard
The NFPA 1971 Standard on Protective Ensemble for Structural Fire Fighting is the critical standard in the industry which specifies the minimum design, performance, certification requirements and test methods for structural protective ensembles including protective coats, protective trousers, protective coveralls, helmets, gloves, foot-wear, and interface components [39]. This standard lays out the certain design and performance requirements for the clothing that must be passed by the clothing manufacturers for all structural firefighting gear. The standard has many detailed specifications which must be passed, but there are three in particular which are particularly relevant when thinking about heat stress. These considerations which seem to be crucial elements in the discussion of heat stress and its development are the various aspects of garment design, the thermal protective performance (TPP) requirement on the composite, and the total heat loss (THL) requirement on the composite.
2.4 Firefighter Garments
added as well. However, most turnout garments available today would consist of just the three required layers, each of them being a separate layer except that they may be
attached at the seams. Oftentimes firefighters will choose a particular garment design that they like and then specify which materials they want used for each layer of the garment. Manufacturing companies likewise often specialize in the fabrication of a particular layer. This is all due to the fact that each layer has a very different purpose and construction and must meet different, individual performance requirements.
Starting from the outside and moving toward the skin, the first layer of protection is the outer shell, followed by the moisture barrier and ending with the garment layer closest to the skin, the thermal liner. Most of the time the thermal liner is recognized as a single component, but occasionally it will be referred to as two separate components. These components would be the thermal batting (or thermal liner) and the face cloth (or inner liner) [25, 50]. All of these components would make up the garment composite which is, as mentioned earlier, used in the construction of the turnout coat and pants. The clothing underneath the garment is also important to consider since it is part of the total package of body protection. A station uniform, or at least a cotton t-shirt, is advised while synthetics such as nylon or polyester should not be considered [50].
2.4.1 Outer Shell
typical outer shell, thus, would consist of a woven fabric constructed of high strength, heat- and flame-resistant fibers. Some outer shells can provide some amount of improved thermal protective performance (TPP) or offer better resistance against water absorption than others. However, first and foremost, the outer shell must be able provide continued protection for the internal layers of the garment throughout the lifetime of the garment. This means it must be able to withstand extreme temperatures and the great deal of wear and tear involved in firefighting while maintaining its protective qualities [50].
2.4.2 Moisture Barrier
have been reported to allow reduced freedom of movement [51, 52]. A final point is that water is not the only liquid of concern. Moisture barriers are also designed to keep out other liquids including bodily fluids that may be carrying blood-borne viruses [39, 53]. This is important in keeping firefighters safe from diseases when handling victims. In addition to preventing water from getting into the system, the moisture barrier should also allow some amount of moisture vapor to exit the system [25]. In general, moisture
barriers are constructed of a product similar to a film of plastic laminated to a fabric (woven or non-woven) substrate [25]. Any time coatings, membranes or other treatments are added to fabrics, such as in this case, diffusion of vapor molecules is involved and there is a major effect on the vapor resistance [27]. The moisture barrier is thus a significant hurdle for evaporative sweat loss and should be highly breathable to reduce the amount of heat and moisture that are trapped inside the system [38, 50].
2.4.3 Thermal Liner
cloth. Face clothes often use long slippery and flexible yarns that allow for greater comfort and mobility in the turnout gear [50]. Face clothes also, by nature of some of the same properties, tend to wick moisture away from the body thus reducing feelings of discomfort associated with skin wettedness [50].
2.5Modifying Clothing: Performance Evaluation
Turnout gear, because of all its requirements, poses a great risk for heat stress. It is a relatively heavy, multiple layer system that necessarily will be both insulative and water vapor resistant [34]. It is this concern that has led the NFPA to set a requirement on turnout gear that attempts to limit the amount of heat stress imposed by turnout gear [54]. A task force was formed with the goal of developing a test methodology that could distinguish heat stress potential between garments within the range of interest [54]. The test needed to be reproducible, verifiable, and easily understood within the fire industry [54]. Their efforts resulted in the development of a test method based on the guarded sweating hot plate which they found to meet all of their outlined objectives [54].
2.5.1 Total Heat Loss Test
protective capability [45, 54]. Instead, with the debate as to the practicality of the test becoming part of the standard still ongoing, it was added merely as an appendix; it also made note that only in low to moderately stressful environments would the material differences in turnout garments be meaningful [45, 54, 55]. Researchers continued to investigate the issue during throughout the next decade, but still the test did not become part of the standard when the next revision came out in 1997 [56]. At the end of 1998, however, a report was released claiming the predictive capability of the THL test [41]. In the same year, a similar study found significant physiological differences between a non-breathable garment (THL value of 97 W/m²) and other non-breathable garments (THL values ranging from 146 to 251 W/m²) [48]. Little more than a year later, the NFPA convened early and released the new 2000 edition of the NFPA 1971 standard [56]. This version included the THL test with a minimum requirement of 130 W/m² as part of the standard [39]. The 2000 edition remains current as of right now, but will be updated in the upcoming 2006 edition where a new THL requirement of 205 W/m² is anticipated.
2.5.2 Development of the Total Heat Loss Test
with providing data from one or more of the test methods identified for relevant fabrics or garments and making a recommendation based on evaporative and conductive
measurements [54].
In the second meeting in 1989, after reviewing the literature and the availability of the test apparatuses for testing, one test was identified for thermal insulation
measurements (ASTM D1518) and three tests were identified for evaporative transfer measurements (Sweating Guarded Hot Plate, Canadian method CAN2-42-M77, and ASTM E96B or BW) [54]. Manikins were also considered but rejected because of limited availability and cost [54]. The heat stress task force, based on the capability to measure layered ensembles and compatibility with thermal balance theory, guided the sub task force to focus on the guarded hot plate and sweating guarded hot plate [54].
During the third meeting, it was decided that differences in apparatuses could be overcome by calibrating to a standard and that non-isothermal conditions would be used to represent a more realistic situation. The evaporative resistance term was also modified by the addition of the word ‘apparent’ to reflect that condensation might occur during testing [54]. Discussion of which procedure to use also began at this meeting. Though concluded later, it was eventually decided that the plate would be kept at 35 ºC and the environmental conditions would be 25 ºC and 65% relative humidity in the air stream [54].
Randolph in 1912) or thermal insulation (clo) and permeability index (im) (introduced by Woodcock in 1961) [54]. In the sixth meeting calibration issues were settled the standard method was finalized; in the seventh and final meeting inter-laboratory results were compared and the validity of the test was confirmed [54].
2.5.3 ASTM F-1868 Standard
The NFPA 1971 standard requires that the hot plate testing be done in accordance with the official American Society for Testing and Materials (ASTM) F-1868 Standard Test Method for Thermal and Evaporative Resistance of Clothing Materials Using a Sweating Hot Plate, originally adopted in 1998 [39, 57]. This standard could be viewed as the final result of the work started by the heat stress task force almost ten years prior and much of the original method remains intact.
For realistic evaluation of a protective garment’s heat transfer capabilities, one must be able to evaluate both the thermal (dry) and evaporative resistances of a garment [58]. The ASTM F-1868 standard calls for the use of a guarded sweating hot plate, which can be used (either dry or sweating) for evaluating both thermal and evaporative resistances [57]. NFPA 1971 and ASTM F-1868 lay out most specifications for the testing apparatus and procedure. However, there is some amount of leeway in the
2.5.4 Measuring Thermal Resistance
To measure the thermal resistance (Rct) of a fabric or layered fabric system, a square sample is cut to fit the dimensions of the outer plate (20” by 20”) and is then laid flat atop the plate. An inner heater and plate assembly (approximately 10” by 10”) is heated to 35 ºC to approximate human skin temperature [58]. The ensemble is layered and oriented as it would be constructed and worn in the garment with the face cloth toward the plate (skin) and the outer shell exposed to the ambient environment [39]. A 30” guard heater surrounds the inner heater to prevent lateral heat flow to or from the main, inner heater [59]. A second bucking heater is located beneath the main heater to eliminate axial heat flow away from test sample. All of the heat generated by the main heater is thereby directed toward the test sample [59]. The entire plate assembly is housed in an environmental test chamber that it set to keep the air at 25 ºC and 65% RH. A fan system also located within the chamber is set to control air flow across the test sample at 1.0 m/s. A computer controlled system measures the amount of electrical power required to keep the plate at a constant temperature in steady state conditions which is proportional to heat loss through the fabric system [58].
2.5.5 Measuring Evaporative Resistance
Evaporative resistance (Ret) is measured in much the same way with a few, key differences. The procedure and controls are basically the same with the main difference being that water is fed to the porous surface of the plate [58]. A fluoropolymer
wetting the fabric while allowing water vapor to evaporate through the fabric system [58]. Taking into account the thermal resistance of the particular fabric system, the new power requirement is related to the amount of water evaporating per unit time and the latent heat of vaporization [58]. Because non-isothermal conditions are used some amount of condensation may occur, so the resistance calculated is termed ‘apparent evaporative resistance’ (RetA or ARet) rather than pure ‘evaporative resistance’ [54]. The THL value (W/m²) called for by the NFPA 1971 standard can then be calculated from the Rct and ARet values.
2.5.6 Calculations
The thermal resistance (resistance to dry heat) is calculated based on
measurements of the surface temperature, test chamber air temperature, input power to the main heater and geometry of the test samples according to the following equation:
Rct = (Ts – Ta)A/Hc, where
Rct = resistance to dry heat transfer provided by the fabric system and surface air layer (K·m²/W),
A = area of the plate test section (m²), Ts = surface temperature of the plate (ºC), Ta = air temperature (ºC), and
The evaporative resistance is calculated based on measurements of the dry thermal
resistance, the input power to the main heater when the porous surface plate is wetted, the surface temperature, the test chamber air temperature, the saturated water vapor pressure at the surface of the porous plate, the water vapor pressure of the test chamber air, and the geometry of the test samples according to the following equation:
ARet = [(Ps – Pa)A] / [HT – (Ts – Ta)A/Rct], where
ARet = apparent total evaporative resistance of the specimen and surface air layer (kPa·m²/W)
Ps = water vapor pressure at the test plate surface (kPa),
Pa = water vapor pressure in the air flowing over the specimen (kPa), A = area of the plate test section (m²),
HT = power input (W),
Ts = temperature at the test plate surface (ºC),
Ta = temperature in the air flowing over the specimen (ºC), and Rct = total thermal resistance of the specimen and surface air layer (K·m²/W) [57, 59].
In order to determine the THL value of a fabric, one must first determine the intrinsic thermal resistance of the sample alone (Rcf) and the intrinsic evaporative resistance of the sample alone (ARef). The Rcf is determined by subtracting the average bare plate
resistance (Rebp) from the average apparent total evaporative resistance (ARet) of the samples tested [57]. Once these values have been obtained, the THL valued can then be calculated according to the following equation:
Qt = [(Ts – Ta)/(Rcf + Kc)] + [(Ps – Pa)/(ARef + Ke]
= [10.0ºC/(Rcf + 0.04)] + [3.57kPa/(ARef + 0.0035)], where Qt = total heat loss (W/m²)
Rcf = average intrinsic thermal resistance of the laboratory sample (K·m²/W),
Ref = average apparent intrinsic evaporative resistance of the laboratory sample (kPa·m²/W),
Ts = temperature at the test plate surface (ºC),
Ta = temperature in the air flowing over the specimen (ºC), Ps = water vapor pressure at the test plate surface (kPa),
Pa = water vapor pressure in the air flowing over the specimen (kPa), Kc = dry apparatus constant for nominal effective air velocity, and
The nature of the test design also allows the thermal and apparent evaporative resistances to be easily converted into thermal insulation (clo) and permeability index (im) according to the following equations:
clo = Rct*6.45, where clo = unit of thermal insulation and Rct = thermal resistance (K·m²/W);
im = (Rct/ARet)*0.061, where im = permeability index,
Rct = thermal resistance (K·m²/W), and
ARet = apparent evaporative resistance (kPa·m²/W)
2.5.7 Balancing Total Heat Loss with Thermal Protective Performance
injuries in a similar situation [25]. The minimum requirement to pass the standard is a TPP rating of 35 which equates to 17.5 seconds until second degree burns would be produced in a flashover condition [25].
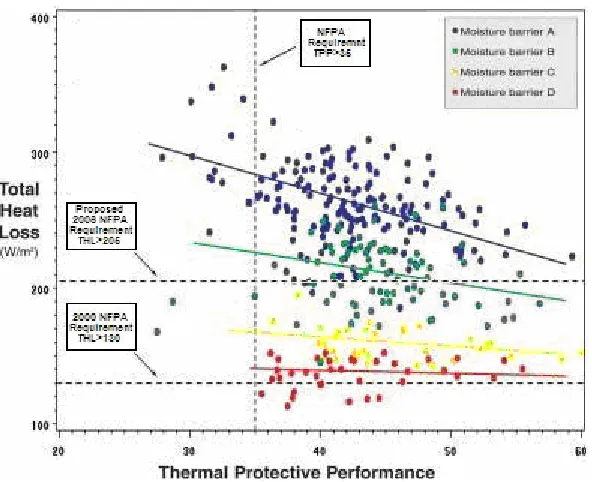
Total heat loss and thermal protective performance are often thought of as trade-offs for one another because of the seemingly inherent contradiction. Figure 2.2 shows the general negative correlation between THL and TPP (plotted from data publicly available from Fire Safe Associates) [61].
THL vs. TPP
0 50 100 150 200 250 300 350
40 45 50 55 60 65 70
TPP
TH
L
Figure 2.2: THL vs. TPP for Garment Composites from 4 Various Outer Shells, 3 Various Moisture Barriers and 5 Various Thermal Liners
Figure 2.3: Typical Negative Correlation between THL and TPP for Several Garments (Color Separated by Moisture Barrier)
In Figure 2.3, the effect of the moisture barrier is obvious per the separation and varying slopes of the regression lines. This could be one explanation for why there is a relatively weak correlation in Figure 2.2 where three fundamentally different moisture barriers were included in the dataset. Moisture barriers affect heat loss mostly through their limited evaporative heat transfer and thus can make a difference of more than 100 points in the THL rating while having no appreciable impact on TPP [50]. By the same logic, THL and TPP are not absolute trade-offs for one another, but can be optimized by strategically selecting each component of the garment.
barriers (C and D) appear to have THL values ranging from about 115 to 200 W/m², a range in which none of the configurations would meet the new requirement. It is likely that these latter two moisture barriers could represent outdated technologies as far as firefighting moisture barriers are concerned. However, there is no indication of the barrier properties or the outer shell and thermal liners that were used to generate this data so as to substantiate this idea. An apparent trend in Figure 2.3 is the increasing slopes of the regression line as the THL increases. The most likely explanation for this
phenomenon is that as THL becomes less dependent on the moisture barrier, it becomes more dependent on the insulative properties of the thermal liner. It is well known that permeable (breathable) moisture barriers provide much higher THLs than impermeable barriers when laid up with the same outer shell and thermal liner [55]. McCullough reports evaporative resistances measured on the sweating hot plate to have strong correlations (up to 91% Spearman correlation) with several water vapor transmission tests [47]. Therefore, selecting a permeable membrane to allow maximum evaporative heat transfer should allow the garment to be optimized by careful selection of the thermal liner, which has the greatest impact on TPP as well as a considerable impact on THL [50]. The ability to increase total heat loss without necessarily compromising thermal protection is a very important and realizable endeavor.
2.6 Limitations of the Sweating Hot Plate Test
very tedious and time-consuming. With so many variables to be controlled, reaching steady state is often quite difficult. During wet testing, since non-isothermal conditions are used, any tests that run over 4 hours must be aborted and samples reconditioned before attempting to test the same specimen because of the effects of condensation [58]. Also, getting fabrics to stay flat on the plate can be quite an issue. All firefighter
garments contain a moisture barrier. If this barrier is constructed of a hydrophilic coating or laminate as many are, its vapor permeability will increase as it becomes hydrated [58]. If these barriers can absorb moisture from the plate, swell, ripple and lift off the plate. When this happens air gets trapped within the specimen causing abnormally high evaporative resistances to be measured [58].
Similar problems can arise in connection with the air flow stream. Often,
2.6.1 Fabric versus Clothing
One major limitation of the sweating hot plate is that it can only provide intrinsic values for fabrics, not clothing. The results, therefore, cannot accurately describe the entire garment without consideration of the amount of body surface area covered by different fabrics, distribution of the fabric and air layers on the body, the fit, and the increased surface area for heat loss [58]. For firefighter garments, there is also the consideration of trim, pockets, flaps and other hardware or accessories that make up part of the clothing system. Therefore, there is the potential for much disconnect between the material values measured by the sweating hot plate and how they would perform in actual wear conditions.
2.6.2 Heat Transfer with the Hot Plate
across the surface of the fabric in a direction nearly parallel to the surface. This is hardly representative of actual wind conditions on a human body [58]. That may be a minor point, but the avenues of heat loss in general may not be so minor.
There are many aspects of the sweating hot plate test that cause it to be much less representative of actual heat transfer than that which may be possible with other research tools. First, layers are flat atop one another which may exaggerate dry microclimate conduction. This also means that there is a lack of fully developed boundary air layers [40]. This not only reduces the total insulation but also restricts evaporative mass transfer by convection when interlayer air movement is possible [40]. In wet testing, only water vapor can pass through the membrane so liquid development at the surface (skin) is minimal and thus wet conduction may be underestimated. Minimal liquid at skin also may not allow for proper consideration of transport through capillary action or evaporation at other locations [40]. Another big limitation of the sweating hot plate is that it does not consider convection that is possible from ventilation or body motion [63]. In fact, the convection must almost necessarily be only from the outer shell where all heat must escape through the material. In reality there are many avenues in which heat may escape around the material.
one another. These are significant considerations to keep in mind; the hot plate is a valuable tool, but it does not represent how realistic wearing conditions may affect heat stress.
2.7 The Sweating Manikin as a Supplemental Tool
2.8 Physiological Wear Trials
Even though other sophisticated measurement technologies, such as thermal manikins exist, in the recent past and still today much focus throughout the industry has been on assessing the value of the hot plate. If the hot plate is deemed adequate to provide information to predict heat stress and set performance requirements, it is a rather cheaper and more widely available tool than most viable alternatives. Since heat stress has continued to be a considerable concern in the industry, it is not surprising that many have seemingly lobbied for performance requirements to be raised. In order to make meaningful decisions on raising performance requirements, however, research was needed to assess how the information provided by the hot plate could be translated into some physiological response indicating a credible risk of heat stress. The primary means of doing so was through physiological testing in which material properties could be measured and then compared with physiological responses such as skin temperature, core temperature, heart rate, etc. that would be measured in a controlled laboratory experiment using human subjects. Two of the more prominent reports which have been presented to and reviewed by the NFPA for making the assessments such described were the
International Firefighter Protective Clothing Breathability Research Project and the Field Evaluation of Protective Clothing Effects on Fire Fighter Physiology: Predictive
2.8.1 International Firefighter Protective Clothing Breathability Research Project The International Firefighter Protective Clothing Breathability Research Project was conducted at North Carolina State University in 1998 under the leadership of Dr. Roger Barker of NCSU and Dr. Loren Myrhe of Alamo Physiological Research Institute. The study was divided into two parts: a Mild Environment Protocol and a Warm
Environment Protocol. Although the protocols were very different, other aspects of the study were designed in a parallel fashion. For both protocols physiological data was recorded and consisted of core temperature, skin temperatures (chest, arm, back, and thigh), and heart rate. Microclimate humidity was measured inside the turnout near the subjects back. Also, subjects and their clothing were weighed pre- and post- testing to assess moisture loss in subject (evaporation) and moisture gain in clothing (absorption). In addition to the objective data gathered, subjects were also asked to rate the clothing (or their response to the clothing) subjectively for overall wear comfort, heat sensation, skin moistness, heaviness, flexibility, fatigue, fit, sense of protection, and overall like or dislike [48]. Other issues of preparation, data collection, and general execution were also very similar for the two protocols. Basically the only differences in the protocols were those which were by design, including the test conditions, the configuration of clothing worn, and the exercise routine.
2.8.1.1 Mild Environment Protocol
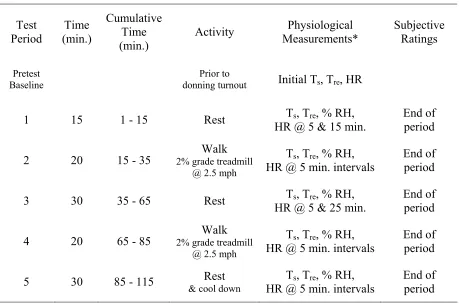
pants over a station uniform and underwear with socks and walking shoes. The turnout garments consisted of six NFPA compliant systems with total heat loss values (hot plate) ranging from 97to 251 W/m2 [48]. The garments used were the same as those tested on the manikin and further details about each garment can be found in Chapter 3 of this report. The environmental conditions were set at 21ºC, 65% RH to represent a ‘mild’ climate [48]. Table 2.1 outlines the experimental protocol that was followed [48].
Table 2.1: Mild Environment Protocol for Breathability Research Project
Test
Period (min.) Time
Cumulative Time (min.)
Activity Measurements* Physiological Subjective Ratings
Pretest
Baseline donning turnoutPrior to Initial Ts, Tre, HR
1 15 1 - 15 Rest HR @ 5 & 15 min. Ts, Tre, % RH, End of period
2 20 15 - 35 2% grade treadmill Walk @ 2.5 mph
Ts, Tre, % RH, HR @ 5 min. intervals
End of period
3 30 35 - 65 Rest Ts, Tre, % RH,
HR @ 5 & 25 min.
End of period 4 20 65 - 85 2% grade treadmill Walk
@ 2.5 mph
Ts, Tre, % RH,
HR @ 5 min. intervals End of period 5 30 85 - 115 & cool downRest HR @ 5 min. intervals Ts, Tre, % RH, End of period
*Ts = Skin temperature of chest, back, arm and thigh Tre = Rectal temperature
Once the all of the sessions were completed, all of the data was compiled and analyzed. The following findings were reported:
Regardless of turnout worn, light work in a moderate environment does not result in a significant increase in core temperature; the max rise (<0.6C) did not
approach physiological heat stress limits for any of the garments worn;
No significant differences in either core temperature or heart rates were observed that could be correlated with differences in turnout breathability;
There are small but significant differences in skin temperature of different turnout garments (Garment 4 generates the highest skin temperature);
Major changes in humidity are highly associated with changes in physical activities, far more so than differences in the garment material components; still microclimate humidity buildup increases as the composite sweating hot plate total heat loss value decreases;
Analysis of subjective data indicates that firefighters can decisively perceive and differentiate among composites on the basis of comfort sensations only for Garment 4 (non-breathable); the most significant differences were reported for feelings of warmth and skin wetness;
Based on these findings the researches concluded that for these low work loads, in a mild environment, physiological heat stress limits were not approached, regardless of the “breathability” of the turnout composite. They also noted that there was no indication that core temperature or heart rates were significantly affected by differences in turnout breathability for these conditions. They did, however, recognize that differences in turnout breathability could be associated with perceived levels of comfort (higher THL values related to lower skin temp and less moisture buildup in microclimate). These differences, however, were only decisively perceived for Garment 4. Particularly, Garment 4 was noted to produce greater feelings of warmth and skin wetness in the wearer seemingly due to its non-breathability [48]. On the whole, the researchers’ general conclusion seemed to be that in these mild conditions differences between garments were minor with the only real difference being a perception of moderate discomfort imposed by wearing the non-breathable garment.
2.8.1.2 Warm Environment Protocol
Part 2 of the study, the Warm Environment Protocol, was designed to represent a warm climate with moderate work activity [48]. Subjects wore the same turnout coats and pants as in the Mild Environment Protocol, also worn over a station uniform, but with all of the additional gear as would be worn during structural firefighting. As in the Mild Environment Protocol, the subjects wore walking shoes rather than boots.
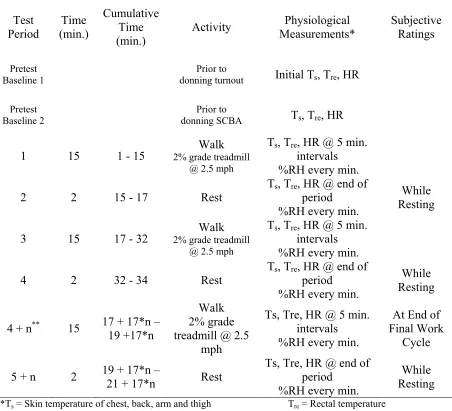
ambient air [48]. The environmental conditions were set at 39ºC, 35% RH to represent a ‘warm’ climate [48]. Table 2.2 outlines the experimental protocol that was followed [48].
Table 2.2: Warm Environment Protocol for Breathability Research Project
Test Period Time (min.) Cumulative Time
(min.) Activity
Physiological Measurements*
Subjective Ratings
Pretest
Baseline 1 donning turnoutPrior to Initial Ts, Tre, HR
Pretest
Baseline 2 donning SCBAPrior to Ts, Tre, HR
1 15 1 - 15 2% grade treadmill Walk @ 2.5 mph
Ts, Tre, HR @ 5 min. intervals %RH every min. 2 2 15 - 17 Rest Ts, Tre, HR @ end of period
%RH every min.
While Resting 3 15 17 - 32 2% grade treadmill Walk
@ 2.5 mph
Ts, Tre, HR @ 5 min. intervals %RH every min. 4 2 32 - 34 Rest Ts, Tre, HR @ end of period
%RH every min.
While Resting
4 + n** 15 17 + 17*n – 19 +17*n
Walk 2% grade treadmill @ 2.5
mph
Ts, Tre, HR @ 5 min. intervals %RH every min.
At End of Final Work
Cycle 5 + n 2 19 + 17*n –
21 + 17*n Rest
Ts, Tre, HR @ end of period
%RH every min.
While Resting
*Ts = Skin temperature of chest, back, arm and thigh Tre = Rectal temperature
% RH = percent relative humidity in the clothing microclimate HR = Heart rate
**Work/Rest cycles continued until either subject’s Tre reached
Once the all of the sessions were completed, all of the data was compiled and analyzed. The following findings were reported:
The minor differences in core temperature and heart rate between garments were not statistically significant;
Differences in mean skin temperatures were not statistically significant for any of the garments during the first work cycle but did become significant at later times (limited to 0.3 to 0.9°C) for Garment 4 when compared with the others; there was no correlation between sweating hot plate values and mean skin temperature for any garment;
Work tolerance time (predominately subjective) was significantly less for Garment 4 than all other garments; the actual difference was about 6-7 minutes (13% less than the breathable-garment average) and correlated well with mean skin temperature;
When considering each garments sweating hot plate value, no statistical
differences were found for any of the physiological indices of heat stress during the first 30 minutes of work. Thereafter, only mean skin temperature was significantly different and only for Garment 4; no other garments were
significantly different from one another, regardless of sweating hot plate values; Several of the subjective responses indicated significant comfort disadvantages
Garment 4 produced the highest sweat accumulation and lowest sweat evaporation, which correlate with subjective perceptions of skin wettedness. However, regardless of the breathability, the total amount of sweat evaporated averaged less than 10% of the total sweat produced. Though statistical
significances exist between garments, this small volume would be insignificant with respect to protecting from cumulative heat stress for any garment [48].
2.8.2 Field Evaluation of Protective Clothing Effects of Fire Fighter Physiology: Predictive Capability of Total Heat Loss Test
The Field Evaluation of Protective Clothing Effects of Fire Fighter Physiology was conducted in 1998 by the International Association of Fire Fighters (IAFF) under the technical direction of Jeffrey O. Stull. The study was divided into two parts: an
Extrication Simulation Protocol and a Ladder Company Simulation Protocol. Although some aspects of the protocols were different, most facets of the study were very similar. For both protocols physiological data was recorded and consisted of core temperature, skin temperatures (arm and thigh), and heart rate. Also, subjects and their clothing were weighed pre- and post- testing to assess moisture loss in subject (evaporation) and moisture gain in clothing (absorption). In addition to the objective data gathered, subjects were also asked to rate the clothing (or their response to the clothing) subjectively for overall wear comfort, heat sensation, skin moistness, heaviness,
flexibility, fatigue, fit, sense of mobility, and ease of donning/doffing [41]. Other issues of preparation, data collection, and general execution were also very similar for the two protocols. Basically, the only differences in the protocols were those which were by design, including the test conditions, the configuration of clothing worn, and the exercise routine.
2.8.2.1 Extrication Simulation Protocol
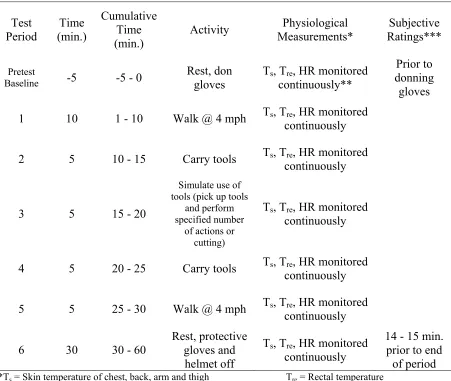
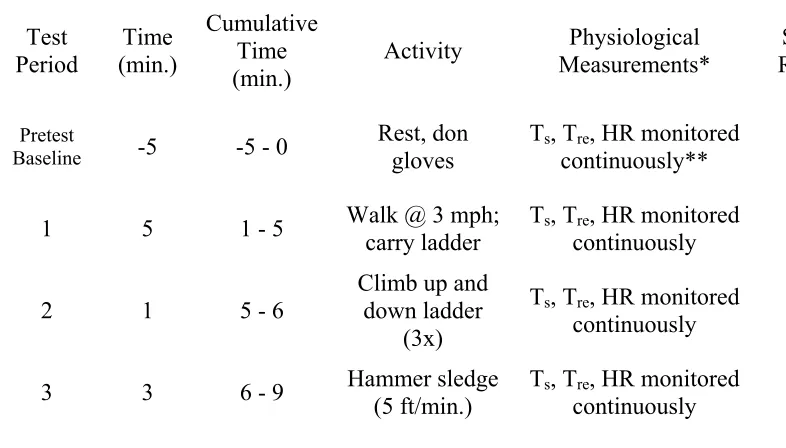
Table 2.3: Extrication Simulation Protocol for IAFF Field Evaluation Test Period Time (min.) Cumulative Time (min.)
Activity Physiological Measurements*
Subjective Ratings***
Pretest
Baseline -5 -5 - 0 Rest, don gloves Ts, Tcontinuously** re, HR monitored
Prior to donning
gloves 1 10 1 - 10 Walk @ 4 mph Ts, Tcontinuously re, HR monitored
2 5 10 - 15 Carry tools Ts, Tre, HR monitored continuously
3 5 15 - 20
Simulate use of tools (pick up tools
and perform specified number
of actions or cutting)
Ts, Tre, HR monitored continuously
4 5 20 - 25 Carry tools Ts, Tre, HR monitored continuously 5 5 25 - 30 Walk @ 4 mph Ts, Tre, HR monitored
continuously
6 30 30 - 60
Rest, protective gloves and
helmet off
Ts, Tre, HR monitored continuously
14 - 15 min. prior to end of period
*Ts = Skin temperature of chest, back, arm and thigh Tre = Rectal temperature
HR = Heart rate ** Every 9 seconds
***Subjective data related to ergonomics was only taken after activity
Findings applicable to both simulations will be reported in the next section; the following findings specific to the Extrication Simulation were reported:
Differences in mean core temperature rise could be seen at the end of activity period (0.2ºC) with significant differences manifesting at the end of the rest period (0.57 ºC spread);
Three groupings of ending core temperature rise were observed corresponding to the low total heat loss systems (highest rise), systems with THL values in the range of 141.6 to 251.5 W/m2 (intermediate), and the system with no thermal liner or moisture barrier, Garment 7 (lowest rise). Only Garment 7, however, showed to be significantly different based on the p-value criterion of 0.05;
Ending skin temperature rises exhibited larger ranges for the Extrication Simulation than for the Ladder Company Simulation;
In the Ladder Company Simulation, garment weight generally provided the best explanation for subjective responses. For the Extrication Simulation, however, other independent variables provided better explanations of subjective responses for heat sensation (THL), flexibility (evaporative resistance), and fatigue (TPP) [41].