ABSTRACT
WATKINS, JESSICA LEIGH. Evaluation of Grip and Dexterity Test Methods for Characterization and Improvement to Structural Firefighting Glove Design. (Under the direction of Dr. Roger Lee Barker.)
This research investigates relationships between the construction of structural firefighting
gloves and their dexterity and grip performance. Twenty-four structural firefighting gloves
and controls are characterized for dexterity and grip performance. Newly developed test
methods are compared on the basis of testing variability and ability to provide data that are
responsive to differences in glove dexterity and grip performances. Factors of glove
materials and construction that affect dexterity and grip performance are identified through
these analyses.
This study provides insights into how materials and glove designs affect dexterity
and grip performance. Analyses cover layer-, construction- and material- specific aspects of
glove design that have a significant effect on dexterity and grip performance. The study
indicates ways that structural firefighting gloves can be designed to simultaneously provide
Evaluation of Grip and Dexterity Test Methods for Characterization and Improvement to Structural Firefighting Glove Design
by
Jessica Leigh Watkins
A thesis submitted to the Graduate Faculty of North Carolina State University
in partial fulfillment of the requirements for the degree of
Master of Science
Textile Engineering
Raleigh, North Carolina
2011
ii BIOGRAPHY
Jessica Leigh Watkins was born August 13, 1987 to Julie Shrauger and Gary Watkins in
Statesville, North Carolina. She attended Woodleaf Elementary School in Woodleaf where
she grew up and West Rowan Middle and High School where she was actively involved in softball, Junior Civitan, and her Latin Class’ Junior Classic League. In the summer of 2004,
Jessica was nominated to attend Governor’s School for Natural Science at Meredith College
in Raleigh where she solidified her love for the sciences and for Raleigh.
In 2005, Jessica was awarded the Spectrum Dyed Yarns Scholarship to the Textiles
Program at North Carolina State University where she graduated Suma Cum Laude and Valedictorian with a Bachelor’s of Science in Textile Technology in 2009. During her
undergraduate study, Jessica worked as a Chemistry 101 tutor for three years and as a Fiber Lab Teacher’s Assistant for two years. She enjoyed an internship position at the Hillcrest
Nonwovens Plant in South Carolina with Milliken and Co.’s Summer Challenge Program in
the summer of 2008. The following summer, Jessica worked on a special project where she
designed twisted PVA and CNT yarns and converted them to a woven fabric for aerospace
application.
Accepted into the Graduate Program at the College of Textiles in 2009, Jessica was
invited to become a part of the research team at the Center for Textile Protection and
Comfort at NC State. Here she was fortunate enough to help develop new grip and dexterity
test methods for structural firefighting gloves, evaluate the reliability of these tests and utilize
them to recommend design improvements to structural firefighting gloves based on. Jessica
ACKNOWLEDGMENTS
First, I would like to thank my project leader and mentor, Dr. Roger Barker, whose advice, wisdom and encouragement has helped to ease my journey. I’d like to thank Dr. Peter
Bloomfield for his sound statistical advice and Dr. Jeff Joines not only for being a valuable
part of my committee, but also for his time, understanding and exceedingly helpful expertise. I’d also like to extend my sincerest gratitude to Mr. Don Thompson for inviting me to
become a part of the T-PACC research team.
Without the T-PACC research team, my progress would have been much more
difficult and I would like to thank all who have either cut samplesor kept me sane over the past two years: Alex, Ashley, Andrew, Lauren, Taylor and Bryan. I’d like to especially
thank Mr. Shawn Deaton and Kevin Ross whose unparalleled help, drive and knowledge never seemed to have an end. I’ve been so grateful, not only for the help, but for the
friendships that I have developed during my time at T-PACC.
I’d especially like to thank my family for their support, love and encouragement
through the tough times. I would like to thank my mom for speaking Truth into my life when
things seems bleak and my dad and Diane for providing me with the encouragement and
support that I needed. I would like to thank my sister, Katie, for being super-cool and for
reminding me to have fun when I needed it. I love you all. I’d also like to thank Brian
iv
TABLE OF CONTENTS
List of Tables………vii
List of Figures………ix
Chapter 1. Introduction ... 1
1.1 Need for Research ... 1
1.2 Dexterity Study Objectives ... 3
Chapter 2. Dexterity of Structural Firefighting Gloves ... 5
2.1 Dexterity Test Methods ... 5
2.2 NFPA 1971 Test Requirements for Glove Dexterity Performance ... 7
2.2.1 Limitations and Drawbacks of the Current Glove Dexterity Test Method ... 9
2.3 Characterizing the Effects of Gloves on Dexterity Performance ... 10
Chapter 3. Dexterity Study Experimental Procedures ... 12
3.1 Test Gloves ... 12
3.2 Glove Dexterity Tests ... 14
3.2.1 Human Subject Evaluators ... 14
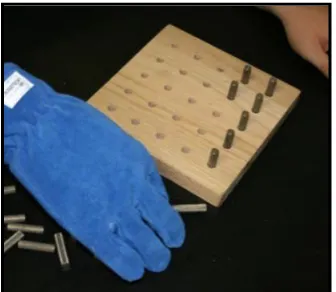
3.2.2 Modified Pegboard Test: Knurled Pins ... 14
3.2.3 Modified Pegboard Test: Smooth Pins ... 16
3.2.4 Incremental Lift Test ... 16
3.2.5 Tool Test... 18
3.3 Characterization of Glove Material Properties ... 20
3.3.1 Composite Weight ... 20
3.3.2 Composite Thickness ... 21
3.3.3 Composite Density ... 21
3.3.4 Coefficient of Friction ... 21
3.3.5 Material Stiffness ... 22
3.3.6 Compressive Resilience... 23
3.3.7 Bending ... 23
3.3.8 Roughness ... 23
3.3.9 Shear ... 24
3.4 Characterization of Whole Glove Properties ... 24
3.4.1 Glove Volume: Whole Glove Bulk ... 24
3.4.2 Finger Circumference ... 25
3.4.3 Glove Stiffness ... 26
3.5 Glove Design and Construction Features ... 27
3.5.1 Outer Shell Materials ... 27
3.5.2 Moisture Barrier Materials ... 28
3.5.3 Thermal Liner Materials ... 29
3.5.4 Layered Constructions ... 29
3.5.5 Glove Constructions and Designs ... 29
3.5.6 Thumb Designs ... 30
Chapter 4. Dexterity Study Results and Discussion... 34
4.1 Dexterity Performance Assessed Using the NFPA 1971 Pegboard Method ... 34
4.2 Comparing Dexterity Test Methods Based on Variability and Ability to Differentiate Glove Performance ... 35
4.2.1 Evaluation of Test Measurement Range ... 36
4.2.2 Evaluating the Discriminating Power of Dexterity Test Methods... 37
4.2.3 Correlation Between Objective Measures and Subjective Perception of Glove Dexterity Performance ... 43
4.3 Comparing the Incremental Lift and Tool Dexterity Tests ... 45
4.3.1 Factors Affecting Glove Performance Assessed in the Incremental Lift Test ... 47
4.3.2 Effect of Glove Construction on Performance in Tool Dexterity Test ... 52
4.4 Predicting Dexterity Performance Based on Materials Properties ... 56
4.5 Factors Affecting Incremental Lift Test Dexterity Performance ... 57
4.5.1 Predictors of Glove Bulk ... 60
4.5.1.1 Relationship Between Glove Bulk and Measured Stiffness ...63
4.5.1.2 Relationship Between Palm Composite Thickness and Glove Bulk ...64
4.6 Factors Affecting Tool Test Dexterity Performance ... 65
Chapter 5. Dexterity Study Conclusions ... 73
Chapter 6. Gloved Grip Study ... 75
6.1 Introduction ... 75
6.1.1 Contact Area and Handle Diameter ... 77
6.1.2 Force Distribution ... 79
6.1.3 Contact Area and Friction ... 81
6.2 Effect of Gloves on Grip ... 82
6.3 Grip Study Objectives ... 84
6.4 NFPA 1971Tests for Glove Grip Performance ... 84
6.5 Limitations and Drawbacks of the Current Glove Grip Test Method ... 85
Chapter 7. Grip Study Experimental Procedures ... 86
7.1 Glove Grip Tests... 86
7.1.1 Wet Conditioning ... 86
7.1.2 Horizontal Wet Rope Pull: Fixed Stance ... 87
7.1.3 Horizontal Wet Rope Pull: Free Stance ... 89
7.1.4 Vertical Wet Rope Pull ... 89
7.1.5 Vertical Dry Pole Pull ... 89
7.1.6 Vertical Wet Pole Pull ... 90
7.1.7 Dry Torque Test ... 90
vi
8.4 Comparing the Wet and Dry Torque Tests ... 104
8.5 Factors Affecting Performance in the Wet Torque Grip Test ... 109
8.5.1 Significant Factors Affecting Grip Performance ... 110
8.5.2 Palm Shell Thickness Relationships ... 116
8.5.3 Material and Construction Factors Affecting Grip Performance ... 119
Chapter 9. Grip Study Conclusions... 121
Chapter 10. Designing Gloves for Enhanced Dexterity and Grip Performance ... 123
References……….………..125
Appendices………..129
Appendix A - Measurement Procedures……….130
Appendix B – Additional Model Statistics ... 135
B.1 Designing for Dexterity, As Measured by the Incremented Lift Test... 135
B.1.1 Analysis of Whole Glove Bulk ... 137
B.1.2 Continued Analysis of Whole Glove Bulk ... 140
B.1.3 Analysis of Thumb Circumference ... 143
B.1.4 Continued Analysis of Thumb Circumference ... 144
B.1.5 Analysis of Whole Glove Stiffness ... 146
B.2 Analysis of Dexterity: Tool Test ... 148
B.3 Continued Analysis of Dexterity: Tool Test ... 150
B.4 Designing for Grip, As Measured by the Wet Torque Test ... 153
LIST OF TABLES
Table 3.1 Test Gloves ... 13
Table 4.1 Dexterity Test Method Variability ... 38
Table 4.2 Objective/Subjective Dexterity Correlation Summary Table ... 44
Table 4.3 Lift Test/Tool Test Correlation Summary Table ... 45
Table 4.4 Single Predictors of Dexterity Performance ... 56
Table 4.5 Incremental Lift Test Prediction Models ... 58
Table 4.6 Moisture Barrier/Connection Type Relationships ... 59
Table 4.7 Tool Test Prediction Models ... 66
Table 8.1 Grip Test Method Variability Summary ... 103
Table 8.2 Wet Torque Test/Dry Torque Test Correlation Summary Table ... 104
Table 8.3 Wet Torque Test Prediction Models... 110
Table 8.4 Wet Torque Grip Rating Averages for Each Partition Group ... 112
Table 8.5 Effect of Glove Construction on Shell Thickness and Wet Torque Grip Performance ... 118
Table A.1 Hand Sizing Data for Human Test Subjects ... 131
Table B.1 Summary of Fit: Model 1 ... 135
Table B.2 Analysis of Variance: Model 1 ... 135
Table B.3 Parameter Estimates: Model 1 ... 135
Table B.4 Effect Tests: Model 1 ... 135
Table B.5 Summary of Fit: Model 2A ... 137
Table B.6 Analysis of Variance: Model 2A ... 138
Table B.7 Parameter Estimates: Model 2A ... 138
Table B.8 Effect Tests: Model 2A ... 138
Table B.9 Summary of Fit: Model 2B ... 141
Table B.10 Analysis of Variance: Model 2B ... 141
Table B.11 Parameter Estimates: Model 2B ... 141
Table B.12 Effect Tests: Model 2B ... 142
Table B.13 Summary of Fit: Model 3 ... 143
Table B.14 Analysis of Variance: Model 3 ... 143
Table B.15 Parameter Estimates: Model 3 ... 143
Table B.16 Effect Tests: Model 3 ... 143
Table B.17 Least Squares Means Table: Model 3 ... 144
Table B.18 Summary of Fit: Model 4 ... 145
Table B.19 Analysis of Variance: Model 4 ... 145
Table B.20 Parameter Estimates: Model 4 ... 145
Table B.21 Effect Tests: Model 4 ... 146
Table B.22 Summary of Fit: Model 5 ... 147
Table B.23 Analysis of Variance: Model 5 ... 147
viii
Table B.32 Effect Tests: Model 6 ... 150
Table B.33 Least Squares Means: Model 6 ... 153
Table B.34 Connecting Letters Report Palm Shell Thickness by Constrction (M and U Exclusion) Student's t Test ... 153
Table B.35 Partition Model Results for Wet Torque Test Grip Rating ... 154
Table B.36 Leaf Report for Wet Torque Test Partition Model ... 154
Table B.37 Summary of Fit: Model 7 ... 155
Table B.38 Analysis of Variance: Model 7 ... 155
Table B.39 Parameter Estimates: Model 7 ... 156
Table B.40 Effect Tests: Model 7 ... 156
Table B.41 Summary of Fit : Model 8 ... 157
Table B.42 Analysis of Variance: Model 8 ... 158
LIST OF FIGURES
Figure 1.1 Structural Glove Attributes Disliked by Firefighters [4] ... 2
Figure 1.2 Percentage of Firefighters Removing Gloves to Perform Tasks [4] ... 3
Figure 2.1 Bennett Hand-Tool Dexterity Test [13] ... 8
Figure 3.1 Modified Pegboard Dexterity Test: with Knurled Pins ... 15
Figure 3.2 Incremented Lift Dexterity Test ... 17
Figure 3.3 Tool Dexterity Test ... 18
Figure 3.4 Inclined Plane Apparatus for Static Coefficient of Friction Measurement ... 22
Figure 3.5 Whole Glove Bulk Measurement ... 25
Figure 3.6 Measurement of Index Finger Circumference ... 26
Figure 3.7 Pneumatic Hand Form ... 27
Figure 3.8 Pressure Gauge for Pneumatic Hand Form ... 27
Figure 3.9 Structural Firefighting Glove Constructions………...30
Figure 3.10 Glove Thumb Designs……….……..31
Figure 3.11 Moisture Barrier to Shell Connections………..32
Figure 3.12 Thermal Liner to Moisture Barrier Connections………33
Figure 4.1 Glove Dexterity Measured using Modified Pegboard Test with Knurled Pins (Avg. of 5 test subjects) ... 35
Figure 4.2 Measurement Range of Dexterity Tests for NFPA 1971 Compliant Gloves ... 37
Figure 4.3 Subject-to-Subject Variability within Pegboard Test with Knurled Pins ... 39
Figure 4.4 Subject-to-Subject Variability within Pegboard Test with Smooth Pins ... 41
Figure 4.5 Subject-to-Subject Variability within Incremental Lift Test... 42
Figure 4.6 Subject-to-Subject Variability within Tool Test ... 43
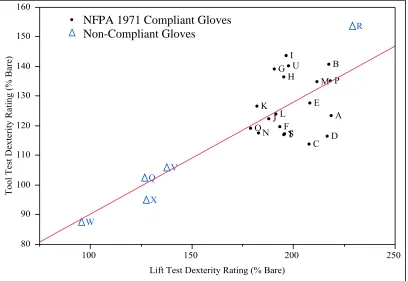
Figure 4.7 Tool Test and Incremented Lift Test Correlation by Glove Dexterity Rating ... 46
Figure 4.8 Lift Test Dexterity Performance of NFPA 1971 Compliant Gloves ... 47
Figure 4.9 Effect of Moisture Barrier on Glove Lift Test Dexterity Performance (Gunn Cut Glove Designs) ... 49
Figure 4.10 Effect of Moisture Barrier on Lift Test Dexterity Performance ... 51
Figure 4.11 Effect of Palm Layers on Lift Test Dexterity ... 52
Figure 4.12 Dexterity Performance as Measured by the Tool Test ... 53
Figure 4.13 Effect of Moisture Barrier on Tool Test Dexterity Performance ... 54
Figure 4.14 Tool Test Dexterity Performance of NFPA 1971 Compliant Gloves ... 55
Figure 4.15 Glove Bulk (cm3) vs. Lift Test Dexterity Rating (% Bare) (all 24 gloves) ... 57
Figure 4.16 Resistance to Shearing by Back Shell Material ... 64
Figure 4.17 Glove Bulk (cm3) vs. Tool Test Dexterity Rating (all gloves) ... 65
Figure 4.18 Partition Model of Dexterity as Measured by the Tool Test (19 NFPA 1971 Compliant Gloves) ... 67
Figure 4.19 Effect of Thumb Circumference and Construction on Tool Test Dexterity... 69
x
Figure 7.1 Horizontal Rope Pull (Fixed Stance) ... 88
Figure 7.2 Vertical Pole Pull ... 90
Figure 7.3 Torque Test (Pole Twist) ... 91
Figure 8.1 Grip Performance in Wet Horizontal Rope Test (Fixed Stance) ... 93
Figure 8.2 Measurement Ranges of Grip Tests ... 95
Figure 8.3 Subject-to-Subject Variability in Wet Torque Test... 97
Figure 8.4 Subject-to-Subject Variability in Dry Torque Test ... 98
Figure 8.5 Subject-to-Subject Variability in Dry Vertical Pole Test... 99
Figure 8.6 Subject-to-Subject Variability in Wet Horizontal Rope Test, Fixed Stance ... 100
Figure 8.7 Subject-to-Subject Variability in Wet Vertical Pole Test ... 101
Figure 8.8 Subject-to-Subject Variability in Wet Vertical Rope Test ... 102
Figure 8.9 Wet and Dry Torque Test Correlation by Grip Performance Rating ... 105
Figure 8.10 Grip Performance of NFPA 1971 Compliant and Non-Compliant Gloves ... 106
Figure 8.11 Shell Material Effect on Wet and Dry Torque Tests ... 107
Figure 8.12 Grip Output-Wet Torque Test (Subject 1, Glove I) ... 108
Figure 8.13 Grip Output-Wet Torque Test (Subject 1, Glove W) ... 109
Figure 8.14 Factors Affecting Grip Performance of NFPA 1971 Compliant Gloves in Wet Torque Test (Partition Model) ... 111
Figure 8.15 Actual Wet Torque Test Grip Ratings by Grip Ratings Predicted by Partition Model ... 112
Figure 8.16 Effect of Palm Shell Thickness on Palm Composite Weight ... 114
Figure 8.17 Model Prediction of Grip Performance by Palm Shell Thickness ... 115
Figure 8.18 Effect of Palm Shell Material on Palm Shell Thickness ... 116
Figure 8.19 Effect of Palm Shell Material on Palm Composite Thickness ... 117
Figure 8.20 Grip Performance Model with Categorical Variables ... 119
Figure A.10.1 NFPA 1971 Hand Measurement Procedure ... 130
Figure B.1 Residual by Predicted Plot: Model 1 ... 36
Figure B.2 Bulk Leverage Plot: Model 1 ... 36
Figure B.3 TL to MB Connection{Adhesive&None&Tabs sewn at side-Sewn to MB&Double sided tape} Leverage Plot: Model 1 ... 37
Figure B.4 Residual by Predicted Plot: Model 2A ... 38
Figure B.5 Whole Glove Stiffness Leverage Plot: Model 2A ... 39
Figure B.6 Palm Composite Thickness Leverage Plot: Model 2A ... 39
Figure B.7 Thumb Circumference Leverage Plot: Model 2A ... 40
Figure B.8 Regression Plot: Model 2B ... 41
Figure B.9 Residual by Predicted Plot: Model 2B ... 42
Figure B.10 Thumb Type{Wing-Seam&Wing-Straight} Leverage Plot: Model 2B ... 42
Figure B.11 Residual by Predicted Plot: Model 3 ... 44
Figure B.12 Regression Plot: Model 4 ... 45
Figure B.13 Residual by Predictd Plot: Model 4 ... 46
Figure B.14 Regression Plot: Model 5 ... 47
Figure B.15 Tree Diagram for Partition Model: Tool Test Dexterity ... 49
Figure B.16 Residual by Predicted Plot: Model 6 ... 51
Figure B.17 Thumb Circumference Leverage Plot: Model 6 ... 51
Figure B.18 Back Shell General{Kangaroo&Elk-Cow} Leverage Plot: Model 6 ... 52
Figure B.19 Moisture Barrier Leverage Plot: Model 6 ... 52
Figure B.20 Palm Shell Thickness by Construction (M and U Exclusion) ... 53
Figure B.22 Actual by Predicted Plot: Model 7 ... 55
Figure B.23 Residual by Predicted Plot: Model 7 ... 56
Figure B.24 Palm Shell Thickness Leverage Plot: Model 7 ... 57
Figure B.25 Residual by Predicted Plot: Model 8 ... 58
Figure B.26 Palm Shell General{Elk&Pigskin&Cow-Kangaroo&Digiroo&Goat} Leverage Plot: Model 8 ... 59
Figure B.27 Palm Shell General{Elk-Pigskin&Cow}Leverage Plot: Model 8 ... 59
Figure B.28 Palm Shell General{Kangaroo&Digiroo-Goat} Leverage Plot: Model 8 ... 60
1
Chapter 1.
Introduction
Thermally protective gloves having better dexterity and grip performance is a primary need
for structural firefighters. The importance of thermally protective gloves for reducing hand
burns is obvious, but often, the need for hazard protection leads to a reduction in hand
function. As indicated by available data on firefighter burn injuries, the most common
injuries received by firefighters occurred in the arm or hand: 8,115 injuries or 20% of total
injuries incurred [1]. Of burn injuries, 29% were localized to the arm or hand region, second
only to burns incurred on the head area [1]. The actual number may be higher because mild
or first degree burns often go unreported [2]. Many hand burn injuries occur outside of the
flame envelope, in which case hands may be extended toward the fire where they experience
a high heat exposure. Firefighters may touch hot objects and compress gloves to their skin.
They may also receive steam burns to the hands caused by spraying fire and hot objects with
water [3].
1.1
Need for Research
In a survey conducted by the NFPA 1971 Technical Committee Task Group on
Gloves, the most common attribute firefighters indicated that they disliked about their
structural gloves was dexterity performance [4]. Glove bulkiness was identified as the next
biggest problem by firefighters, and grip performance was among the top four complaints, as
Figure 1.1 Structural Glove Attributes Disliked by Firefighters [4]
Firefighters typically respond to glove performance inadequacies by wearing NFPA
1971 non-compliant gloves, carrying multiple sets of gloves for different tasks or by
removing their structural gloves completely. Of the 349 firefighters surveyed, illustrated in
Figure 1.2, 72.8% admitted to removing their gloves to change communication radio
channels. Forty-two percent removed their gloves to attach hydraulic rescue couplings, and
39.5% when starting two-cycle chain saws. Almost one fourth of firefighters removed their
gloves when attaching and detaching buddy breathers under pressure and 20.9% when
0 10 20 30 40 50 60 70 80
#
o
f
re
sp
o
n
se
s
3
Figure 1.2 Percentage of Firefighters Removing Gloves to Perform Tasks [4]
The understandable emphasis placed on thermal and physical hazard protection
performance frequently leads to reduced hand functionality. It is often assumed that bulky
glove constructions provide better protection [5]. Bulky glove designs may actually increase
hazard by decreasing sensory feedback, range of motion and hand functions related to
dexterity and grip.
1.2
Dexterity Study Objectives
This research studied two aspects of structural firefighting glove functionality: dexterity and
grip performance. It focused on two aspects of glove dexterity performance: gross dexterity
and fine dexterity. Gross dexterity refers to the impact of the glove on the ability to
manipulate relatively larger objects with the whole hand. Fine dexterity relates to the impact
24.6%
41.5% 39.5%
72.8% 20.9% 2.0% 16.0% 0.0% 10.0% 20.0% 30.0% 40.0% 50.0% 60.0% 70.0% 80.0% Buddy Breathers under pressure: Hydraulic rescue couplings: Starting two-cycle chain saws: Changing radio stations: Universal RIC fitting (UAC):
Other: No Reply:
P er ce nta g e o f F iref ig hte rs
of the glove on the ability to manipulate small objects with the tips of the fingers. The
objectives of the dexterity phase of the study were to:
Compare different glove dexterity test methods for assessing the dexterity
performance of a selected group of structural firefighting gloves.
Demonstrate improved, more job-relevant test methods for characterizing
structural firefighting glove dexterity functionality.
Develop new dexterity test methods that can be used to differentiate between
structural firefighting gloves based on their dexterity performance.
These dexterity test methods were used to study the effect of glove materials, constructions
and designs on dexterity performance in order to:
Develop statistical models that predict a glove’s dexterity performance from
glove material and design properties.
Recommend structural firefighting glove designs for improved dexterity
5
Chapter 2.
Dexterity of Structural Firefighting
Gloves
2.1
Dexterity Test Methods
Many tests have been used to characterize the dexterity performance of different types of
gloves. Pegboard-type tests are common. The Minnesota Rate of Manipulation
Test-Turning involves picking up twenty wooden cylinders from a board, transferring them to the
other hand by turning them over and then placing them back into the board [5; 6]. A similar
test, the block manipulation test, involves turning over six wooden cubes of varying sizes as
quickly as possible [5]. Additional pin-related tests include the Purdue Pegboard Test and the O’Connor Finger Dexterity Test which involves picking up three small pins at once and
placing them into a hole [6]. To test the dexterity performance of thin gloves, the Crawford
Small Parts Dexterity Test has been used which involves the use of tweezers, small screws
and screwdriver [7]. Task or assembly tests have also been implemented to characterize
glove dexterity performance. The Bennett Hand Tool Dexterity Test involves a specific set
of tools for assembling each set of three different sized bolt/ nut/washer combinations onto a
vertical wooden board. Wrenches are used for the two larger sets of bolts, while the smallest
bolt requires a screwdriver [6; 8]. Bensel also introduced a Rifle Assembly Test to
characterize glove performance in her dexterity study [6]. Other timed task tests use a rope
knotting task in which the subject wraps a rope around a one-inch thick dowel and secures it
with two free-hand knots [5]. Time-independent tasks have also been employed to test
measure of dexterity and tactility performance. The EN 420 standard includes five levels of
pin diameter and the indication of whether or not they can be picked up [9]. Even a keyboard
test including the number of errors reported has been used as a measure of dexterity.
However, many of these tests are designed for very thin gloves or not for gloves at all, but as
a human dexterity evaluation tool or as a gauge in physical therapy recovery. No matter the
test employed, it has been widely accepted that the used of gloves reduces dexterity
performance when compared to the bare hand [5; 8; 9; 10].
Many researchers have found that the measure of gloved dexterity performance
depends highly on the type of task or test used to measure it. Plummer found a significant
difference in performance time based on the size of bolt manipulated, during the Bennett
Hand Tool Dexterity Test [8]. Bradley evaluated eighteen different commercially available
gloves and found that the performance of each glove varied widely between five cockpit
control operations [10]. Not only did glove performance vary between operations, but
certain gloves that performed well in one task performed poorly in another. Bradley
attributes these performance trends to the effect of five measured properties of each glove
which suggests that dexterity evaluation test methods should be end-use specific [10].
Dodgen et al. compared subjective rankings to objective rankings provided by each of four
test methods [9]. They suggest that the most valid test ordered the gloves by performance in
7
2.2
NFPA 1971 Test Requirements for Glove Dexterity Performance
The NFPA 1971 Standard on Protective Ensembles for Structural Fire Fighting and
Proximity Fire Fighting is a consensus standard developed by a balanced committee of
firefighters, manufacturers and technical experts [4]. The purpose of these standards is to
establish minimum levels of protection for firefighter protective ensembles. Hazards
addressed include thermal, physical, environmental, and bloodborne pathogens. These
standards also establish design and material performance requirements to minimize the effect
of these threats [11].
NFPA 1971 prescribes eighteen different test methods for structural firefighting
gloves, including twenty-five performance requirements for components. In addition to tests
for dexterity, included are five thermal tests, three barrier tests, three mechanical properties
tests, a glove donning test, a liner retention test, label durability and legibility test, corrosion
resistance, and a grip test.
The first structural firefighting glove dexterity requirement incorporated in the NFPA
1971 standard was the Bennett Hand-Tool Dexterity Test [12]. This test involves
disassembling twelve nut/bolt/washer combinations (four of each of three sizes) by hand from one side of a “U”-shaped frame, and reassembling them on the other side using multiple
sizes of wrenches and a screwdriver as seen in Figure 2.1. Originally designed as a tool
proficiency aptitude test, the Bennett Test measures bare-handed gross motor skills. The
NFPA 1971 standard applied this test to evaluate the dexterity performance of structural firefighting gloves by comparing a subject’s bare-handed test time to gloved test time as
Figure 2.1 Bennett Hand-Tool Dexterity Test [13]
The test was not well received as a structural firefighting glove evaluation tool
because it required a long test time. It was also considered to provide poor simulation of the
tasks actually performed by firefighters.
The modified pegboard test replaced the Bennett Hand-Tool Dexterity Test in the
2000 version of the NFPA 1971 standard [14]. The modified pegboard test, based on work
conducted by Dodgen et al., is the current dexterity performance standard for structural
firefighting gloves in NFPA 1971: 2007 [9]. This test involves picking up and placing
9
2.2.1 Limitations and Drawbacks of the Current Glove Dexterity Test Method The current NFPA 1971 dexterity test may not be a sufficient tool for dexterity evaluation.
Dodgen et al. intended to promote the modified pegboard test as the new NFPA 1971
dexterity test [9]. The proposed test was compared to a 2-point discriminator test designed
for measuring the tactility of a bare hand, and a dexterity pin test based on the EN 420
standard which involves a binary (yes/no) output of whether or not a gloved hand could pick
up a pin of ten varying diameters[15]. Compared to a tactility test and a test with only ten
levels, the modified pegboard test appears to be a much better test. However, the study failed
to compare the modified pegboard test to the then current hand function test: the Bennett
Hand-Tool Dexterity Test.
In addition, this test was proposed to evaluate the dexterity performance of structural
firefighting gloves but only one NFPA 1971 compliant structural glove was included in the
study. While structural firefighting gloves are traditionally 3-layer gloves, only three of the
seven test gloves were 3-layer gloves. Two gloves had two layers and two were only
single-layer gloves. The study reported the ability of the modified pegboard test to discriminate
between glove dexterity performances, but the test gloves were not comparable to one
another. With such a small glove selection, the study would have been wise to include only
three-layer gloves or only two-layer gloves, designs that are actually representative of
structural firefighting gloves. The ability for a test to discriminate between the dexterity
performance of three-layer gloves and one-layer gloves is almost meaningless, especially
While the study reports the modified pegboard test as a better test than the 2-point
discriminator test and a pin pick-up test, it provides no evidence that the test was able to
discriminate between the three 3-layer gloves or that the measurement system used was
reliable and repeatable. These factors are very important when establishing performance
levels for structural firefighting gloves.
2.3
Characterizing the Effects of Gloves on Dexterity Performance
The effect of glove design and material selection on dexterity performance has been
studied in a range of gloves used for many end-use applications. Plummer’s study on
hazardous waste protective gloves found that the use of gloves increased the average test
completion time by 15 to 37% compared with barehand performance [8]. These researchers
discovered a significant effect of wearing two gloves on one hand; these doubled gloves had
significantly longer test completion times that the single layer gloves. Bensel discovered a
significant effect of glove thickness in her study of chemical protective gloves. Not
surprisingly, as glove thickness increased, dexterity performance decreased as indicated by
an increase in completion time [6]. Bradley’s study did not show much effect of glove outer
material type on dexterity performance [10].
Although many comparative studies have been performed on dexterity tests, little
research has been done on tests that are specifically designed to evaluate the dexterity
11
needed to more definitively pinpoint the effects of glove design and materials on dexterity
Chapter 3.
Dexterity Study Experimental
Procedures
This research used standard and newly developed dexterity performance test methods to
characterize a selected group of structural firefighting gloves. Materials level, whole glove,
and glove design properties were characterized to determine the combined effect on glove
dexterity performance. An objective of this experimental approach was to identify the best
dexterity performance test for structural firefighting gloves, and to study the effects of the
glove materials and designs on the measured dexterity performance.
3.1
Test Gloves
This research studied the performance of twenty-four different glove pairs, purchased from
ten different manufacturers as shown in Table 3.1. The test group included nineteen NFPA
1971 compliant firefighter gloves and five non-compliant gloves. It included an extrication
glove (Glove V), a single-layer leather work glove (Glove Q), a hazmat glove (Glove R), a
2-layer leather law enforcement glove (Glove X) and a rubberized glove designed for lab-work
(Glove W). Non-compliant gloves were included because these types of gloves are
sometimes worn by firefighters. They were included also to examine the measurement range
of the test methods represented in this study. The test group included gloves constructed
13
Table 3.1 Test Gloves
Glove
Composition of Glove
Manu-facturer Shell (Palm) Shell (Back) Moisture Barrier Thermal Liner Additional Layer Com-pliant
A A Cow Cow
PTFE laminated on aramid/para-aramid spunlace
Modacrylic Y
B A Cow Cow Thick
Polyurethane Modacrylic Y
C A Cow Cow
Integrated Moisture Barrier/Thermal Liner N/A Between Moisture Barrier
and Back Shell Y
D A Elk Elk Same as Glove A Modacrylic Y
E A Elk Elk Same as Glove B Modacrylic Y
F A Elk Elk Same as Glove C N/A
Between Moisture Barrier
and Back Shell Y
G B Cow Cow Same as Glove A 7 oz. Cotton and
SEF Y
H C Cow Cow Same as Glove A SEF Modacrylic Y
I C Cow Cow Same as Glove B SEF Modacrylic Y
J B Pigskin Cow Barrier Laminated to Thermal Liner
8 oz. SEF
Modacrylic Fleece Y
K D Cow Cow Same as Glove C N/A
Between Moisture Barrier
and Back Shell Y
L C Elk Elk Same as Glove A SEF Modacrylic Y
M C Elk Elk Same as Glove B SEF Modacrylic Y
N C Digiroo Kangaroo Same as Glove A Air Spacer
Para-aramid/Aramid Y
O B Cow Simplex 100%
Kevlar Same as Glove C N/A
Between Moisture Barrier
and Back Shell Y
P C Cow Cow Same as Glove B SEF Modacrylic Y
Q B Pigskin Pigskin None None N
R E Kevlar Kevlar Impermeable
Barrier N
S F Goat Cow Breathable Thin
Polyurethane Synthetic Knit Y T F Kangaroo Kangaroo Same as Glove S Synthetic Knit Y
U G Cow Cow Same as Glove A aramid/Aramid Para- Y
V H
Synthetic Leather-like Material and Aramide Fabric Synthetic Leather-like Material and Aramide Fabric
None N/A N
W I Rubberized
Synthetic Knit Synthetic Knit None N/A N
X J Cow Cow None
3.2
Glove Dexterity Tests
3.2.1 Human Subject Evaluators
Five human subjects participated in evaluating glove dexterity performance. A right
hand-dominant group was used that included four college-age males and one female. Subjects were
selected so that the right hand fit a large size glove. Since fit is an important factor in glove
function, subjects were selected so that no more than two of the twelve hand measurements
were outside of the sizing recommendations for large size gloves, as specified in NFPA 1971
[16]. Detailed hand measurements, and a more detailed description of the hand measurement
procedure can be found in Appendix A.
Four different test methods were used to characterize the dexterity performance of the
test gloves. A more detailed description of the testing procedures is provided in Appendix A.
3.2.2 Modified Pegboard Test: Knurled Pins
The test glove pairs were tested for hand function following NFPA 1971 Section 8.38,
ASTM F 2010: Standard Test Method for Evaluation of Glove Effects on Wearer Hand
Dexterity Using a Modified Pegboard Test. This method measures the time that it takes for a
subject to place twenty-five pegs in a pegboard both with and without gloves.
Before each test, the pins were spread out to the right of the pegboard as shown in
Figure 3.1 (for right-handed subjects). Each test subject used their bare right hand to pick up
15
the test subject wearing gloves until the coefficient of variation of the last three repetitions
was less than 8%. The average of the last three dexterity times was used as the dexterity time
with gloves (DDTg).
The dexterity rating for each glove was determined by comparing the glove dexterity
time to the bare-handed baseline time for each subject, as:
where:
DTTg = average of the last three repetitions wearing gloves where the Coefficient of
Variation did not exceed 8% (sec) and,
DTTb = average of the last three repetitions without gloves where the Coefficient of
Variation did not exceed 8% (sec).
An average dexterity rating for each of the twenty-four glove pairs was calculated by
averaging the percent of barehand control values for each of the five test subjects.
The coefficient of variation was calculated as:
where:
stdevlast3 = the standard deviation of the last three repetitions and,
avglast3 = the average of the last three repetitions.
3.2.3 Modified Pegboard Test: Smooth Pins
The same pegboard test was conducted following ASTM F 2010, except smooth pins were
used instead of knurled pins.
3.2.4 Incremental Lift Test
Fine dexterity was measured using a new lift test procedure developed by the Center for
Textile Protection and Comfort at North Carolina State University. The method measures the
minimum height that a cylinder must be raised above a plane before a subject can
successfully lift the cylinder out of the opening in the elevated plane shown in Figure 3.2.
An elevated plane was constructed so that the cylinder supported by an incremental
lift system (lab jack) could easily fit underneath. A circular hole was cut into the plane so
that as the jack was raised, the cylinder would raise up through the plane. A rod was attached
vertically to the lift and emerged through a hole on the top side of the plane. This rod was
17
The dexterity rating for each glove was determined by comparing the glove dexterity
height to the bare-handed baseline height for each subject, calculated as:
where:
DLHg = minimum of 5 lift heights while wearing gloves (mm), and
DLHb = minimum of 5 lift heights without wearing gloves (mm).
An average dexterity rating for each of the twenty-four glove pairs was calculated by
averaging the percent of barehand control values for each of five test subjects.
3.2.5 Tool Test
The tool test, shown in Figure 3.3, measures the time required for a test subject to assemble
and tighten a group of bolts, nuts and washers onto a vertical test board [17].
Figure 3.3 Tool Dexterity Test
In this test, the human test subject begins by picking up the first of four bolt/washer
assemblies with the left hand and inserting the bolt/washer into the end hole on the top row
of the vertical test board assembly. The test facilitator hands a washer to the subject’s right
hand which the subject places over the end of the bolt. The subject picks up a nut, and while
holding the bolt with the left hand, screws the nut onto the end of the bolt with his/her right
19
next bolt/washer assembly. This process was continued across the top row of holes, in order,
and then to the bottom hole.
Dexterity test time was measured, in seconds, as the time from when the test subject
touched the first bolt/washer assembly until the torque wrench clicked on the bottom bolt.
The dexterity rating for each glove was determined by comparing the glove dexterity test
time to the bare-handed baseline time for each subject as:
where:
DTTg = average of the last three repetitions wearing gloves where the Coefficient of
Variation did not exceed 8% (sec), and
DTTb = average of the last three repetitions without gloves where the Coefficient of
Variation did not exceed 8% (sec).
The procedure was repeated until the coefficient of variation of the last three repetitions for
each is less than 8 percent.
The coefficient of variation was calculated as:
where:
stdevlast3 = the standard deviation of the last three repetitions, and
An average dexterity rating for each of the twenty-four glove pairs was calculated by
averaging the percent of barehand control values for each of the five test subjects. Additional
details concerning this method can be found in Appendix A.
3.3
Characterization of Glove Material Properties
The dexterity performance of structural firefighting gloves depends on the combined effect of
material and whole glove design variables. Glove material properties were characterized as
follows:
3.3.1 Composite Weight
The weight of the glove composite layers (outer shell, moisture barrier, thermal liner and
additional layers) was measured using a Mettler PM1200 precision balance. Swatch sized
samples (4 in by 4 in) were die-cut directly from the palm and back sides of test gloves.
Whenever the palm and back composite lay-ups were the same, measurements from a sample
taken from the back of the glove were made. Composite weight was calculated in ounces per
square yard from six replicate measurements.
The weight of each separable layer of the glove composite was measured from 4 in by
4 in samples, die-cut from the palm and back sides of test gloves. Whenever the palm and
back composite lay-ups were the same, measurements from a sample taken from the back of
21 3.3.2 Composite Thickness
Thickness of both back and palm composite lay-ups were measured to the nearest hundredth
millimeter following ASTM D 1777. An AMES comparator model 99-0697 was used to
measure the thickness of 4 in by 4 in samples die-cut from the palm and back sides of the
gloves, at a pressure application of 0.6 PSI. An average of six measurements from different
samples was recorded as the composite thickness. Whenever the palm and back composite
lay-ups were the same, measurements from a sample taken from the back of the glove were
made. The thickness of individual material layers in the composite lay-ups was also
measured.
3.3.3 Composite Density
The density of the layered glove composites, from both the palm and back sides of the glove,
was calculated from measured composite weight and thickness, as follows:
(
)
(
)
where:
Composite weight is measured as the weight in grams of a 4 inch square sample,
0.403225 is the conversion factor to change the units of composite weight to g/cm2, and
Composite thickness is the average of three thickness measurements in cm.
3.3.4 Coefficient of Friction
The coefficient of friction of the glove outer shell material was assessed by measureing the
two directions for the palm surface of each glove specimen. A 950 gram sled was placed on
top of a four by four inch shell sample at a predetermined position on the plane. The incline
angle when the sled and shell began to slip was recorded by a digital inclinometer. The
tangent of the average of these three measurements was noted at the static coefficient of
friction of the material against a fiberglass surface.
23
Standard Test Method for Stiffness of Fabric by the Circular Bend Procedure [18]. Die-cut 4
in by 4 in samples were tested (without folding because of thickness) by a Circular Bending
Apparatus with a pneumatic actuator for the max force required to plunge the sample through
a 1.50-in diameter orifice. Sample face direction was varied between back and palm
composites to simulate actual bending direction of composite when in glove form.
3.3.6 Compressive Resilience
Compression resilience (RC, %) was measured with the KES-FB3 Compression Tester at
50gf/ cm2 at a rate of 1 mm/sec for a 2 cm2 area of three repetitions of 4 in by 4 in die-cut
samples of palm and
back composites of gloves. A higher percentage indicates a higher extent of recovery from
compressed thickness to initial thickness [19].
3.3.7 Bending
Bending rigidity (B, gf.cm2/cm) of three repetitions of 4 in by 4 in die-cut sample of palm
and back shell materials was measured with the KES-FB2 Bending Tester by bending the
sample approximately 150° in a continuously changing arc of constant curvature. Higher
values of B indicate a higher resistance to bending or greater stiffness [19].
3.3.8 Roughness
Surface roughness (SMD, microns) of three repetitions of 4 in by 4 in die-cut samples of
palm shell materials was measured with the KES-FB4 Surface Tester with an applied tension
load of 20 gf/cm. A higher SMD value (average of both forward and backward directions)
3.3.9 Shear
Shearing stiffness of three repetitions of 4 in by 4 in die-cut samples of palm shell materials
was measured by the KES-FB1 Tensile-Shear Tester by application of opposing parallel
forces until an offset angle of 8° was reached. The shear stiffness (G,gf/cm.degree) was
collected between 0.5 and 2.5 degrees and offset angle. Lower values indicate a softer, more
pliable material [19].
3.4
Characterization of Whole Glove Properties
To determine material effects on whole glove properties and whole glove property effects on
dexterity performance, whole glove properties were measured as follows:
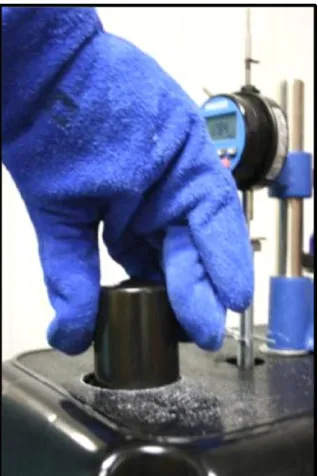
3.4.1 Glove Volume: Whole Glove Bulk
Glove volume (material and airspace), or bulk, was measured by a water displacement
method, as shown in Figure 3.5. The measurement used an open-ended 6-inch inside
diameter PVC cylinder.
Clear tubing with a negligible diameter jutted out from the side with an elbow connector and
followed the height of the cylinder to be used as a more precise displacement measurement
scale. Each test glove was placed on a large hand form and submerged, with the fingers
facing downward, to the wrist crease, into the cylinder filled with water to a predetermined
25 where:
Height is the difference in height of vertical water displacement between hand form and hand
form/glove ensemble for each glove. Three repetitions of this characterization test were
performed.
Figure 3.5 Whole Glove Bulk Measurement
3.4.2 Finger Circumference
The circumference of the index finger of the gloves was measured as shown in Figure 3.6.
Figure 3.6 Measurement of Index Finger Circumference
Thumb circumference was measured ¾ inches from the tip of the thumb.
3.4.3 Glove Stiffness
Glove stiffness/flexibility was measured by the pressure required to close pneumatic hand
form to a predetermined point as indicated in Figure 3.7. Calculated from 5 repetitions, the
27
Figure 3.7 Pneumatic Hand Form Figure 3.8 Pressure Gauge for Pneumatic Hand Form
3.5
Glove Design and Construction Features
Structural firefighting gloves typically employ a three-layer composite construction
consisting of a thermal liner (the layer closest to the hand), a moisture barrier and an outer
shell material [11].
3.5.1 Outer Shell Materials
The outer shell of the glove is designed to protect the wearer and the inner layers of the glove
from thermal and mechanical hazards. Shell materials must have high puncture, abrasion and
cut resistance. Leather is often used because it can withstand repeated flexing without failure
[20]. Many different types of leather are used in structural firefighting gloves. The type of
leather used depends on the layer from which it is split, the animal from which it comes, and
mechanical properties. Leathers commonly used in structural firefighting gloves include
cow, elk, goat, sheep, kangaroo and pig leathers.
Leather consists of a semi-aligned tanned network of long collagen fibrils [20]. The
angle of weave of these fibrils differs widely between leather types, and plays a major role in
the extension, tensile, abrasion resistance and puncture resistance properties. Leathers with a
high angle of weave (where fibrils are more perpendicular to the surface), exhibit more
extension properties while they tend to have lower tensile strength and abrasion resistance
than other leathers of the same thickness. Leathers with a low angle of weave (where fibrils
lie more parallel with the skin surface), particularly kangaroo leathers, can be split more
thinly and retain the tensile strength of much thicker cow leathers [21]. Leathers employed
in glove shells can be brushed or sueded for a different surface effect. Layered synthetic
materials may be used as shell materials on the back side of the glove. Most often, glove
composites are homogeneous from back to palm. However, it is becoming increasingly
common to employ different composite lay-ups in the palm and the back side of the glove.
This allows glove designers to combine protection and function where they are needed.
3.5.2 Moisture Barrier Materials
The second layer in a structural firefighting glove is designed to protect the wearer from
bloodborne pathogens and other liquid-based hazards. Because they are designed to be
29 3.5.3 Thermal Liner Materials
The thermal liner is designed to feel comfortable next to the skin, and to add thermal
insulation. It often traps air in a lofted fleece for added insulation. Modacrylic, aramid and
para-aramid blends are commonly used in thermal liner constructions.
3.5.4 Layered Constructions
Structural firefighting gloves are typically composed of three-layer composite lay-ups, but
there are exceptions. Some manufacturers provide a glove insert material, designed to act as
an integrated moisture barrier/thermal liner layer, reducing the palm composite number of
layers to two layers in an effort to improve dexterity performance. When this type of insert is
used in the glove composite, additional layers of materials are added to the back of the hand to increase the glove’s thermal protective performance in this area. Reinforcement materials
may be added to the palm or across the back of the knuckles to add protection and to extend
the service life of the glove.
3.5.5 Glove Constructions and Designs
Two glove construction types are most commonly used in the structural glove: the 2-D glove,
or Gunn cut, and the 3-D glove, or Fourchette design. Gunn construction is characterized by
the second and third fingers set into the palm section by a seam across the bottom of each of
the fingers. The back of the glove is made from a single piece. The seams in each finger
extend two-thirds of the way toward the back of the hand to reduce wear and seam task
interference [9]. A more expensive alternative is the 3-D glove design, which features
between-finger fourchettes designed to provide an ergonomic or natural fit that contours to
Figure 3.9 Structural Firefighting Glove Constructions
3.5.6 Thumb Designs
Figure 3.10 illustrates three common thumb construction designs used in structural
firefighting gloves. The straight thumb and wing thumb designs feature relaxed
configurations. The straight thumb opens toward the tips of the fingers, and is sewn into the
palm as a separate piece. The wing thumb opens away from the palm to the side of the hand,
and is one piece with the palm shell. The keystone thumb uses a more natural thumb position
than either the straight or the wing thumbs. This design features a separate 3-D structure
pieced into the glove in a natural relaxed thumb state.
31
Figure 3.10 Glove Thumb Designs
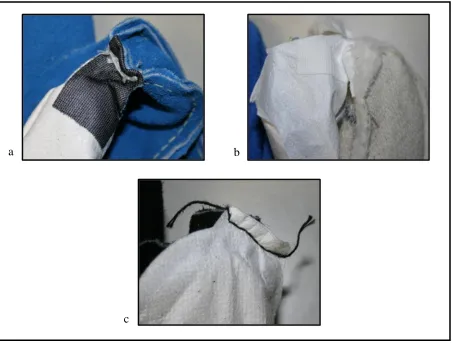
3.5.7 Insert Connections
The liner retention test in NFPA 1971 requires that the layers from which the glove is
constructed must not separate or pull out during use [11]. Insert connections are used to
provide this functionality. Figure 3.11 shows the types of connections used between
moisture barriers and the outer shell layer. When moisture barriers are sewn to the shell the
moisture barrier beyond the seal must not be punctured. Tabs are often connected with
adhesive to the moisture barrier which is used as the sewing substrate.
Figure 3.12 shows the thermal liner to moisture barrier connection, when there is a third
layer. Sometimes the layers are spot glued together. Moisture barriers and the thermal liners
are often attached using an adhesive impregnated nonwoven tape.
a b
c
33
d e
Chapter 4.
Dexterity Study Results and Discussion
Four dexterity tests were performed in an effort to evaluate the dexterity performance of
structural firefighting gloves. The test methods were compared, and used to analyze the
effects of glove materials and constructions on dexterity.
4.1
Dexterity Performance Assessed Using the NFPA 1971 Pegboard
Method
To pass the knurled pins pegboard dexterity performance requirement, NFPA 1971 compliant
gloves should have an average percent barehand control not exceeding 250 percent [16].
Figure 4.1 shows that the entire group of NFPA 1971 compliant and non-compliant gloves
pass this requirement. These results show that, based on firefighter complaints about glove
dexterity, the method currently called for by the NFPA standard, does not provide sufficient
differentiation of glove performance. These findings clearly indicate the need for a better
35
Figure 4.1 Glove Dexterity Measured using Modified Pegboard Test with Knurled Pins (Avg. of 5 test subjects)12
4.2
Comparing Dexterity Test Methods Based on Variability and Ability
to Differentiate Glove Performance
For a test method to be reliable, it must provide low subject-to-subject variability, high
discriminating power and, ideally, capture a wide range of dexterity performance. When a
test method shows a greater range, it is easier to discriminate between gloves based on their
dexterity performance. Discerning if gloves perform differently is important, not only for
establishing minimum performance requirements, but also for developing better performing
glove designs. If differences in glove performance can be quantified, then differences can be
related to materials and design factors. The best way to achieve this goal is to design test
1 Gloves with dexterity ratings that fall below the performance limit line pass the NFPA 1971: 2007 standard
2 Error bars represent the standard deviation of dexterity ratings for five subjects.
0 50 100 150 200 250 300
A B C D E F G H I J K L M N O P Q R S T U V W X
% B a re Dex terit y Ra tin g ( M o d ified Peg b o a rd T est, K nu rled P ins ) Glove Sample B ett er De xter it y P er for m anc e
Compliant Non-compliant
methods that provide low subject-to-subject variability while collecting some measurement
of dexterity.
4.2.1 Evaluation of Test Measurement Range
Figure 4.2 compares the measurement ranges of the different dexterity tests. To compare the
measurement ranges of each of the dexterity tests, the minimum dexterity rating was
subtracted from the maximum rating in each test to obtain the range. When considering only
the NFPA 1971 compliant gloves, the modified pegboard test with smooth pins captures the
largest range of 290. The current test, the pegboard with knurled pins and the incremented
lift test capture comparable ranges and the tool test captures the smallest range at 54. A test
method capable of evaluating a large range of measurements helps a test method discriminate
between gloves because the values are spread over a larger range. When considering only
37
Figure 4.2 Measurement Range of Dexterity Tests for NFPA 1971 Compliant Gloves3
However, when considering both the NFPA 1971 compliant gloves and the
non-compliant gloves, all the tests capture a much larger dexterity performance range, the smooth
pin test still capturing the largest, as 290. The tool test and the knurled pin test capture
comparable ranges, but it is important to note that the incremented lift test is shown to
capture a much better range when the non-compliant gloves are included. This indicates the
ability of the incremented lift test to differentiate dexterous gloves, a quality that will become
increasingly important as more dexterous gloves become available to firefighters.
4.2.2 Evaluating the Discriminating Power of Dexterity Test Methods
Since the ranges represented in Figure 4.2 are based on average dexterity ratings, it is
important to determine how closely ratings agree between different test subjects. Providing a
3 Error bars represent the average standard deviation of the range measurements for each of five subjects.
0 50 100 150 200 250 300 350 400
Smooth Pin Lift Knurled Pin Tool Test
T
est
M
ea
surem
ent
Ra
ng
e
(M
a
x
-M
in)
Dexterity Test Method
large measurement range is only one factor in good glove differentiation based on dexterity
performance. In addition, tests should be reproducible so that the subject-to-subject
variability among dexterity ratings is low.
Table 4.1 provides a summary of the test variability within each dexterity method.
The standard deviations represented in this table are based on an average of the dexterity
rating standard deviations of all gloves in the group. These data show that the tool and lift
tests are less variable than the pegboard tests. T-tests were performed on the group of NFPA
1971 compliant gloves and also on the entire group of gloves. In both cases, the tool test was
able to differentiate between glove dexterity much better than the other dexterity tests. The
lift test was also able to differentiate between gloves better than the two pegboard tests.
Table 4.1 Dexterity Test Method Variability
Dexterity Tests Compliant Gloves Levels of
Discrimination All Gloves
Levels of Discrimination
Avg. SD Avg.
%CV
t-tests at 95%
confidence level Avg. SD
Avg. %CV
t-tests at 95% confidence level
Tool 17.88 14.16 4 17.62 14.13 9
Lift 27.12 13.43 2 25.26 13.30 7
Knurled Pins 30.24 17.97 2 26.75 16.19 6
39
Lev
el
6 F F F F
5 E E E E E E
4 D D D D D D D D
3 C C C C C C C C C C C C C C C C C C
2 B B B B B B B B B B B B B B B B B B
1 A A A A A A A A A A A A A A A A A A
Av g . 1 8 8 .9 1 8 2 .9 1 7 8 .9 1 7 7 .6 1 7 7 .2 1 7 6 .9 1 7 4 .6 1 7 4 .8 1 7 0 .7 1 6 6 .9 1 6 6 .3 1 6 6 .3 1 6 4 .2 1 6 0 .2 1 5 9 .3 1 5 7 .8 1 5 7 .6 1 5 3 .4 1 5 0 .4 1 4 4 .4 1 2 3 .7 1 1 8 .1 1 1 7 .6 1 0 7 .4
Figure 4.3 Subject-to-Subject Variability within Pegboard Test with Knurled Pins4
The student’s t-test was used to identify the dexterity test method with the least
variability and as a result, the most discriminating power. Data presented in Figure 4.3
through Figure 4.6 show that the incremental lift test and the tool test produce lower
subject-to-subject variability than the pegboard tests. A connecting letters report accompanies the
graphical analysis and provides detailed information about which gloves are similar to one
another. A higher number of distinguishable dexterity levels (as indicated by the number of
4 Connecting letters report is provided by collection of student’s t-tests performed at the alpha=0.05 significance
level. Gloves connected by the same letter do not have significantly different dexterity performances.
letters) is the best indication of low variability within a test method, and therefore more
discriminating power.
These analyses show that both pegboard tests provide only six distinguishable
dexterity levels. When measured by the pegboard test with knurled pins, seventeen of the
nineteen compliant gloves are not significantly different from one another. This means that
the pegboard test with knurled pins would show that these seventeen gloves have
indistinguishable dexterity performances; not one being any better or worse than another.
The smooth pin test performs only slightly better, by distinguishing one more glove from the
41
Lev
el
6 F F F F
5 E E E E E
4 D D D D D D D
3 C C C C C C C C C C C C C C C C C C
2 B B B B B B B B B B B B B B B B B
1 A A A A A A A A A A A A A A A A A
Av g . 2 7 7 .9 2 7 1 .9 2 5 8 .5 2 5 8 .2 2 4 8 .4 2 4 5 .6 2 4 2 .3 2 4 1 .5 2 3 3 .9 2 2 9 .0 2 2 7 .1 2 2 1 .6 2 2 1 .5 2 2 0 .2 2 1 9 .4 2 1 0 .2 2 0 8 .4 1 9 7 .9 1 8 9 .9 1 8 8 .8 1 3 6 .2 1 3 2 .6 1 1 6 .7 1 0 2 .7
Figure 4.4 Subject-to-Subject Variability within Pegboard Test with Smooth Pins5
The incremental lift test method, on the other hand, identifies seven statistically
distinguishable dexterity levels, while the tool test method defines nine distinguishable
dexterity levels. This finding indicates both of these test methods have low enough
subject-to-subject variability to distinguish non-compliant gloves from compliant gloves and also
compliant gloves from each other.
5 Connecting letters report is provided by collection of student’s t-tests performed at the alpha=0.05 significance
level. Gloves connected by the same letter do not have significantly different dexterity performances.
Lev
el
7 G G G
6 F F F
5 E E E E E E E E E E E E E E E
4 D D D D D D D D D D D D D D D
3 C C C C C C C C C C C C C C C C
2 B B B B B B B B B B B B B B B B
1 A A A A A A A A A A A A A A
Av g . 2 2 9 .2 2 1 8 .7 2 1 8 .1 2 1 7 .4 2 1 6 .6 2 1 1 .4 2 0 8 .1 2 0 7 .5 1 9 7 .4 1 9 6 .4 1 9 5 .4 1 9 5 .3 1 9 5 .0 1 9 3 .4 1 9 1 .3 1 9 0 .4 1 8 7 .8 1 8 2 .6 1 8 1 .8 1 7 8 .9 1 3 7 .8 1 2 7 .7 1 2 6 .6 9 5 .8
Figure 4.5 Subject-to-Subject Variability within Incremental Lift Test6
T-test analyses indicate that the tool test and the incremental lift test are the least
variable test methods. The fact that the tool and lift tests have smaller measurement ranges
than the smooth pin pegboard test points even more at the low variability of these test
methods. These methods, therefore, have the greatest ability to recognize differences in
43
Lev
el
9 I I I I
8 H H H H H H H H
7 G G G G G G G G G G G G
6 F F F F F F F F F F F F F
5 E E E E E E E E E E E E E E E
4 D D D D D D D D D D D D D D D D
3 C C C C C C C C C C C C C C C C
2 B B B B B B B B B B B B B
1 A A A A A A A A
Av g . 1 5 3 .7 1 4 3 .7 1 4 0 .7 1 4 0 .2 1 3 9 .1 1 3 6 .5 1 3 4 .9 1 3 3 .4 1 2 7 .7 1 2 6 .7 1 2 3 .9 1 2 3 .4 1 2 2 .4 1 1 9 .7 1 1 9 .2 1 1 7 .7 1 1 7 .3 1 1 7 .0 1 1 6 .4 1 1 3 .9 1 0 5 .9 1 0 2 .4 9 5 .0 8 7 .6
Figure 4.6 Subject-to-Subject Variability within Tool Test7
4.2.3 Correlation Between Objective Measures and Subjective Perception of Glove Dexterity Performance
After they completed all four dexterity tests, subjects were asked to rank test gloves from
worst to best, based on their perception of overall dexterity performance. These five sets of
rankings were averaged to obtain a subjective rank for each test glove. These numeric
7 Connecting letters report is provided by collection of student’s t-tests performed at the alpha=0.05 significance
level. Gloves connected by the same letter do not have significantly different dexterity performances.
rankings were compared to the rankings based on glove performance in the dexterity tests.
Correlation analysis was performed to determine the relationships observed between
objective measured and perceived dexterity performance.
The pegboard test with smooth pins was the worst representation of perceived dexterity performance with a Pearson’s correlation coefficient of only 0.39, likely because
the test was so lengthy and difficult to perform for most gloves. The pegboard test with
knurled pins and the tool test provided much better and similar correlations at r = 0.62 and r
= 0.61 respectively. However, the lift test agrees best with subjective perception of glove dexterity performance with a Pearson’s correlation coefficient of 0.73. This is likely because
the lift test is a time-independent test.
Table 4.2 Objective/Subjective Dexterity Correlation Summary Table
Objective Dexterity Measurement Correlation with Subjective Dexterity Perception Pegboard, Smooth
Pins Tool Test
Pegboard Test,
Knurled Pins Lift Test Pearson’s
Correlation Coefficient
0.39 0.61 0.62 0.73
Firefighters currently perceive their structural gloves to have poor dexterity. Identifying a
![Figure 1.1 Structural Glove Attributes Disliked by Firefighters [4]](https://thumb-us.123doks.com/thumbv2/123dok_us/1426789.1175170/14.612.93.538.67.320/figure-structural-glove-attributes-disliked-firefighters.webp)
![Figure 1.2 Percentage of Firefighters Removing Gloves to Perform Tasks [4]](https://thumb-us.123doks.com/thumbv2/123dok_us/1426789.1175170/15.612.89.541.69.313/figure-percentage-firefighters-removing-gloves-perform-tasks.webp)