International Journal of Women’s Health 2017:9 307–313
International Journal of Women’s Health
Dove
press
submit your manuscript | www.dovepress.com 307
O r I g I n a l r e s e a r c H
open access to scientific and medical research
Open access Full Text article
Trends and causes of maternal mortality in
Jimma University specialized Hospital, southwest
ethiopia: a matched case–control study
Tegene legesse1
Misra abdulahi2
anteneh Dirar2
1Department of Public Health,
collage of Health science, Mizan-Tepi University, Mizan Teferi, ethiopia;
2Department of Population and Family
Health, college of Health sciences, Jimma University, Jimma, Oromia regional state, ethiopia
Introduction: Measures of maternal death are fundamental to a country’s health and development status. In developing countries, it remains a daunting and largely unmet public health challenge. There were two studies completed over 10 years ago in Jimma University Specialized Hospital to identify trends, but recently there have been many changes in Ethiopia to reduce maternal death. Therefore, it is important to track the achievements made in Ethiopia in the context of Jimma University Specialized Hospital. No study undertaken in the country has quantified deaths of women from specific causes after controlling confounders.
Objective: To assess trends and causes of maternal death in Jimma University Specialized Hospital, southwest Ethiopia.
Methods: A time-matched case–control study was conducted on 600 (120 cases and 480 controls) females who utilized obstetrics and gynecology services from January 2010 to December 2014. To observe trends in maternal death, maternal mortality ratio was calculated for each year. Stata version 13 was used to analyze causal inference using propensity score matching method.
Results: Maternal mortality ratio was 857/100,000 and had a decreasing trend from it’s highest in 2010 of 1,873/100,000 to it’s lowest of 350/100,000 in 2014. The leading cause of maternal death was hemorrhage (54%) (β=0.477, 95% confidence interval [CI]: 0.307, 0.647), followed by pregnancy-induced hypertension (20%) (β=0.232, 95% CI: 0.046, 0.419), and anemia (12%) (β=0.110, 95% CI: 0.017, 0.204).
Conclusion: There is a decreasing trend of maternal death. Hemorrhage was the major cause of death identified in each year of study.
Keywords: maternal death, maternal mortality, cause of maternal death and trend of maternal death
Introduction
One of the consequences of poverty is poor access to health care services and poor maternal health care services. Access to maternal health care services like prenatal care, obstetric care, and postnatal care are key to improving poor maternal outcomes. Emergency obstetric care services can avert three-quarters of maternal mortality.1,2
A joint report by WHO, UNICEF, World Bank, and others stated, “Maternal Mortality Ratio (MMR) has fallen globally by 45% from 523,000 (380/100,000) in 1990
to 289,000 (210/100,000) in 2013.”3 In 2013, only 1% of maternal deaths occurred in
developed regions, whereas the rest (99%) occurred in developing countries.3–5
Even though maternal death is highly prevalent in developing regions, there was the highest reduction in maternal mortality from 1990 in 2013. Africa reduced maternal death by 47% from 870 to 460 per 100,000. Countries in sub-Saharan Africa (SSA)
correspondence: Tegene legesse Department of Public Health, collage of Health science, Mizan-Tepi University, Mizan Teferi, snnPr region, ethiopia Tel +251 91 612 5736
email tegegnlegesse@mtu.edu.et
Journal name: International Journal of Women’s Health Article Designation: Original Research
Year: 2017 Volume: 9
Running head verso: Legesse et al
Running head recto: Trend and causes of maternal mortality DOI: http://dx.doi.org/10.2147/IJWH.S123455
International Journal of Women's Health downloaded from https://www.dovepress.com/ by 118.70.13.36 on 23-Aug-2020
For personal use only.
Number of times this article has been viewed
This article was published in the following Dove Press journal: International Journal of Women’s Health
Dovepress
legesse et al
reduced maternal mortality by 49%, from 990 to 510 per 100,000. But still, nearly two-thirds (62%) of maternal deaths occurred in the SSA region. East African countries reduced
MMR by 57%, from 1,000 to 440 per 100,000.3–5
In Ethiopia, MMR decreased by 69% from 1,400 to 420 per 100,000 between 1990 and 2013. However, a study of public hospitals of Tigray regional state in Ethiopia showed an increase in MMR between July 1, 2010 and June 30, 2012. Furthermore, the 2011 Ethiopian demo-graphic and health survey (EDHS) (676/100,000) showed that there is an increase of MMR from 2005 EDHS (673/100,000).5,7–10
However, the 2005 EDHS report (673/100,000) and joint estimation by WHO, UNICEF, UNFPA, and The World bank in same year (740/100,000) showed great variation.5,7–10 A retrospective cohort study10 conducted in Ambo Hospital from 2001 to 2005 revealed that the trend of MMR in the 5-year period had a fluctuating pattern, between 671 and 3,986/100,000. Similarly, the review in Jimma hospital 15 years ago shows fluctuation in the range of 1,635–2,331/100,000.10–13
Around three-quarters of maternal mortality in devel-oping regions is attributable to direct obstetric causes like hemorrhage, infection, unsafe abortion, hypertensive dis-orders of pregnancy, and obstructed labor. Contribution of indirect causes varies from region to region. It is 4% in Latin America, 13% in Asia, and 17% in Africa.3 In Ethiopia, abor-tion was the major cause of maternal mortality in the 1980s; however, in 2000, sepsis became the major cause.7 Currently pregnancy-induced hypertension is an increasing cause of
maternal death as observed in Tigray region.8
Even though Ethiopia had reduced maternal deaths as shown earlier, the number of deaths is still high according to WHO maternal death classification. Some hospital-based studies in the country show inconsistency in death trends. Therefore, the need for further study is unquestionable to identify trends, timing, and causes of maternal death. Besides the inconsistency of findings in existing literature, there is limited literature regarding Ethiopia particularly regarding cause and timing of maternal death.
Hence, this study aims to objectively assess the trends and causes of maternal mortality in Jimma University Specialized Hospital (JUSH), southwest Ethiopia.
Patients and methods
study design
Time-matched, institution-based case–control study is used to determine cause, and a retrospective review of data were conducted for trends.
study setting
The study was conducted at JUSH, which is located in Jimma town, 355 km from Addis Ababa in the southwest, Jimma zone, Oromia regional state, Ethiopia. JUSH is one of the oldest public hospitals in the southwest part of the country and comes under Jimma University. It is currently the only teaching and specialized hospital in the southwest of Ethiopia. The hospital serves as a referral site and pro-vides specialized care for southwest Ethiopia with a catch-ment population of about 15 million. The specialized care provided includes: internal medicine, surgery, obstetrics and gynecology, pediatrics, ophthalmology, psychiatry,
and dermatology.13
This study was conducted from March 14 to April 14, 2015, among women who visited maternal health services from January 2010 to December 2014.
sample population
The sample population was randomly selected from charts of cases and controls from January 2010 to December 2014.
sample size determination and sampling
procedures
ascertainment of cases
The occurrence of death was ascertained based on the information charted. If death is reported on the chart, it was included in the study.
Charts of both cases (all charts of mothers who died during pregnancy, delivery, and up to 42 days after delivery in JUSH from January 2010 to December 2014), and controls (all charts of mothers who visited JUSH for maternal health service utilization from January 2010 to December 2014) were selected from obstetric ward, delivery ward, intensive care unit, operation theater, and gynecologic ward.
First cases were identified from the log book or registra-tion book from wards, and then sampling frame was prepared. One hundred and twenty completed cases were selected from 146 case charts.
After identifying cases to include in the sample, the time of procedures was identified for each of the selected cases. For each case, four controls (ie, women who survived after delivery) were also selected. But when there were more than four possible control candidates, a lottery method was used for selection. The selected 120 maternal deaths and 480 control charts were reviewed.
Charts that had missing values of .30% were replaced
by random selection from available charts.
International Journal of Women's Health downloaded from https://www.dovepress.com/ by 118.70.13.36 on 23-Aug-2020
Dovepress Trend and causes of maternal mortality
Data collection
The data collection instrument was adapted from Maternal Death Surveillance and Response Technical Guidelines the
of Ethiopia.14 The checklist consisted of sociodemographic
data, obstetric and delivery history, presence of comorbidi-ties, cause of death, antenatal and intranatal risks, and pres-ence of complications. To assure the quality of data, five data collectors were trained and pretested the checklist tool. Every day, the filled checklist was reviewed and checked for completeness and relevance.
Data processing and analysis
Data was entered into Epi Data version 3.1 (Informer Tech-nologies Inc., Roseau, Dominica) and then exported for analysis to Stata version 13.0 (StataCorp, College Station, TX, USA). Data was cleaned for inconsistencies and missing
values. Variables that were missed in .40% of total sample
were excluded from analysis. Simple frequencies were done to see the overall distribution of the study subject with the variables under study and to identify any missing data. Multicollinearity test was performed to see collinearity of variables.
Cause of death of women was identified by the WHO application of ICD-10 to maternal death. The distribution of
cause of death was observed using frequency distribution.6
Propensity score matching analysis was used to infer the cause of death. It controls confounder variables by matching the exposed and nonexposed group by calculating propensity score of variables. For cases with the same propensity score, their cause is said to be unrelated to confounders. Therefore, the cases and controls tend to have similar distribution of measured confounders other than cause. Something that we would also achieve using randomization. In the model, there is outcome variable (in our case maternal status), treatment-dependent variable (causes like anemia, hemorrhage, and other causes of death), and treatment-independent variable (observed confounders or variables). Causal inference is determined at the level of significance of P-value #0.05. The coefficient is reported and interpreted in 95% CI level of precision from the model.
Maternal mortality trend was assessed using the total number of cases in the study period. Trend was shown using MMR. The total MMR in 5 years as well as each year’s MMR was calculated using the following formula:
MMR
Total number of maternal deaths in the study period Tot
=
aal number of live births in the study period ×100,000
ethical consideration
Prior to data collection, ethical clearance was obtained from the Ethical Review Committee of Jimma University, College of Health Sciences. The Ethical Review Committee of College of Health Sciences and JUSH permitted us to collect the data from patient records without the need for patient consent. In order to establish anonymous linkage only the codes, and not the names of the participant from the chart, were registered on the checklist.
Results
From the variables, the following were missing in 99% of charts: ethnicity, educational status, marital status, occupation, and income. As a result, they were excluded from analysis.
There were a total of 146 maternal deaths and 17,044 live births in the study period. For trend analysis, all the deaths were included. However, only 120 maternal death charts were included in the analysis of causes of maternal deaths. The other 26 death charts were excluded due to incompleteness of the chart (ie, having .30% of missing values).
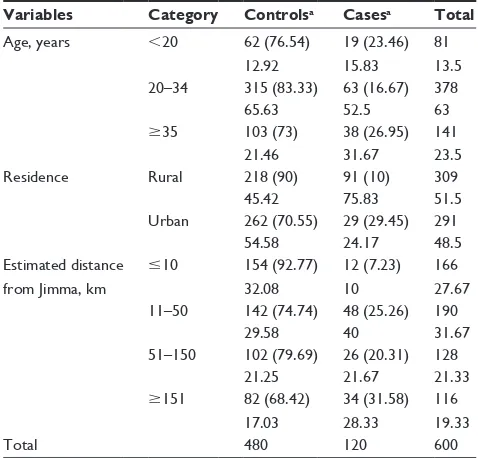
The majority of the respondents (63%) were aged 20–34 years. More than half (52.5%) of cases were in the age group of 20–34 years, whereas nearly two-thirds of controls were in the age group of 20–34 years. Although about three-quarters (75.83%) of cases were from rural areas, more than half (54.58%) of the controls were from urban areas. Forty-eight (40%) cases lived 11 to 50 km distance of the hospital, whereas 154 (32%) controls lived #10 km distance (Table 1).20
Table 1 sociodemographic characteristics of women included in this study from JUsH, May 2015
Variables Category Controlsa Casesa Total
age, years ,20 62 (76.54) 19 (23.46) 81
12.92 15.83 13.5
20–34 315 (83.33) 63 (16.67) 378
65.63 52.5 63
$35 103 (73) 38 (26.95) 141
21.46 31.67 23.5
residence rural 218 (90) 91 (10) 309
45.42 75.83 51.5
Urban 262 (70.55) 29 (29.45) 291
54.58 24.17 48.5
estimated distance from Jimma, km
#10 154 (92.77) 12 (7.23) 166
32.08 10 27.67
11–50 142 (74.74) 48 (25.26) 190
29.58 40 31.67
51–150 102 (79.69) 26 (20.31) 128
21.25 21.67 21.33
$151 82 (68.42) 34 (31.58) 116
17.03 28.33 19.33
Total 480 120 600
Note:aData is presented as frequency (row %) column %.
Abbreviation: JUsH, Jimma University specialized Hospital.
International Journal of Women's Health downloaded from https://www.dovepress.com/ by 118.70.13.36 on 23-Aug-2020
Dovepress
legesse et al
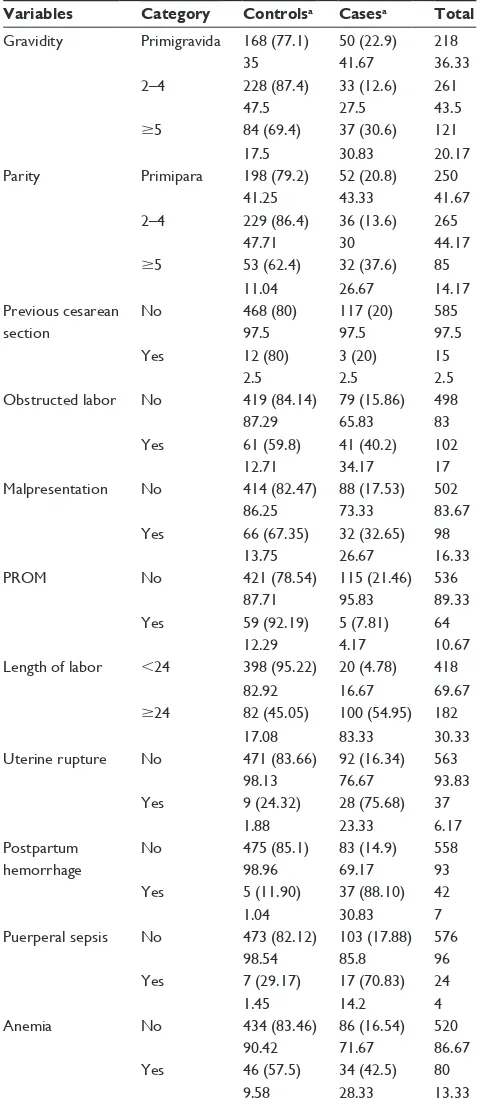
Obstetric and delivery history
Most of the participants had 2–4 gravidities. Most of the 41.67% cases (women who died) were on their first preg-nancy, while most of 228 (47.7%) women who were controls had 2–4 gravidities. In almost the same way, for most of the cases (43.3%), this was the first birth, whereas most of the controls (47.7%) had 2–4 parities. Only three (2.5%) cases and 12 (2.5%) controls had history of previous cesarean section (Table 2). More than two-thirds (67.5%) of cases did not have antenatal care (ANC) follow-up, but in contrast the majority of controls (96.5%) had ANC follow-up (Table 2). (23)
Thirty-four percent of cases had obstructed labor; however, only 12.7% controls had obstructed labor. More than one-quarter (26.7%) of the cases had malpresentation, whereas only 13.75% of controls had malpresentation. More controls (12.3%) had prolonged rupture of membrane than cases (4.2%). Most cases (83.3%) had prolonged labor, while most controls (82.9%) had a length of labor ,24 hours (Table 2). (23)
Most cases (92%) and most controls (81%) were attended to by doctors. Almost half (46%) of the cases had undergone cesarean section or hysterectomy procedures. Assisted vagi-nal delivery accounted for 27% of births in cases, however, more than half (53%) of controls gave birth by spontaneous vaginal delivery. (23)
Pregnancy risk and complications
Of the total deaths or cases, only 2.5% was attributable to multiple gestations. Three-quarters (75%) of cases had hem-orrhage; however, only 30 (6%) of controls had hemorrhage. Six cases who had placenta previa (32.3%) died. Maternal death attributable to abruption placenta was 12%. Abruption placenta was prevalent in 23 (3.83%) women, of whom 14 (61%) died. Only 54 (9%) women had antepartum hemor-rhage, out of them 38 (70%) died, accounting for 32% of total maternal deaths. There was a great disparity in presence of uterine rupture between cases and controls. Almost one-quarter of cases, 28 (23.3%), had uterine rupture, whereas only
9 (,2%) controls had this complication. In the same
man-ner, 37 (30.8%) of cases developed postpartum hemorrhage; however, only 5 (1%) controls had postpartum hemorrhage. Only 46 (8%) women had pregnancy-induced hypertension (PIH), of whom 23 (50%) died, accounting for 19% of the total deaths. (23)
One-fifth of maternal deaths were due to intrapartum or postpartum complications (chorioamnitis, wound infection, and postpartum psychosis). These complications occurred in 45 (7.5%) of the women, out of whom 24 (53%) died.
Seventeen (14%) cases experienced puerperal sepsis, while only 7 (1.5%) controls developed it. Thirty-four (28%) cases had anemia, whereas only 10% of controls had anemia (Table 2). (23)
Table 2 Past obstetric history of women included in this study from JUsH, May 2015
Variables Category Controlsa Casesa Total gravidity Primigravida 168 (77.1) 50 (22.9) 218
35 41.67 36.33
2–4 228 (87.4) 33 (12.6) 261
47.5 27.5 43.5
$5 84 (69.4) 37 (30.6) 121
17.5 30.83 20.17
Parity Primipara 198 (79.2) 52 (20.8) 250
41.25 43.33 41.67
2–4 229 (86.4) 36 (13.6) 265
47.71 30 44.17
$5 53 (62.4) 32 (37.6) 85
11.04 26.67 14.17
Previous cesarean section
no 468 (80) 117 (20) 585
97.5 97.5 97.5
Yes 12 (80) 3 (20) 15
2.5 2.5 2.5
Obstructed labor no 419 (84.14) 79 (15.86) 498
87.29 65.83 83
Yes 61 (59.8) 41 (40.2) 102
12.71 34.17 17
Malpresentation no 414 (82.47) 88 (17.53) 502
86.25 73.33 83.67
Yes 66 (67.35) 32 (32.65) 98
13.75 26.67 16.33
PrOM no 421 (78.54) 115 (21.46) 536
87.71 95.83 89.33
Yes 59 (92.19) 5 (7.81) 64
12.29 4.17 10.67
length of labor ,24 398 (95.22) 20 (4.78) 418
82.92 16.67 69.67
$24 82 (45.05) 100 (54.95) 182
17.08 83.33 30.33
Uterine rupture no 471 (83.66) 92 (16.34) 563
98.13 76.67 93.83
Yes 9 (24.32) 28 (75.68) 37
1.88 23.33 6.17
Postpartum hemorrhage
no 475 (85.1) 83 (14.9) 558
98.96 69.17 93
Yes 5 (11.90) 37 (88.10) 42
1.04 30.83 7
Puerperal sepsis no 473 (82.12) 103 (17.88) 576
98.54 85.8 96
Yes 7 (29.17) 17 (70.83) 24
1.45 14.2 4
anemia no 434 (83.46) 86 (16.54) 520
90.42 71.67 86.67
Yes 46 (57.5) 34 (42.5) 80
9.58 28.33 13.33
Note:aData is presented as frequency (row %) column %.
Abbreviations: JUsH, Jimma University specialized Hospital; PrOM, premature rupture of membranes.
International Journal of Women's Health downloaded from https://www.dovepress.com/ by 118.70.13.36 on 23-Aug-2020
Dovepress Trend and causes of maternal mortality
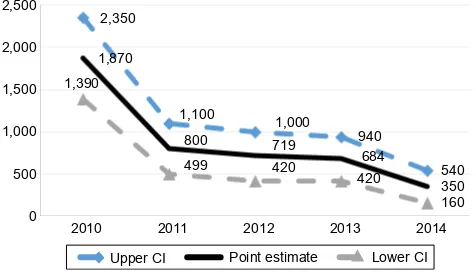
Trend of maternal mortality
There were 146 maternal deaths and 17,044 live births, making the MMR 857 per 100,000 in the 5-year period. The highest death rate occurred in 2010 with an MMR of 1,873/100,000 followed by an MMR of 801/100,000 in 2011. The lowest death rate occurred in 2014 with an MMR of 350/100,000. In 2012, MMR was 719/100,000, whereas it was 685/100,000 in 2013 (Figure 1).
cause of maternal death
Hemorrhage was the common cause of maternal death
accounting for .54%, followed by PIH (20%). Eighty-five
percent of deaths were due to hemorrhage, anemia, and PIH. The majority of (97%) maternal deaths occurred as a result of direct obstetric causes. Every cause of death had a decreasing pattern, but in every year of the study hemorrhage was the leading cause of death (Figure 2).
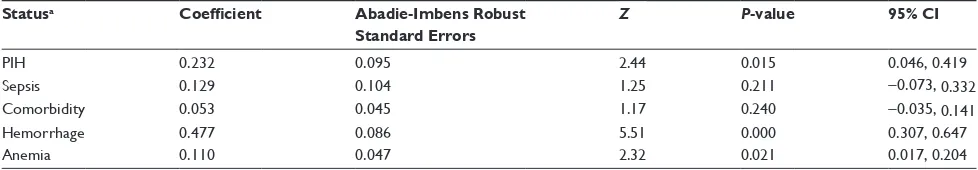
results of propensity score matching
analysis
Chorioamnitis, abortion, and wound infection were excluded from causal inference analysis because they did not meet the criteria for propensity score matching analysis. Propensity score matching analysis showed that hemorrhage, PIH, and anemia were significant causes of maternal death (Table 3).
• An increase of 1,000 women who have hemorrhage
increased maternal deaths by 477
• An increase of 1,000 women who had PIH increased
maternal deaths by 232
• An increase of 1,000 women who had anemia increased
maternal deaths by 110
The predictor variables (treatment-independent variables) were age, parity, referral, ANC visit, gravidity, residence,
distance of residence, and other variables that are summarized in Tables 1 and 2.
Discussion
Trends for maternal death
Maternal death in Ethiopia has a decreasing trend as depicted by different reports and reviews. According to the 2013 combined reports by WHO, UNICEF, the World Bank, and UNFPA, Ethiopia showed a decreasing pattern of maternal
death from 720/100,000 in 2005 to 420/100,000 in 2013.3
Comparing this national figure with the findings from this study revealed high MMR (857/100,000) in JUSH compared to the national figure. Even compared to the 2011 finding
of EDHS (676/100,000), deaths in JUSH is higher.5,7,16 The
observed disparity may be due to the fact that demographic and health surveilance is done on a countrywide represen-tative sample, while this study was done at the hospital in which many high-risk pregnancy women may come, thereby leading to an increase in the number of deaths, Figure 1 shows females who came for institutional delivery (14%).
A review of different community- and hospital-based stud-ies shows a decreasing pattern of maternal death. A review done in Jimma hospital 15 years ago shows fluctuation of MMR in the range of 1,635–2,331/100,000, with total MMR of 1,965/100,000, which is higher than this finding. A review done between 2002 and 2006 in JUSH showed a decreasing pattern, with total MMR of 888/100,000 in the range of (417/100,000, to 1,828/100,000) which is higher than our finding. A review in Ambo hospital from 10 years ago shows fluctuation from 671/100,000 to 3,981/100,000, with total MMR of 1,852/100,000, which is higher than the
3RLQWHVWLPDWH
8SSHU&, /RZHU&,
Figure 1 Trend of maternal deaths from 2010 to 2014 in JUsH.
Abbreviations: JUSH, Jimma University Specialized Hospital; CI, confidence interval.
+HPRUUKDJH 3XHUSHUDOVHSVLV
$ERUWLRQ $QHPLD
3,+ 2WKHUV
Figure 2 Trends of causes of maternal death from 2010 to 2014 in JUsH.
Abbreviations: JUsH, Jimma University specialized Hospital; PIH, pregnancy-induced hypertension.
International Journal of Women's Health downloaded from https://www.dovepress.com/ by 118.70.13.36 on 23-Aug-2020
Dovepress
legesse et al
current finding.10–12,15–17 Decrease in occurrences of death from previous years in JUSH, particularly after 2010, might be due to increasing awareness in the community about institutional delivery, and organizational and policy factors. Organizational factors may include service expansion and human power expansion of JUSH and increasing availability and accessibility of health institutions. Another factor might be that after 2010 in Ethiopia, there was countrywide mobilization to decrease deaths of mothers with the slogan of “no mother should die while she gives birth.” Policy factors like implementation of safe motherhood programs and health extension program in Ethiopia contributed to this effort. In the other extreme, it may be because of underreporting of death due to fear of criticism by higher officials followed by possible detainment of health professionals during investigation of the maternal death; in addition, health institutions are also criticized.
causes of maternal death
Most (97%) of the maternal deaths were due to direct obstetric causes in which hemorrhage was the leading cause followed by PIH, which is consistent with studies done in different countries, as well as Ethiopia. A systematic review done on causes of maternal death by WHO shows nearly 73% of all maternal deaths between 2003 and 2009 were
due to direct obstetric causes.18 Hemorrhage was the
lead-ing direct cause of maternal death worldwide, representlead-ing 27.1% of maternal deaths. But in this finding, hemorrhage was two times higher than this figure, and this might be because the review was inclusive of developed regions in which indirect causes of death are higher. This might result in under-representation. PIH was the second most com-mon direct cause worldwide (14.0%, 11.1–17.4), which is
consistent with the current figure.18 In Ghana, hemorrhage
accounted for 22.8% of maternal mortality, which is lower by more than half of 54%. This might be because, in Ghana, indirect causes are higher than direct causes like infectious disease, and the other reason might be due to measurement
differences as in this research hemorrhage included abortion, but this was not the case in Ghana.19
A study by Gaym12 also shows abortion complications,
ruptured uterus, puerperal sepsis, postpartum hemorrhage, and preeclampsia/eclampsia as the five major causes of maternal mortality. But there is marked reduction in abortion-related mortality after 2000. This is true also in JUSH, with 2% of deaths abortion-related.13 The same finding is also shown in Tigray where major causes of maternal deaths were hemorrhage and PIH accounting for 46% and 19%, respectively, which is an almost comparable finding; but with minimal abortion related death.8
Propensity score matching analysis for causal inference of death shows only hemorrhage, PIH, and anemia as significant causes of maternal death for the sample after controlling all variables (confounders). But of all causes, hemorrhage is the gravest; if there are 1,000 women who have obstetric hemorrhage, almost half (477) of them die. It is a significant cause of death, and this might be because most women (72%) came from rural areas, and might have poor awareness about danger signs, and might also delay seeking care. It may also be because of delay in intervention, which is evidenced by the fact that 71% of women who had hemorrhaged experi-enced prolonged labor. The other reason might be poor first aid management at primary health institutions, since 90% of women who had hemorrhage were referred cases from other health institutions. The consequences of no timely interven-tion are shock and cardiac arrest, leading to death within a short period of time.
Conclusion
This study revealed that the MMR within the 5-year study period has a decreasing trend. Even though the MMR had a decreasing trend, it is still high compared to the national figure, and it is also very high in terms of maternal death classification as per the WHO classification. Most of the women died in the postpartum period, particularly between
Table 3 causes of maternal death in JUsH
Statusa Coefficient Abadie-Imbens Robust
Standard Errors
Z P-value 95% CI
PIH 0.232 0.095 2.44 0.015 0.046, 0.419
sepsis 0.129 0.104 1.25 0.211 -0.073, 0.332
comorbidity 0.053 0.045 1.17 0.240 -0.035, 0.141
Hemorrhage 0.477 0.086 5.51 0.000 0.307, 0.647
anemia 0.110 0.047 2.32 0.021 0.017, 0.204
Notes:aadjusted for all causes and predictor variables (treatment-independent variables) among cases and controls except excluded variables which did not meet the criteria
of propensity score matching analysis. so it is assumed that the cases and controls have same distribution in confounders variables included in the model. To see PIH as a cause of death, all predictor variables and other causes of maternal death are included in the analysis.
Abbreviations: CI, confidence interval; JUSH, Jimma University Specialized Hospital; PIH, pregnancy-induced hypertension.
International Journal of Women's Health downloaded from https://www.dovepress.com/ by 118.70.13.36 on 23-Aug-2020
International Journal of Women’s Health
Publish your work in this journal
Submit your manuscript here: http://www.dovepress.com/international-journal-of-womens-health-journal The International Journal of Women’s Health is an international,
peer-reviewed open-access journal publishing original research, reports, editorials, reviews and commentaries on all aspects of women’s healthcare including gynecology, obstetrics, and breast cancer. The manuscript management system is completely online and includes
a very quick and fair peer-review system, which is all easy to use. Visit http://www.dovepress.com/testimonials.php to read real quotes from published authors.
Dovepress
Dove
press
Trend and causes of maternal mortality
4 and 7 days postpartum. Most maternal deaths occurred because of direct obstetric causes. Hemorrhage was the lead-ing cause of death in every year of the study, and it is the cause for more than half the deaths. PIH and anemia were the other major causes of maternal death. In causal inference estimation, hemorrhage, PIH, and anemia were the significant causes of maternal death. Women who reside in rural areas, presence of comorbidities, women who were referred from health institutions, and women who had prolonged labor had increased likelihood of maternal death.
It is therefore recommended that interventions aimed at combating the high maternal mortality should be both cause-specific as well as target-cause-specific.
Acknowledgment
The authors thank Mizan Tepi University and Jimma University.
Author contribution
TL wrote the proposal, participated in data collection, analyzed the data, and drafted the paper. MA and AD revised and approved the proposal, and participated in data collection, analysis, and drafting the paper. All authors read and approved the final manuscript.
Disclosure
The authors report no conflicts of interests in this work.
References
1. Oxaal Z, Baden S. Challenges to women’s reproductive health: maternal mortality. Report no. 38. Brighton, UK: Institute of Development Studies [IDS]. 1996:46. Available from: http://www.bridge.ids.ac.uk/reports/ re38c.pdf
2. World Bank. The Millennium Development Goals for Health to Rising the Challenges. Washington, DC: World Bank; 2004. Avail-able from: www.worldbank.org/archive/website01063/WEB/ IMAGES/296730PA.PDF
3. WHO, UNICEF, UNFPA, the World Bank and the United Nations Population Division. Trends in Maternal Mortality: 1990 to 2013. 2014.
4. Ronsmans C, Campbell O. Quantifying the fall in mortality associated with interventions related to hypertensive diseases of pregnancy. BMC Public Health. 2011;11(Suppl 1):S8.
5. Kassebaum NJ, Bertozzi-Villa A, Coggeshall MS, et al. Global, regional, and national levels and causes of maternal mortality during 1990–2013: a systematic analysis for the Global Burden of Disease Study 2013. Lancet. 2014;384(9947):980–1004.
6. WHO. International Statistical Classification of Diseases and Related Health Problems. 10th revision. Vol. 2, Instruction Manual. Geneva, Switzerland: WHO; 2010.
7. Koblinksky M, Tain F, Tesfaye Solomon. Reducing maternal mortality and increasing use of skilled birth attendance: Ethiopia and MDG 5.
Ethiop J Reprod Health. 2010;4(1):4–15.
8. Gidey G, Bayray A, Gebrehiwot H. Patterns of maternal mortality and associated factors; A case-control study at public hospitals in Tigray region, Ethiopia, 2012. Int J Pharm Sci Res. 2013;4(5):1918–1929. 9. CSA. Ethiopia Demographic and Health Survey. Addis Ababa, Ethiopia
and Calverton, Maryland, USA: Central Statistical Authority (CSA) and ORC Macro. Addis Ababa, Ethiopia: CSA; 2006.
10. Garomsa H, Dwividi AD. Maternal mortality in Ambo hospital: a five year retrospective review. Ethiop J Reprod Health. 2008;2:2–13. 11. Gaym A. A review of maternal mortality at Jimma hospital, South West
Ethiopia. Ethiop J Health Dev. 2000;14(2):215–223.
12. Gaym A. Maternal mortality studies in Ethiopia-magnitude, causes and trends. Ethiop Med J. 2009;47(2):95–108.
13. Jimma Univeristy Specialized Hospital. Annual report. Jimma, Ethiopia; 2015.
14. Federal Democratic Republic of Ethiopia Ministry of Health. Maternal Death Surveillance and Response (MDSR) Technical Guideline. Addis Ababa, Ethiopia; 2012.
15. Abdella A. Maternal mortality trend in Ethiopia. Ethiop J Health Dev. 2010;24(Special Issue 1):115–122.
16. Berhan Y, Berhan A. Review of maternal mortality In Ethiopia: a story of the past 30 Years. Ethiop J Health Sci. 2014;24(0 Suppl):3–14. 17. Negussie D, Mesfin N. Review of maternal death In Jimma Univeristy
specialized hospital. Ethiop J Health Sci. 2009;19(1):9–12.
18. Say L, Chou D, Gemmill A, Tunçalp Ö, Moller AB, Daniels JD, et al. Global Causes of maternal death: a WHO systematic analysis. Lancet Global Health. 2014;2(6):e323–e333.
19. Asamoah BO, Moussa KM, Stafström M, Musinguzi G. Distribution of causes of maternal mortality among different socioeconomic status.
BMC Public Health. 2011;11:159.
20. Legesse T, Abdulahi M, Dirar A. Risk factors of maternal death in Jimma University specialized hospital: a matched case control study.
Am J Public Health Res. 2016;4(4):120–127.
International Journal of Women's Health downloaded from https://www.dovepress.com/ by 118.70.13.36 on 23-Aug-2020