ROCKEFELLER MEDICAL I ' " " INSTITUTE O F NEUl'-OI'
T H E N A T IO N A L H C o
q u e e n s q u a r e, L O N D O N ,
W C I N 3BG
The developing role o f Magnetic Resonance Imaging
in Phase III multiple sclerosis treatment trials:
technical considerations and results o f a large
multieentre study.
PD Molyneux
Thesis submitted for the degree o f doctor o f medicine to the
University o f London.
NM R Research Unit
Institute o f Neurology
Queen Square
London, UK
ProQuest Number: U643909
All rights reserved
INFORMATION TO ALL USERS
The quality of this reproduction is dependent upon the quality of the copy submitted.
In the unlikely event that the author did not send a complete manuscript and there are missing pages, these will be noted. Also, if material had to be removed,
a note will indicate the deletion.
uest.
ProQuest U643909
Published by ProQuest LLC(2016). Copyright of the Dissertation is held by the Author.
All rights reserved.
This work is protected against unauthorized copying under Title 17, United States Code. Microform Edition © ProQuest LLC.
ProQuest LLC
789 East Eisenhower Parkway P.O. Box 1346
Abstract
Magnetic resonance imaging (MRI) provides a powerful tool for both monitoring disease
evolution in multiple sclerosis (MS) and assessing the efficacy of therapeutic intervention. A
monthly MRI protocol is now routinely used to screen potential MS therapies, with the effect of
treatment on MR activity providing the primary outcome measure. Phase III definitive MS
treatment trials also generally incorporate an MR protocol. However, in view of the uncertain
relationship between MR measures and clinical outcome, the primary endpoints of phase III
studies are currently based on clinical indices.
The first chapter of this thesis provides a critical review of the available MRI tools for
monitoring disease progression. The limited extent of the relationship between clinical outcome
and standard MR measures is stressed, and potential factors contributing to this dissociation are
reviewed.
The thesis is then presented in three parts, the first of which looks at recent developments in MRI
acquisition and analysis methodology. In particular, the utility of three established techniques
for measuring brain lesion volume (global thresholding, manual outlining and contouring) is
examined. Work is presented that suggests a limited role for global thresholding-based lesion
segmentation in serial MS studies. A comparison of a semi-automated local thresholding
algorithm (contouring) with the currently recognised gold standard segmentation method
(manual outlining) is presented, highlighting the advantages in terms of precision and reliability
with the contour technique. The effect of slice thickness on MS lesion detection and brain lesion
The second part examines the relationship between different MRI parameters and assesses the
strength of clinical/MRI correlations in a substantial cohort of patients. The extent to which
change in annual Tj lesion volume is dictated by ongoing inflammatory activity (assessed with
monthly gadolinium enhanced imaging) is investigated using this cohort. Furthermore, the
relationship between standard clinical indices of disease activity and progression on the one
hand, and MR activity on monthly and annual imaging on the other, is defined. Using an
extension of this database, power calculations are presented based on an annual imaging protocol
where the change in Tj lesion volume provides the outcome measure. The aim is to guide
efficient trial design by providing sample sizes for a typical multicentre parallel group placebo-
controlled design. The results suggest that annual Tj lesion volume quantification provides a
powerful and robust tool for monitoring the effect of treatment, and demonstrate that the current
practice of including several hundred patients in an MR protocol produces substantial
overpowering.
Part Three describes the MRI results of a phase III trial using interferon beta-lb in patients with
secondary progressive MS. The relationships between clinical and MR indices are also presented,
Abbreviations
ANOVA Analysis of variance
BBB Blood brain barrier
CNR Contrast to noise ratio
CoR Coefficient of repeatability
CoV Coefficient of variation
CR Contrast ratio
CSE Conventional spin echo
DSS Disability status scale
EAE Experimental allergic encephalomyelitis
EDSS Expanded Disability Status Scale
FLAIR Fluid attenuated inversion recovery
FOV Field of view
FSE Fast spin echo
FSS Functional Status Score
Gd-DPTA Gadolinium-diethylene-triaminepenta-acetic acid
ICC Intraclass correlation coefficient
IFN Interferon
ITT Intention to treat
MHC Major histocompatability complex
MMP matrix metalloproteinase
MRI Magnetic resonance imaging
MS Multiple sclerosis
NAA N-acetyl aspartate
NAWM Normal appearing white matter
PP Primary progressive
RR Relapsing remitting
SEM Standard error of the mean
SNR Signal to noise ratio
SP Secondary progressive
SRCC Spearman rank correlation coefficient
TLV Total lesion volume
IN F Tumour necrosis factor
VCAM Vascular cell adhesion molecule
Tables
Table 1.1 Schumacher criteria for diagnosis of MS 1
Table 1.2 Poser Committee criteria 3
Table 1.3 MS symptoms at presentation and during disease course 5
Table 1.4 The distribution of brain MRI abnormalities in 200 MS patients 24
Table 1.5 Diagnostic MRI criteria strongly suggestive of MS 25
Table 1.6 Requirements for MS clinical outcome measures 33
Table 1.7 Clinical outcome measures in patients with MS 36
Table 1.8 Studies showing a reduction in MRI activity 39
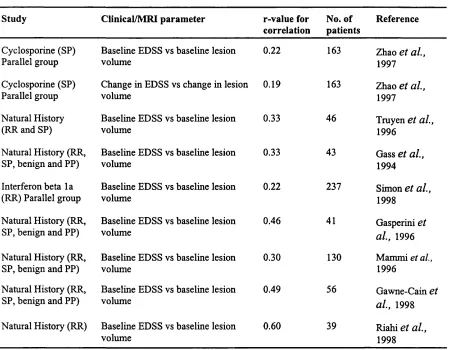
Table 1.9 Significant clinical/MRI correlations from natural history and other 43
treatment trials
Table 3.1 Lesion volume measurements on baseline scans and for changes in 58
lesion volume with the two techniques
Table 3.2 Intra and inter rater precision and reliability for baseline TLV 59
Table 3.3 Intra and inter rater precision and reliability for change inTLY 60
Table 5.1 Lesion volume according to sequence/slice thickness 82
Table 5.2 The effects of progressive reduction in slice thickness 84
Table 5.3 Contrast to noise and contrast ratios for each sequence 85
Table 6.1 Clinical and MRI characteristics of the patient sample 96
Table 6.2 Cross sectional and longitudinal clinical/MRI correlations 98
Table 6.3 Correlations between the MRI parameters 101
Table 7.1 Clinical and MRI characteristics of the patient sample 114
Table 7.2 Variance-covariance matrices for RR and SP MS subgroups 114
Table 7.3 Sample size according to effect size and study duration 115
Table 7.4 The effect of added noise on sample size requirements 117
Table 8.1 The effect of IFN-p-lb on brain TLV 132
Table 8.2 The effect of IFN-P-lb on MRI activity 133
Table 8.4 The effect of treatment on MRI results 137
Table 9.1 Baseline clinical characteristics 150
Table 9.2 Proportion of patients with confirmed EDSS progression 151
Table 9.3 Secondary/tertiary outcome variables 152
Table 9.4 Baseline TLV according to treatment arm 153
Table 9.5 Absolute change in TLV (cm^) according to treatment arm 155
Table 9.6 Absolute change in TLV (cm^) from previous year by treatment arm 156
Table 9.7 Percentage change in TLV from baseline by treatment arm 157
Table 9.8 Cumulative number of active T2 lesions by treatment arm 158
Table 9.9 The proportion of active scans per patient by treatment arm 160
Table 9.10 The proportion of active patients by treatment arm 160
Table 9.11 Correlations between TLV change and active Tj lesions 162
Table 9.12 Correlations between baseline TLV and subsequent MRI activity 163
Table 9.13 Cross sectional/longitudinal correlations between EDSS and TLV 165
Figures
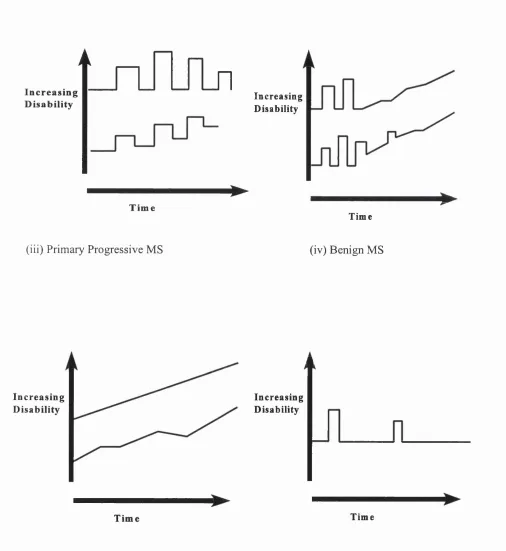
Figure 1.1 Disease subtypes according to time course 4
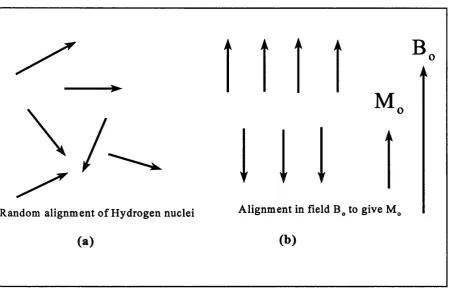
Figure 1.2. (a) Random alignment of Hydrogen nuclei in absence of a 15
magnetic field and (b) net magnetic field (M J created by
Figure 1.3 Hydrogen nucleus precessing in the presence of 15
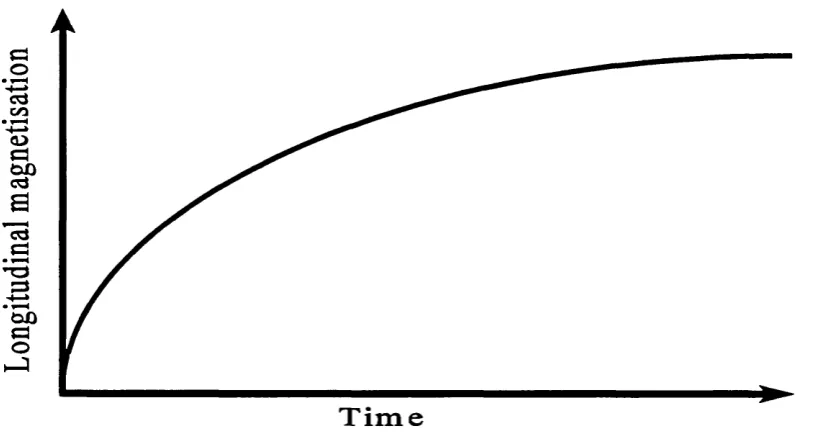
Figure 1.4 The T, relaxation curve 17
Figure 1.5 The Tj relaxation curve 17
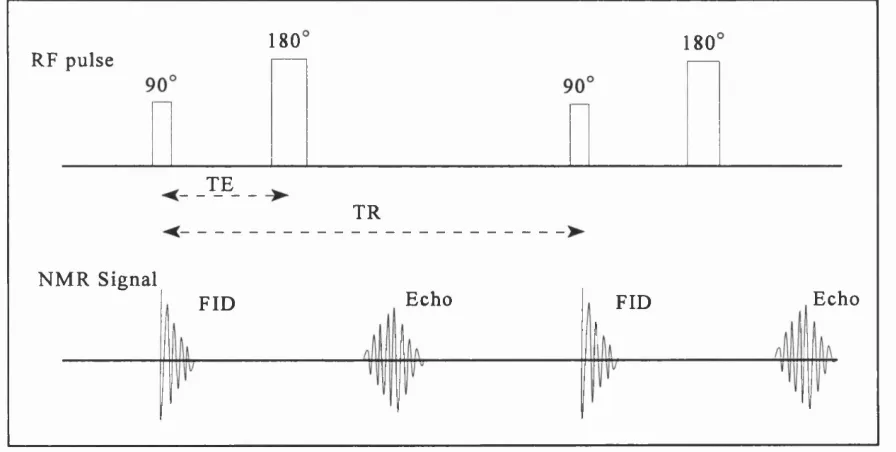
Figure 1.6 The Spin Echo Sequence 18
Figure 1.7 Comparison between CSE and fast-FLAIR sequences 21
Figure 4.1 Lesion volumes on baseline scans according to technique 70
Figure 4.2 Axial brain MRI at (a) baseline and (b) follow up 71-72
Figure 4.3 The variable incorporation of non-lesion regions over time 73
Figure 5.1 Normal findings with the 3D fast-FLAIR sequence 80
Figure 5.2 The effect of sequence and slice thickness on lesion volume 83
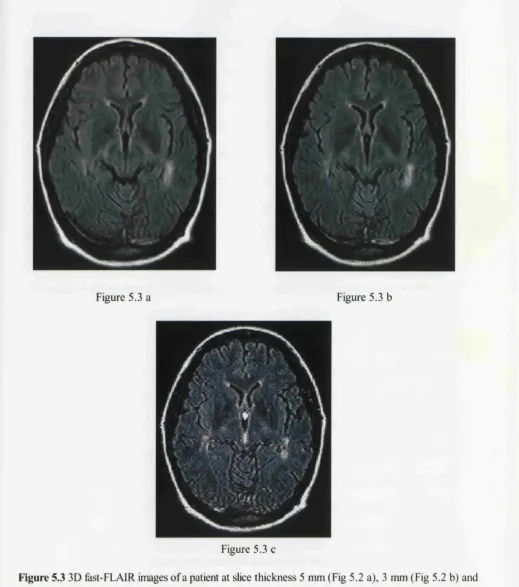
Figure 5.3 3D fast-FLAIR images at slice thickness 5, 3 and 1 mm 86
Figure 6.1 Relapse rate vs new enhancing MRI activity for RRMS 99
Figure 6.2 Relapse rate vs new enhancing MRI activity for SPMS 99
Figure 6.3 Lesion volume change vs new enhancing lesion rate in RRMS 102
Figure 6.4 Lesion volume change vs new enhancing lesion rate in SPMS 102
Figure 7.1 Sample size per arm For RRMS cohort 116
Figure 7. 2 Sample size per arm For SPMS cohort 116
Figure 7.3 The impact of noise addition on sample size for RRMS cohort 118
Figure 7.4 The impact of noise addition on sample size for SPMS cohort 118
Figure 8.1 The effect of IFN-g-lb on extended follow up 134
Figure 9.1 The mean percentage change in TLV by treatment arm 154
Publications arising from this thesis
Molyneux PD, Filippi M, Barkhof F, Gasperini C, Yousry TA, Truyen L., et al. Correlations
between Monthly Enhanced MRI Lesion Rate and Changes in Tj Lesion Volume in Multiple
Sclerosis, Ann Neurol 1998;43:332-339
Molyneux PD, Fletcher A, Gunn B, Robinson P, Gallagher H, Moseley IF., et al. Precision and
reliability for measurement of change in MRI lesion volume in multiple sclerosis: a comparison
of two computer assisted techniques. J Neurol Neurosurg Psychiatry 1998;65:42-47
Molyneux PD, Tubridy N, Parker GJM, Barker GJ, MacManus DG, Tofts PS., et al. The effect
of section thickness on magnetic resonance lesion detection and quantification in multiple
sclerosis. Am J Neuroradiol 1998;19:1715-1720
Molyneux PD, Wang L, Lai M, Barker GJ, Tofts PS., et al. Quantitative techniques for lesion
load measurement in multiple sclerosis: an assessment of the global threshold technique after non
uniformity and histogram matching corrections. Eur J Neurol 1998;5:55-60
Tubridy N, Coles A, Molyneux P, Compston DAS, Barkhof F, Thompson AJ., et al. Secondary
progressive multiple sclerosis: the relationship between short term MRI activity and clinical
features. Brain 1998;121:225-231
Barkhof F, Filippi M, van Waesberghe JH, Molyneux PD, Rovaris M, Lycklama a Nijeholt., et
al. Improving interobserver variation in reporting gadolinium-enhanced MRI lesions in multiple
Acknowledgements
This thesis would not have been possible without the help and support of a large number of
people. First of all, I would like to thank Professor DH Miller for supervising my research in
such a constructive and supportive manner. His ability to make time to discuss any aspect of my
work despite his multitude of other commitments has been a revelation.
I am also grateful to the many other members of the NMR Research Unit who have provided
moral and scientific support throughout my research. Particular thanks go to Niall Tubridy,
Catherine Noctor and Peter Brex for providing a voice of reason when things were not going
according to plan.
The lesion volume quantification performed in Chapters 3 and 9 was performed by a large
number of dedicated raters, notably Elizabeth Gunn, Alison Fletcher, Paula Robinson, Sara
Lewis, Sarah Gregory, Claire Middleditch and Caraline Fogg. Professor DH Miller and Dr IF
Moseley checked the hard copy marking that I performed for the work presented in Chapter 4,
with Dr Ming Lai acting as the second rater. Niall Tubridy acted as the second hard copy marker
in Chapter 5.
The database presented in Part 2 was acquired as part of an EEC funded European collaboration
(MAGNIMS). The clinical and MRI data from the various sites was provided as follows:
Amsterdam data provided by Dr F Barkhof, Milan by Dr M Filippi, Munich by Dr T Yousry,
Basel by Dr L Kappos, and Rome by Dr C Gasperini. The lesion volume quantification from the
non-London patients was performed locally by Drs MA Rocca, L Truyen and K Schweikert. The
statistical analysis for the power calculations presented in Chapter 7.
I am also grateful to Beatrice Gomez-Ansen, Peter Brex, Valerie Stevenson and Niall Tubridy
for assisting in the hard copy analysis of the data presented in Part 3, together with the physicists
and radiographers who were such an important part of this project. I would also like to
acknowledge the substantial number of personnel who performed the clinical evaluation across
the European centres.
Finally, I would like to thank Schering for funding my research and Sheilagh for her continued
Contents
Title page i
Abstract il
List of Abbreviations iv
List of Tables v
List of Figures vii
Publications arising from this work viii
Acknowledgements x
Contents xii
Chapter 1. Introduction and background 1
1.1 Multiple Sclerosis 1
1.1.1 Clinical subgroups based on disease time course and severity 2
1.1.2 Symptomatology 5
1.1.3 Neuropathology 6
1.1.3.1 White matter components 6
1.1.3.2 The acute lesion 6
1.1.3.3 The chronic lesion 7
1.1.4 Immunology 8
1.1.5 Epidemiology 9
1.1.6 Natural History 10
1.1.7 Diagnosis of MS 12
1.2 M R I in multiple sclerosis 13
1.2.1 T echnical background 13
1.2.1.1 Spin echo imaging 18
1.2.1.2 Spatial localisation 19
1.2.1.3 Techniques for Tj weighted imaging 20
1.2.2 MRI in diagnosis 22
1.2.3 MRI natural history studies in understanding disease evolution 26
1.2.3.2 Tj weighted imaging 28
1.2.3.3 Serial Studies in MS subgroups 29
1.2.4 MRI as a prognostic tool in clinically isolated syndromes 30
1.3 MS treatment trials 31
1.3.1 Trial design 31
1.3.2 Clinical outcome measures 32
1.3.2.1 Relapse frequency 33
1.3.2.2 EDSS and functional systems scores 34
1.3.3 Surrogate outcome measures 37
1.4 MRI as an outcome measure in MS treatment trials 37
1.4.1 MRI in exploratory (phase II) studies 38
1.4.2 MRI in definitive (phase III) treatment trials 40
1.4.3 Putative markers of disease progression 44
1.4.3.1 Magnetisation transfer imaging 44
1.4.3.2 Hypo-intensity on Tj weighted images (black holes) 46
1.4.3.3 Spinal cord imaging 47
1.4.3.4 Brain volume quantification 48
1.4.3.5 Proton MR spectroscopy 49
1.4.3.6 Other potential putative markers 49
Part 1. Technical issues in M R image acquisition and data analysis 50
Chapter 2. Background 50
2.1 Accuracy 50
2.2 Reproducibility 50
2.3 Reliability 51
2.4 Efficiency 51
2.5 Stability over time 52
Chapter 3. Semi-automated lesion segmentation with the contour technique 54
3.1 Introduction 54
3.2 Patients and Methods 54
3.2.1 MRI sequences 55
3.2.2 Lesion identification 55
3.2.3 Quantification of lesion volume 55
3.2.4 Statistics 56
3.3 Results 58
3.3.1 Lesion volumes obtained by the two techniques 58
3.3.2 Repeated measurements on the baseline scans 59
3.3.3 Repeated measurements of change in lesion volume 60
3.3.4 Time consumption for each technique 60
3.4 Discussion 60
Chapter 4. The utility of global thresholding after histogram matching 65
4.1 Introduction 65
4.2 Patients and Methods 66
4.2.1 Statistics 68
4.3 Results 69
4.3.1 Effectiveness of the histogram matching correction 69
4.3.2 Reproducibility/time consumption of the contour method 69
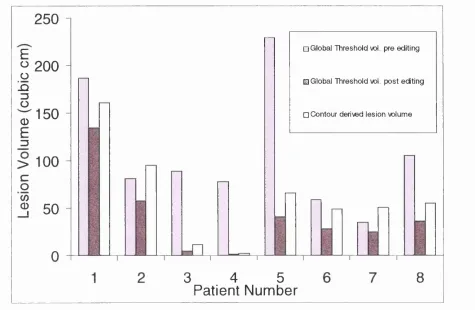
4.3.3 Global threshold volumes before editing 69
4.3.4 Global threshold volumes after manual editing 70
4.4 Discussion 73
Chapter 5. The effect of slice thickness on MS lesion detection and 76
quantification
5.1 Introduction 76
5.2 Patients and Methods 87
5.2.1 Patients 87
5.2.3 Image Analysis 79
5.2.4 Statistical analysis 81
5.3 Results 82
5.4 Discussion 87
Part 2. An assessment of Tj lesion volume as a surrogate outcome 91
Chapter 6. The relationship between T2 lesion volume change and monthly 91 MRI activity
6.1 Introduction 91
6.2 Methods 92
6.2.1 Patients 92
6.2.2 MRI 93
6.2.3 Statistical methods 94
6.3 Results 94
6.3.1 Clinical characteristics 94
6.3.2 MRI characteristics 95
6.3.3 Clinical/MRI correlations for baseline MRI data 97
6.3.4 Clinical/MRI correlations for longitudinal MRI data 97
6.3.5 Correlations between the MRI parameters 100
6.4 Discussion 103
Chapter 7. Sample size calculations for phase III trials based on lesion volume 108
7.1 Introduction 108
7.2 Methods 109
7.21 Patients 109
7.2.2 MRI 110
7.2.3 Statistical methods 110
7.3 Results 112
Part 3. A multicentre phase III trial of interferon beta lb in SPMS 125
Chapter 8. Background to the Trial 125
8.1 Immunoregulation by the interferons 126
8.2 Early clinical trials 127
8.3 Systemic administration of recombinant IFN 128
8.4 Mechanism of action of IFN-P 129
8.5 The IFN-P-lb study in RRMS 131
8.6 Recombinant IFN-P-la (Avonex) 135
8.7 Phase III Study of IFN-P-la (rebif) 139
8.8 Summary of the IFN-p studies in RRMS 140
8.9 The IFN-p-lb study in SPMS 140
Chapter 9. The IFN-p-lb study: Results of the annual MRI protocol 142
9.1 Trial Methodology 142
9.1.1 MRI acquisition protocol 143
9.1.2 MRI analysis 145
9.1.3 Statistical analysis 148
9.1.3.1 Primary MRI outcome; change in TLV 148
9.1.3.2 Number of new/enlarged lesions 148
9.1.3.3 Number of active scans/patients 148
9.1.3.4 Clinical/MRI correlations 149
9.2 Clinical Results 149
9.3 Results of the annual MRI analysis 153
9.4 Correlations between the MRI outcomes 161
9.5 Clinical/MRI correlations 164
9.6 Discussion 167
9.6.1 MRI findings 167
9.6.2 Clinical/MRI correlations 171
Chapter 10. Conclusions 174
Chapter 1. Introduction and Background
1.1 Multiple Sclerosis
Multiple sclerosis (MS) is an acquired primary demyelinating disease of the central nervous
system (CNS) in which myelin is the target of an autoimmune inflammatory process. It
represents the most common idiopathic inflammatory disease of the CNS. Although there had
been earlier partial descriptions, multiple sclerosis was first identified as a distinctive disease by
Charcot in 1868, who named it ‘sclérose en plaques’ (Charcot, 1868). His great contribution was
in linking careful observation of symptoms and signs of disease in life with pathological findings
in the nervous system after death. Several other clinicians and investigators have since made
important contributions in characterising the disease.
The onset of first symptoms is typically in early adult life; for 70% of patients the onset is
between 20 and 40 years of age. The hallmarks of the disease are temporal and anatomical
dissemination involving the CNS white matter. In 90%, the initial temporal profile comprises
neurological disturbances occurring in multiple episodes (also termed attacks, exacerbations or
relapses), followed by recovery (remission). A relapse has been defined as a neurological event
lasting more than 24 hours that is not attributable to another cause (Poser et al., 1983). Remission
usually occurs more slowly than onset of a relapse, and may be complete or incomplete. The
second hallmark is the anatomical dissemination of lesions within the CNS.
Different diagnostic criteria have been developed over the years. The Schumacher criteria link
natural history and physical signs for the diagnosis of MS (Schumacher 1965) (Table 1.1). These
criteria are based exclusively on clinical features. With the advent of various investigative
become established that incorporate the results of such investigations (Poser et al., 1983). The
Poser Committee criteria (Table 1.2) are now routinely followed for research purposes,
combining both clinical and paraclinical information to define the level of diagnostic certainty.
It is self evident that there must be no other cause for the symptoms, signs or abnormal results
of investigations.
Neurologic examination reveals objective abnormalities of CNS function
History indicates involvement of two or more parts of the CNS
CNS disease predominantly reflects white matter involvement
Involvement of CNS follows one or two patterns:
- Two or more episodes, each lasting at least 24 hours, and k one month apart
- Slow or stepwise progression of signs and symptoms over at least 6 months
Patient 10-50 years old at onset
Signs and symptoms cannot be better explained by other disease process
Table 1.1. Schumacher criteria for diagnosis of MS (from Schumacher et al, 1965)
1.1,1 Clinical subgroups based on disease time course and severity
MS is a disease with a wide range in clinical expression in terms of relapse frequency, rate of
progression and severity. Categorisation of MS cases into different subtypes is important in the
design of, and recruitment for, multicentre clinical trials that are based on defined patient groups
and require narrow entrance criteria. Following a survey among clinicians involved in MS, a
standardised classification was proposed that has now achieved widespread recognition (Lublin
& Reingold 1996). The commonest initial presentation (90%) is a relapsing remitting disease
full recovery (Figure 1.1); between relapses there is no disease progression. Secondary
progressive (SP) MS is defined as an initial relapsing remitting course followed by progression
with or without occasional relapses, minor remissions and plateaus. Secondary progressive MS
can be seen as a long-term outcome of relapsing remitting disease, where the baseline between
relapses has begun to worsen. Primary progressive (PP) MS is characterised as disease
progression from onset with occasional plateaus and temporary minor improvements allowed.
Such a course is seen in 10% of MS patients. Benign MS is defined as a relapsing remitting time
course with minimal or no disability 15 years after disease onset. Other terms such as relapsing
progressive and progressive relapsing have been less clearly defined (Lublin & Reingold 1996)
and are not commonly used to define patients for inclusion into clinical trials.
Category Attacks Clinical
evidence
Paraclinical
evidence
CSF oligoclonal
bands
Clinically definite MS
1 2 2
2 2 1 and 1
Clinically probable MS
1 2 1
2 1 2
3 1 1 and 1
Laboratory supported definite MS
1 2 1 or 1 +
2 1 2 +
3 1 1 and +
Laboratory supported probable MS
1 2 +
(i) Relapsing remitting MS (ii) Secondary Progressive MS
LnJlrin
I n c r e a s in gD is a b ilit y In crea sin g
D isab ility
►
T i m e
T im e
(iii) Primary Progressive MS (iv) Benign MS
I n c r e a s in g D is a b ility
In c rea sin g D isa b ility
Time T im e
1.1.2 Symptomatology
MS is a complex clinical disorder with a wide range of expression, often related to the severity
and form of the disease. Typically, negative symptoms and signs predominate, examples
including loss of vision, strength or sensation (Table 1.3). The commonest symptoms of a relapse
are weakness, optic neuritis or sensory disturbance, often occurring in isolation; ataxia usually
occurs in combination with a cluster of symptoms such as vertigo, diplopia, weakness and
sensory disturbance, reflecting an infratentorial focus. In primary progressive MS, there is most
often an insidious development of a spastic and ataxic paraparesis; very rarely there may be
progressive optic neuropathy. Less commonly, positive symptoms such as trigeminal neuralgia,
Lhermittes symptom or tonic spasms may occur.
Reported deficit Presenting During disease course
V isual/Oculomotor 49% 100%
Paresis 43% 88%
Paraesthesia 41% 87%
Incoordination 23% 82%
Genito-urinary/bowel 10% 63%
Cerebral 4% 39%
Note. Since some patients had multiple symptoms, the total is greater than 100%.
1.1.3 The Neuropathology o f MS
1.1.3.1 White matter components
Myelin is the major structural component in normal white matter, accounting for about 25% of
the dry weight of the brain. Oligodendrocytes are responsible for the elaboration and
maintenance of myelin within the CNS. Each myelin sheath is elaborated around a segment of
axon by the flattening and spiral wrapping of a single oligodendrocyte cell process. This
represents an intemode of myelin and each end is demarcated by a node of Ranvier.
Oligodendrocytes are heavily outnumbered by the myelin sheaths they produce, and it has heen
estimated that each can maintain 30-50 intemodes (Raine, 1997). They do not respond actively
after injury and frequently degenerate, a key feature in MS plaque formation.
Separating and penetrating the bundles of myelinated nerve fibres are astrocytes, the predominant
supporting and structural elements of white matter. Unlike oligodendrocytes, astrocytes respond
readily to injury by proliferating and synthesising glial fibrils. Such astrogliosis leads to a state
of sclerosis (scarring), a key hallmark of the MS plaque. The other major white matter
components are microglia, ependymal cells lining the ventricles, and blood vessels.
The interaction between these white matter structural components and the immune system
influences the evolution of demyelinating lesions, which over time progress to leave scar tissue
containing bundles of naked axons.
1.1.3.2 The acute MS lesion
The major pathological hallmarks of the acute MS lesion are oedema, inflammation and acute
myelin breakdown. The margin of an acute lesion is typically indistinct due to ongoing
extracellular space. One of the most striking histological features is the intense inflammatory
response and clear association of lesion activity with small venules. Diffuse parenchymal
infiltration by macrophages and perivascular lymphocyte cuffing are common. The previously
well myelinated parenchyma is reduced to a loosely packed, oedematous zone containing an
abundance of myelin debris and fat laden macrophages. Myelin destruction is effected by
phagocytosis involving investing macrophages, although hypertrophic astrocytes may be
involved to a lesser degree. Signs of axonal transection and degeneration may also be seen in
acute, early lesions (Trapp et al, 1998).
1.1.3.3 The Chronic MS lesion
Chronic MS plaques are the most frequent type found at autopsy and reveal variable degrees of
demyelination, axonal loss and gliosis. Myelin staining confirms chronic plaques as areas of
demyelination, demarcated from adjacent white matter by a sharp edge to give a punched out
appearance. Most of the demyelinated plaque parenchyma is replaced by a network of astroglial
scar tissue, and axonal loss is prominent (Lassmann et al, 1994), particularly at the centre of the
plaque. Astrocytes are well separated, often multi-nucleated, and sharply demarcate the plaque
from surrounding normal white matter. In the most chronically demyelinated plaques, fibrous
astrogliosis is intense, with glial processes forming parallel rows; there is no evidence of ongoing
inflammation or remyelination, and oligodendrocytes are absent.
The edge of a chronic lesion typically displays evidence of ongoing activity, with reactive
astrocytes and evidence of proliferation. Furthermore, it is not unusual to find a rim of
proliferated oligodendrocytes around the edge of a lesion, sometimes in association with
remyelination. More extensive remyelination may be seen, especially in patients with a short
prominent inflammatory component upon a previously demyelinated plaque, with astroglial
hypertrophy, oligodendrocyte hyperplasia and ongoing demyelination.
1.1 A Immunology o f MS
The aetiology of MS is still unknown, but it is widely accepted that a T-cell autoimmune
response is involved in the demyelinating process. An autoimmune pathogenesis is supported
by a number of findings; (i) the composition of CNS white matter infiltrates consisting primarily
of lymphocytes and monocytes, (ii) the association with genes relevant to immune responses, and
(iii) the response to both immunosuppressive and immunomodulatory treatments (Martin et al,
1997). A greater understanding of the immunopathological basis for the inflammatory
demyelinating process has resulted fi“om the study of an animal model, experimental allergic
encephalomyelitis (EAE), which is induced by injection of myelin components into susceptible
animal strains. Collectively, studies in patients and animals indicate that MS is likely to reflect
the result of a primarily T-cell driven aberrant immune response to several myelin and non
myelin CNS antigens. Epidemiological and immunological data suggest that viral infection may
play a pivotal role in induction of disease in genetically susceptible individuals. Several viruses
such as measles virus, herpes virus, paramyxovirus and various retroviruses have been implicated
in the aetiology of MS. However, a universal role for a single virus has yet to be demonstrated.
Viruses may cause demyelination by direct lysis of oligodendrocytes, immune mediated damage
of virus infected oligodendrocytes, virus induced autoimmune demyelination or bystander
demyelination (Martin & McFarland 1997). While the precise mechanism of viral induction is
at present elusive, an autoimmune pathogenesis directed against myelin antigens is likely. T-cells
reactive to a number of myelin sheath antigens such as myelin basic protein, proteolipid protein
and myelin oligodendrocyte protein have been isolated from both the blood and cerebrospinal
mimicry, bystander activation and cytokine release have been postulated for this process
(Hartung 1997). Penetration of the blood brain barrier (BBB) by such autoreactive circulating
T-cells then occurs.
Once within the CNS, activated T-cells undergo proliferation and start a cascade of inflammatory
reactions through release of cytokines such as tumour necrosis factor a (TNFa) and interferon-y
(Beck et al, 1988). Further myelin damage may occur via reactive oxygen species, proteases and
complement activation.
Several mechanisms may operate to terminate the acute inflammatory episode; examples include
increased generation of down regulatory cytokines, apoptosis of autoreactive lymphocytes
(Schmeid et al., 1993 ) and enhancement of T-cell suppressor activity (Hartung 1997).
1,1.5 Epidemiology o f MS
The varying susceptibility according to race (more common in northern Europeans, less common
in Orientals) implicates genetic factors. This is supported by the increased incidence of MS in
close blood relatives, especially in the monozygotic twins of patients with MS (Mumford et al,
1994). Familial MS studies suggest that more than one gene is likely to confer susceptibility to
the disease. However, at present little is known about the genes determining genetic
susceptibility, although the common Caucasian MHC class IIHLA-DR2 haplotype appears to
play a role (Compston & Sadovnick 1992).
The aetiological role of environmental factors is supported by the distinctive geographic
distribution of the disease. The worldwide distribution can be described within three frequency
with prevalence rates of greater than 30 per 100 000; (2) medium frequency areas such as
Australia, the Southern United States and parts of Russia, with prevalence rate of 5-29 per 100
000; and (3) low frequency areas, such as equatorial Africa, Alaska and Greenland, with
prevalence rates less than 5 per 100 000 (Kurtzke 1997). Furthermore, countries such as Australia
and New Zealand that exhibit relative ethnic homogeneity among the northern European resident
population, show a North-South gradient. This latitude effect has been used to support the role
of environmental factors in MS aetiology (Hammond et al 1988; Miller et al, 1990). This has
been further supported by studies on migrants. Some prevalence studies on groups of North
Americans and Northern Europeans who had moved from high to low risk areas have
demonstrated that those migrating after 15 years of age tend to maintain a higher level of risk.
In contrast, those moving before this age acquired the risk of the host country (Alter & Okihiro
1971). However, the Australian migrant studies showed no age cut off.
The existing data supports the hypothesis that both genetic and environmental factors are
important. Since genetic susceptibility is not sufficient by itself to cause MS, and with evidence
that no single environmental factor in isolation can explain its development, it is possible that
several factors are involved. MS predisposition may be induced by polygenes, and various
environmental factors may trigger the disease in genetically susceptible individuals. However,
one still cannot exclude the possibility that a single infectious agent triggers the disease, resulting
in a heterogeneous phenotype because of differences in the hosts immunogenetic response.
1,1,6 Natural History o f MS
In 90% of MS patients there is an initial relapsing and remitting course, but subsequent
conversion to secondary progressive disease occurs in over 50% within 10-15 years
failure of remission and secondary progression of disease.
The average relapse frequency in relapsing remitting disease is 0.1-1 per year (Weinshenker &
Ebers 1987). Most (British and Dutch MS azathioprine Trial Group 1988; Paty et al, 1993), but
not all (Goodkin et al, 1989) studies have found that relapse frequency declines over time,
although this may in part reflect regression to the mean (Weinshenker 1994). Relapse rate also
declines with increasing age (Weinshenker 1994). Several factors modestly predict the outcome
of MS relapses. The rapidity of onset is associated with recovery; the more rapid the onset, the
higher the level of recovery. The relapse severity may also be a factor (Weinshenker 1994).
While recovery from a relapse may be protracted, the probability of recovery drops substantially
after one month following relapse (Kurtzke et al, 1973).
Once the progressive phase is entered, the average rate of progression is approximately 0.5 EDSS
points per year (Weinshenker et al, 1989), but this is highly variable. Using data acquired from
the placebo group of MS treatment trials, it has been shown that 30-50% deteriorate by one
EDSS point over 2-3 years (Weinshenker & Sibley 1992). However, the EDSS is non linear, with
differences in duration of stay at a given level. Thus, the mean duration of stay at EDSS 4.0 to
5.0 is short (1.22-1.25 years) compared to that at EDSS 6.0 and 7.0 (3.06-3.77 years)
(Weinshenker a/., 1991).
While the outcome of MS is notoriously difficult to predict, a number of clinical and
demographic factors are, to an extent, predictors of clinical outcome. Favourable factors include
an age of onset less than 40 years, female sex, optic neuritis or sensory symptoms at onset, a
relapsing remitting course and low relapse frequency. Unfavourable variables are age of onset
relapse frequency (Wynn et al, 1990; Weinshenker et al, 1991; Runmarker et al, 1994).
Disability status at 5 years is moderately predictive of the future prognosis (Kurtzke et al, 1977;
Miller et al, 1992). Multivariate mathematical models have been designed to identify those
factors that are predictive for various clinical endpoints (Weinshenker et al, 1991; Runmarker
et al, 1994), but even with such multifactorial modelling, predictive accuracy at an individual
level is poor.
1.1,7 Diagnosis o f M S
MS is diagnosed primarily on clinical grounds, rather than from the results of paraclinical
investigation in isolation. Confident diagnosis relies on demonstration of clinically disseminated
CNS white matter lesions in both time and space, in the absence of features suggesting an
alternative diagnosis. The differential diagnosis includes other inflammatory CNS disorders that
can produce multifocal CNS lesions, examples including systemic lupus erythematosis,
polyarteritis nodosa, isolated angiitis of the CNS, sarcoidosis, Sjogren’s syndrome and Lyme
disease.
Where clinical assessment does not suggest an alternative diagnosis but is insufficient to prove
temporal and spatial dissemination, paraclinical studies may be performed in order to increase
diagnostic confidence. The major paraclinical tools are CSF examination, evoked potentials and
neuroimaging. CSF examination can be used to demonstrate evidence of CNS inflammation. The
measurement of CSF IgG alone is of limited usefulness, since its level may be influenced by
serum IgG concentration, blood brain barrier dysfunction and CSF turnover. In order to correct
for such variables, an IgG index is used. The demonstration of unique CSF oligoclonal bands is
also used to increase diagnostic confidence. The diagnostic sensitivity of the IgG index and
Evoked potentials can provide evidence of spatial dissemination, where lesions are clinically
silent. Demonstration of such lesions can be used to confirm a diagnosis of MS according to the
Poser criteria (Table 1.2). Visual evoked potentials (VBPs) are abnormal in most patients with
a clear history of optic neuritis (Chiappa 1990). Even where there is no clinical evidence for optic
neuritis, VEPs are abnormal in over 50% of cases in established MS (Chiappa 1990).
Somatosensory evoked potentials and brain stem auditory evoked potentials are also used to
provide evidence of more widespread dissemination, and multimodal evoked potentials may
increase the sensitivity compared to single evoked potential studies (Chiappa 1990).
However, it is MRI that is now established as the most valuable investigation in supporting and
making more certain the diagnosis of MS. The demonstration of disseminated lesions in space
can upgrade the diagnosis from clinically probable to clinically definite MS using the Poser
criteria (Table 1.2).
After a basic review of MRI physics, the roles of MRI in diagnosis, as a prognostic tool and in
developing a greater understanding of the natural history of the disease will be reviewed. The
remainder of this chapter will then focus on the utility of MRI as an outcome measure in MS
clinical trials.
1.2 MRI in multiple sclerosis
1.2.1 Technical background
The basic principles of nuclear magnetic resonance (NMR) were first described in 1946 (Bloch
et al, 1946; Purcell et al, 1946). Initial applications were confined to the realms of chemistry
and physics, and it wasn't until 1973 that the first image of an object was published (Lauterbur
since then the role of MRI has expanded explosively.
NMR depends on an interaction between an ‘MR active’ atomic nucleus, an external magnetic
field and an applied radio frequency electromagnetic field. Such nuclei are characterised by
possession of an odd number of protons, and the most abundant of these in organic matter is
hydrogen, predominantly as constituent atoms of water and lipid molecules. The hydrogen
nucleus comprises a single proton. The combination of the proton’s positive charge and spin
results in a nuclear magnetic moment. In the absence of an applied external magnetic field, the
axes of the protons’ spins are randomly aligned and there is no net magnetic moment. However,
when exposed to a static applied external magnetic field (called B J, hydrogen nuclei align
themselves either parallel and antiparallel to that field. A tiny excess of hydrogen nuclei aligns
parallel and this results in a net magnetic moment (MJ, aligned along the axis of (Figure 1.2).
The spin axes of the hydrogen nuclei rotate around the field lines of the applied magnetic field
(BJ; this is termed precession (Figure 1.3).
The precession frequency is governed by the Larmor equation:
© o =
where: co = Larmor frequency
Y = gyromagnetic ratio, which is a constant for a given nucleus
If a radiofrequency (RF) pulse is applied that is polarised to B^ at an angle of 90° with the correct
Alignment in field to give M Random alignment of Hydrogen nuclei
(b)
Figure 1.2 (a) Random alignment of Hydrogen Nuclei in absence of a magnetic field and
(b) net magnetic field (M J created by B^.
Precession
Magnetic moment of nucleus
Hydrogen nucleus
resonance is that the net magnetic vector moves out of alignment away from The angle to
which the net magnetic vector moves out of alignment is termed the flip angle. A 90” RF pulse
will tip the net vector through an angle of 90”, causing the hydrogen nuclei to process in phase
(phase coherence). The component of the rotating net magnetic vector in the transverse plane
induces an electric current in a receiver coil or antenna. Therefore, as the net magnetic vector
processes at the Larmor frequency in the transverse plane (at 90” to the direction), a voltage
is induced in the coil, which in turn produces the signal from which MR images or spectra may
be formed.
When the RF pulse is turned off, the protons return to their equilibrium position aligned with B^.
Two events occur in this process; the first is an increase in “longitudinal” magnetisation as
hydrogen nuclei return to realign with B^. This process is known as longitudinal relaxation and
requires transfer of energy from the hydrogen nuclei to the immediate environment or lattice. The
rate of recovery is an exponential process, with a recovery time constant called T, (Figure 1.4).
The second process is a decrease in the transverse net magnetic vector as hydrogen nuclei begin
to process out of phase with one another. This decay occurs via an interaction with adjacent
atoms and is termed spin spin relaxation. This also occurs as an exponential process, defined by
the Tj relaxation time (Figure 1.5).
Both T, and Tj relaxation times depend on the chemical environment of the hydrogen nuclei. T,
is typically much longer than T2 (300-2000 ms versus 30-150 ms) at typical clinical field
strengths. For water, both Tj and Tj are long, whereas lipids have much shorter Tj and T2. Such
o %
c/a
T i m e
Figure 1.4 The T, relaxation curve after a 90° pulse
( 3
O
<u
C O s
§
$ - 1
T i m e
1.2.1.1 Spin Echo imaging
The frequency, power and duration of RF pulses can be variously manipulated to produce
specific effects on protons. The combination of a 90° pulse followed by a 180° pulse is termed
a spin echo sequence (Figure 1.6), and this is the most commonly used sequence. Following a
90° pulse, protons are tipped into the xy plane and they precess in phase. This generates a
detectable transverse magnetic field. However, signal immediately begins to decline due to a
combination of Tj decay and dephasing due to external magnetic field inhomogeneity, the so-
called Tj* or free induction decay (FID). After a delay, termed the echo time (TE), a 180° pulse
is applied. This rotates the protons’ magnetic moments through 180°, reversing the direction of
precession. Thus there is a return of all the transverse magnetisation that was lost due to T2*
effects, and an “echo” is generated. Therefore, the amplitude of the resulting echo is dependent
primarily on Tj relaxation. Generation of an image requires several repetitions of the spin echo
sequence, with the time between successive 90° pulses termed the repetition time (TR).
180 180
RF p u lse
TE
TR
N M R S ig n a l
E ch o FID E ch o
FID
Manipulation of both the TR and TE allows images to be generated with contrast dependant on
varying degrees of T,, Tj or proton density (PD) characteristics. Weighting refers to the type of
contrast that dominates an image. With a short TR, those protons with longer Tj will not have
returned to align along before the next excitation. The combination of a short TR with a short
TE produces an image that is T, weighted, those tissues with a long Tj appearing dark and those
with a shorter Tj appearing bright. The combination of a long TR with a short TE generates a PD
weighted image, where contrast is less dependent on either T, or Tj. With both a long TR and
TE, those protons with a short Tj dephase to a greater degree than those with a longer Tj,
yielding a Tj weighted image, where tissues with short T^ appear dark relative to those of a
longer T^.
1.2.1.2 Spatial localisation
Localisation of the MR signal is required for image generation. This is achieved through the
modification of the external magnetic field by the application of magnetic field gradients. The
application of a slice selection gradient along the z axis allows selective excitation of a particular
xy slice according, to the frequency of the RF pulse used. This allows localisation of signal along
the z axis.
A similar approach is used to allow localisation along the x axis. Thus, a frequency encoding
gradient is applied perpendicular to the slice select gradient, allowing spatial localisation along
the X axis. To encode spatial information along the y axis requires a phase encoding gradient.
This gradient is applied only briefly to alter the phase, but not the frequency, of the derived
signal. The stronger the phase encoding gradient, the greater the difference in phase angle along
1.2.1.3 Techniques fo r 7^ weighted imaging
With conventional spin echo (CSE) imaging, a two-feature approach is adopted, using the early
and late echos to generate proton density (PD) and T2 weighted images, respectively. One line
of k-space is acquired per TR, which is usually within the range of 2000 to 3000 msec. K-space
is where the raw data of spatially encoded MR signals is collected during application of magnetic
field gradients. In CSE imaging, one line of k-space is encoded per TR interval, and the pulse
sequence is repeated typically 128 or 256 times (phase encodings) per image. Typically, TEs of
25 to 50 msec for PD weighting and 80 to 120 msec for Tj weighting are used. The exact
parameters will depend to an extent on scanner field strength, since while Tg is virtually field
strength independent, T, is positively correlated with field strength. Therefore, to obtain similar
CSF suppression across different Tesla imagers (a Tj effect on PD weighted images), the TR is
lower for low-field strength machines (Filippi et al, 1997a). MS lesions appear hyper-intense
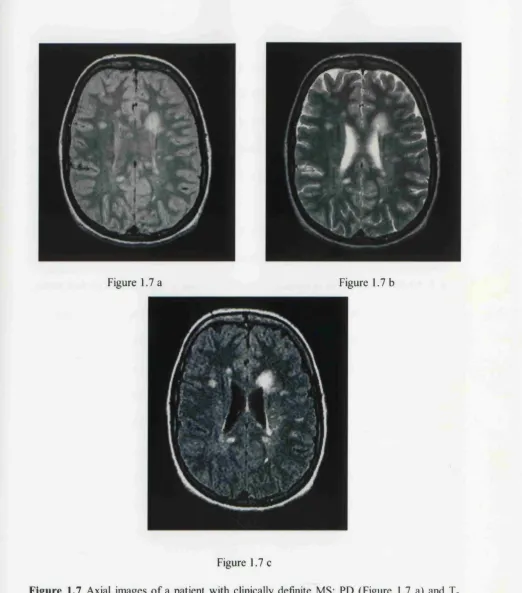
relative to background white matter on both PD and T2 weighted images (Figure 1.7) by virtue
of their higher water content.
More recently, fast spin echo (FSE) imaging has become increasingly used. The FSE sequence
is based on the rapid acquisition with relaxation enhancement (RARE) sequence (Hennig et al,
1986; Hennig et al, 1988). With FSE imaging, multiple phase encodings are performed in each
TR and multiple echoes per TR are acquired. Therefore, instead of a single line of k-space per
TR interval, fi*om 2 to 16 or more lines are encoded per TR, resulting in a considerable reduction
in acquisition time in proportion to the number of echoes collected.
Although the FSE sequence produces images that are broadly similar to a corresponding CSE
,/m.
Figure 1.7 a Figure 1.7 b
l i # #
Figure 1.7 c
Figure 1.7 Axial images of a patient with clinically definite MS; PD (Figure 1.7 a) and Tj
weighted (Figure 1.7 b) images from a dual echo CSE sequence, and corresponding fast FLAIR
image (Figure 1.7 c). Several periventricular and discrete white matter lesions are demonstrated
with all three sequences. Note the CSF suppression with the fast FLAIR sequence.
The FSE sequence may produce increased signal at tissue interfaces (for example, in
periventricular regions), making detection of MS lesions in this region more difficult (Bastienello
et al, 1997; Thorpe et al, 1994). It may also be less sensitive in detecting small lesions due to
point spread function effects (Constable & Gore 1992). This latter effect describes the blurring
that can occur in the phase encoding direction due to the collection of different lines of k-space
at different times, obscuring detection of small lesions.
While long TR long TE sequences offer a higher level of contrast between lesions and white
matter (determined by Tj mechanisms), an undesirable consequence is reduced lesion-to-CSF
contrast, making identification of periventricular and subcortical lesions more difficult (Figure
1.7). The high CSF signal can be suppressed by application of a 180° inversion pulse, with an
appropriately long inversion time (TI) before each excitation pulse, thereby allowing longer TEs
while at the same time suppressing CSF signal (De Coene et al, 1992; Thorpe et al, 1994). This
is known as the fluid attenuated inversion recovery (FLAIR) sequence, and increases the number
of MR visible lesions (White et al, 1992; De Coene et al, 1993). However, the long Tls and TRs
required demand longer acquisition times with a standard FLAIR sequence. More recently, the
inversion pulse has been combined with an FSE pulse sequence to produce the fast FLAIR
sequence (Figure 1.7). This sequence can acquire 36 slices of 5 mm slice thickness in just over
5 minutes (Rydberg et al, 1994).
1.2.2 MRI in diagnosis
The major utility of MRI in the diagnosis of MS is the ability to visualise a large extent of
clinically silent pathology; as a tool for demonstrating spatial dissemination of disease, MRI is
unrivalled. In clinically definite MS, brain lesions are seen in up to 99% of patients (Ormerod
vast majority of MS lesions are hyper-intense on both PD and Tj weighted images. Such signal
characteristics may also be found in ischaemia and neoplastic disease. Furthermore, small foci
of hyper-intensity are a common incidental MRI finding in normal subjects, especially with
increasing age. Various features of lesion morphology and distribution have been identified as
potentially more specific to MS. The lesions seen in MS are typically irregular in shape, although
an ovoid appearance is also characteristic (Horowitz et al, 1989). This has been attributed to
perivascular extension of the pathological processes along straight medullary venules. Lesions
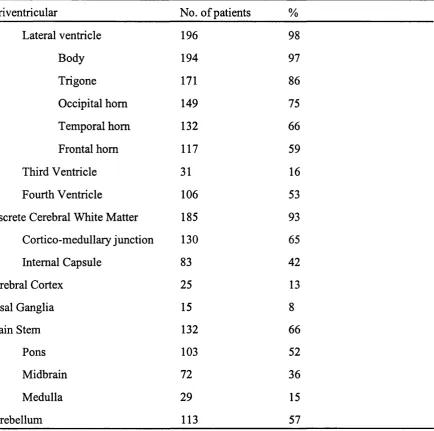
have a periventricular predominance (Table 1.4), with a tendency to be orientated perpendicular
to the ventricular walls, corresponding to the pathologists eponym of Dawson's fingers (Fazekas
et al, 1998). Common locations are adjacent to the body and trigone of the lateral ventricles, the
floor of the fourth ventricle and cerebellar peduncles.
Discrete white matter lesions are also typically seen, and a cortical/subcortical or juxtracortical
location is another characteristic of MS plaques (Barkhof et al, 1997a). Involvement of the
subcortical U-fibres is less commonly identified in subcortical arteriosclerotic encephalopathy
(Révèsz et al, 1989). Sagittal imaging has emphasised the specificity of lesions located in the
corpus callosum (Simon et al, 1986; Gean-Marton et al, 1991), and thin section fast FLAIR
may further improve the detection of abnormalities in the corpus callosum (Hashemi et al,
1995). Lesions are less commonly seen in the basal ganglia in MS than cerebrovascular disease,
Periventricular No. of patients %
Lateral ventricle 196 98
Body 194 97
Trigone 171 86
Occipital horn 149 75
Temporal horn 132 66
Frontal horn 117 59
Third Ventricle 31 16
Fourth Ventricle 106 53
Discrete Cerebral White Matter 185 93
Cortico-medullary junction 130 65
Internal Capsule 83 42
Cerebral Cortex 25 13
Basal Ganglia 15 8
Brain Stem 132 66
Pons 103 52
Midbrain 72 36
Medulla 29 15
Cerebellum 113 57
Table 1.4 The distribution of brain MRI abnormalities in 200 patients with clinically definite MS
(from Miller 1988)
In order to improve the specificity of MR in the diagnosis of MS, two research groups have
developed criteria based on the pattern of lesion distribution (Table 1.5, Paty et al 1988; Fazekas
et al, 1988). A study to validate these criteria demonstrated higher specificity for the criteria of
Fazekas et al (96%) than those of Paty et al (92%) at the expense of lower sensitivity (81%
specific in older patients due to difficulties in differentiating MS lesions from those due to
subcortical arteriosclerotic encephalopathy.
Paty’s (from Paty et al, 1988)
Fazeka’s (from Fazekas et al. 1988)
Four or more lesions, or three lesions, one
of which is periventricular
Three or more lesions, with at least two of
the following properties:
(i) inffatentorial
(ii) periventricular
(iii) ^ 6 mm
Table 1.5. Diagnostic MRI criteria strongly suggesting MS
The potential role of gadolinium-diethylene-triaminepenta-acetic acid (gd-DPTA, or gadolinium)
enhanced imaging as a diagnostic tool has also been suggested. Since gadolinium enhancement
is a temporary phenomenon, the co-existence of longstanding (non enhancing) lesions with acute
(enhancing) lesions may improve diagnostic specificity (Tas et a l, 1995). A recent study
examined the contribution of various MRI features in predicting conversion to MS after a
clinically isolated syndrome (Barkhof et al, 1997a). Of the various parameters included, only
gadolinium enhancement and the presence of juxtacortical lesions provided independent
information of predictive value.
Spinal cord involvement may also be useful in supporting a diagnosis of MS. Using phased array
patients with MS (Kidd et al, 1993). Furthermore, a high proportion of patients with suspected
MS but without cerebral lesions will have abnormalities on spinal MRI (Thorpe et al, 1996a;
O’Riordan et al, 1998). It has been suggested that the combination of brain and spinal cord MRI
might increase the sensitivity for MS to nearly 100% (Thorpe et al, 1996a).
1.2.3 MRI natural history studies in understanding disease evolution
Serial studies of MS patients have provided important insights into the dynamics and
pathogenesis of the disease process. Early studies using T2 weighted imaging showed that new
areas of hyper-intensity were frequently observed in the absence of clinically expressed activity,
occurring up to five times as frequently as relapses (Isaac et al, 1988; Willoughby et al, 1989).
1.2.3.1 Gadolinium enhanced imaging
Studies incorporating gadolinium enhanced sequences have demonstrated that enhancement is
an early event in most new T^ lesions in patients with both relapsing remitting and secondary
progressive MS, often preceding the appearance of a Tj lesion (Kermode et al, 1990a; Kermode
et al, 1990b).
Gadolinium does not normally cross the blood brain barrier in cerebral white matter. The results
of studies of both EAE (Hawkins et al, 1990; Hawkins et al, 1991) and post mortem work (Katz
et al, 1993) have suggested that gadolinium enhancement is precipitated by alteration of the blood brain barrier in association with an acute inflammatory response. The duration of
enhancement of MS lesions is typically 3-6 weeks; more than 75% of enhancing lesions show
enhancement for ^1 month (Smith et al, 1993). About 20% of lesions enhance beyond one
month, with about 5% showing persistent enhancement up to 3-4 months. Early in the period of
expands to involve an area larger than the region of gadolinium enhancement, probably reflecting
the presence of surrounding vasogenic oedema. As gadolinium enhancement ceases, the size of
the Tj abnormality decreases to leave a smaller T2 ’scar'. Early work suggested that many such
? 2 lesions disappear altogether (Willoughby et al, 1989), but studies at higher field strength and
with thinner slices indicate that a residual, albeit small T2 abnormality almost invariably persists
(Thompson et al., 1991). Therefore, with ongoing enhancing lesion activity, the total area of
abnormal hyper-intensity on T2 scans increases over time.
Gadolinium enhancement occurs with about ten times the frequency of clinical relapse in both
relapsing remitting and secondary progressive MS (Thompson et ai, 1991). Enhancement in a
clinically eloquent site such as the optic nerve has been correlated with reversible clinical deficit
(Youl et al, 1991). Furthermore, enhancing lesions occur more often during clinical relapse than
remission, and correlations between gadolinium enhanced MRI and clinical activity have also
been demonstrated in several studies (Grossman et al, 1986; Willoughby et al, 1989;
Bastienello e/fl/., 1990; Kermode a/., 1990a; Miller e/a/., 1993; Smith er a/., 1993; Thorpe
et al, 1996b). Monosymptomatic relapses are frequently associated with multiple new areas of
gadolinium enhancement.
A study using gadolinium enhanced MRI and evoked potentials in patients presenting with optic
neuritis has provided important insights into the mechanisms underlying relapse and remission
(Youl et al, 1991). Ten patients presenting with optic neuritis were studied within two weeks
of symptom onset. All of the affected nerves showed initial gadolinium enhancement. However,
one month later, all but two had ceased to enhance. A marked reduction in VEP amplitude and
increase in latency was found at the time of gadolinium enhancement, signifying both conduction
amplitude of the evoked potential and visual acuity improved. These observations suggest that;
(i) the clinical features of optic neuritis are associated with inflammation as assessed by MRI,
(ii) clinical recovery can occur without remyelination, as suggested by functional recovery in the
face of persistent conduction delay, and (iii) inflammation plays an important role in production
of symptoms. These observations are supported by the often rapid clinical improvement
associated with administration of corticosteroids. The mechanisms through which conduction
block is induced by acute inflammation are as yet not well defined, but one possibility is that
cytokine release may compromise sodium channel function (Brosnan et al, 1989).
1.2.3.2 T2 weighted imaging
While gadolinium enhancement is widely recognised to be associated with BBB breakdown and
inflammation, the conventional Tj weighted sequence has poor specificity in discriminating the
different elements of the pathological process (acute inflammation with oedema, demyelination,
axonal loss, gliosis, remyelination). With such a sequence, areas of high signal white matter are
a consequence of increased water content and change in Tj relaxation time, that can potentially
result from a number of pathological processes. Chronic MS lesions are pathologically
heterogenous, ranging from those with relative preservation of axons (gliotic lesions) to those
with an expanded extracellular space and extensive axonal loss. Serial Tj weighted imaging can
be used to document the accumulation of high signal abnormality over time, but the sequence
gives no indication about the integrity of myelin or axons. Other MRI techniques with greater
pathological specificity are needed in order to elucidate the mechanisms underlying the
1.2.3.3 Serial Studies in MS subgroups
Several longitudinal studies, detailed below, have incorporated a frequent MRI scanning
protocol, providing important insights into the dynamics of different MS subgroups and
highlighting marked differences between subgroups in terms of activity profile.
Serial studies of patients with benign MS have shown that this subgroup is less active on MRI
than patients with early relapsing remitting MS (Thompson et al, 1992; Kidd et al, 1994).
Furthermore, only a third of new lesions display enhancement with gadolinium, suggesting that
those lesions that do occur may be less inflammatory (Thompson et al, 1992).
Studies of patients with relapsing remitting MS have demonstrated that MRI activity on both
enhanced and unenhanced sequences occurs more frequently than clinical relapse (Isaac et al,
1988; Willoughby et al, 1989; Harris et al, 1991; Barkhof et al, 1992; Smith et al, 1993; Frank
et al, 1994; Kidd et al, 1996; Thorpe et al, 1996b). However, there are wide inter individual
differences in the level of activity demonstrated on serial MRI. Furthermore, there is substantial
month to month variation in the number of enhancing lesions detected. Bursts of MRI activity
have been found in association with new clinical activity (Frank et al, 1994), but no predictable
pattern of enhancement has been identified.
The degree of MRI activity in secondary progressive patients is also subject to substantial
differences between individuals. Serial studies have indicated that the level of enhancement in
this subgroup is broadly similar to that of relapsing remitting patients (Thompson et al, 1991;
Tubridy et al, 1998a). However, a lower level of MRI activity has been identified in those
secondary progressive patients without ongoing relapses in comparison with those continuing
MRI studies investigating primary progressive multiple sclerosis have shown clear differences
in comparison with the other MS subgroups (Thompson et al, 1997). Cross sectional studies
have demonstrated that the level of cerebral abnormality in this subgroup is smaller than that
identified in benign and secondary progressive MS (Thompson et al, 1990; Filippi et al, 1995a),
despite marked disability. Furthermore, longitudinal studies have shown that (i) fewer new
lesions occur over time in primary progressive MS and (ii) those lesions that do occur are less
likely to demonstrate gadolinium enhancement (Thompson et al, 1991). Even using a triple dose
of gadolinium to increase sensitivity, few enhancing lesions are seen (Silver et al, 1997). This
suggests that lesions in primary progressive MS may be of a less inflammatory nature than those
in other MS subgroups, a finding further supported by post mortem work (Révèsz et al, 1994).
1.2.4 The prognostic utility o f MRI in clinically isolated syndromes
In more than 90% of patients who subsequently develop MS, clinical presentation is with an
acute neurological disturbance with subsequent remission. This initial episode typically involves
the optic nerves, brain stem or spinal cord. Several studies have reported the MRI findings of
patients presenting with such clinically isolated syndromes and defined their predictive value for
subsequent development of multiple sclerosis (Beck et al, 1993; Morissey et al, 1993). Where
first presentation is with optic neuritis, conventional MRI reveals clinically silent white matter
lesions in 50-70% of patients. Where an alternative diagnosis has been excluded, a similar
proportion of patients presenting with isolated syndromes of the brain stem and spinal cord also
demonstrate such lesions. Based on five years of follow up, one study found that if four or more
lesions are identified at presentation, the positive predictive value of conversion to definite MS
was 65%, while the negative predictive value of a normal brain scan at presentation is 97%
(Morrissey et al, 1993). Another study on patients presenting with optic neuritis (Beck et al,