International Journal of Nanomedicine
Dove
press
O r I g I N a l r e s e a r c h
open access to scientific and medical research
Open access Full Text article
comparison of process parameter optimization
using different designs in nanoemulsion-based
formulation for transdermal delivery of fullerene
cheng loong Ngan1
Mahiran Basri1,2
Fui Fang lye1
hamid reza Fard Masoumi1
Minaketan Tripathy3,4
roghayeh abedi Karjiban1
emilia abdul-Malek1
1Department of chemistry, Faculty
of science, 2halal Products research
Institute, Universiti Putra Malaysia, selangor, Malaysia; 3laboratory
of Fundamentals of Pharmaceutics, Faculty of Pharmacy, Puncak alam campus, Universiti Teknologi Mara, selangor, Malaysia; 4Brain and
Neuroscience communities of research, Universiti Teknologi Mara, selangor, Malaysia
correspondence: Mahiran Basri; cheng loong Ngan
Department of chemistry, Faculty of science, Universiti Putra Malaysia, 43400 UPM serdang, selangor, Malaysia Tel +60 389 467 266
Fax +60 389 466 997 email [email protected]; [email protected]
Abstract: This research aims to formulate and to optimize a nanoemulsion-based formulation containing fullerene, an antioxidant, stabilized by a low amount of mixed surfactants using high shear and the ultrasonic emulsification method for transdermal delivery. Process parameters optimization of fullerene nanoemulsions was done by employing response surface methodol-ogy, which involved statistical multivariate analysis. Optimization of independent variables was investigated using experimental design based on Box–Behnken design and central composite rotatable design. An investigation on the effect of the homogenization rate (4,000–5,000 rpm), sonication amplitude (20%–60%), and sonication time (30–150 seconds) on the particle size, ζ-potential, and viscosity of the colloidal systems was conducted. Under the optimum conditions, the central composite rotatable design model suggested the response variables for particle size, ζ-potential, and viscosity of the fullerene nanoemulsion were 152.5 nm, -52.6 mV, and 44.6 pascal seconds, respectively. In contrast, the Box–Behnken design model proposed that preparation under the optimum condition would produce nanoemulsion with particle size,
ζ-potential, and viscosity of 148.5 nm, -55.2 mV, and 39.9 pascal seconds, respectively. The suggested process parameters to obtain optimum formulation by both models yielded actual response values similar to the predicted values with residual standard error of 2%. The opti-mum formulation showed more elastic and solid-like characteristics due to the existence of a large linear viscoelastic region.
Keywords: nanoemulsion, palm kernel oil ester, fullerene, central composite rotatable design, Box–Behnken design, response surface methodology
Introduction
Fullerene (C60), the third member in the carbon allotrope line-up, is a truncated icosa-hedron sp2-hybridized carbon molecule with 30 carbon–carbon double bonds (C=C). It
is widely known for its capability in scavenging free radicals through multiple addition reactions that occur momentarily in the presence of radicals.1,2 In the past couple of
years, researchers have been actively exploiting fullerene due to its excellent antioxidant activity. This brings promising medicinal benefits as a remedy or therapy in various health illnesses, such as cancer, neurodegenerative disorders, allergies, and many more.3–5 Another advantage is that pristine fullerene is nontoxic to a large variety of
living organisms, including human.6 Furthermore, there is an immense interest to further
employ fullerene in the cosmetic and cosmeceutical industries as an antioxidant.7–9
Despite its vast advantages, fullerene is insoluble in water, which makes it more challenging to incorporate into pharmaceutical and cosmetic products. Hence, efforts to modify the surface of the molecules into functionalized fullerene have been reported.10 However, engineered fullerene derivatives can be highly toxic.6
Journal name: International Journal of Nanomedicine Journal Designation: Original Research
Year: 2014 Volume: 9
Running head verso: Ngan et al
Running head recto: Comparison of process parameter optimization DOI: http://dx.doi.org/10.2147/IJN.S65689
International Journal of Nanomedicine downloaded from https://www.dovepress.com/ by 118.70.13.36 on 23-Aug-2020
For personal use only.
This article was published in the following Dove Press journal: International Journal of Nanomedicine
15 September 2014
Dovepress Ngan et al
An alternative route of application was identified where oil was used as a biocompatible carrier for fullerene.11
To improve the solubility and bioavailability of fuller-ene, a suitable carrier system comprised of oil should be developed. Wax esters emerge as the key ingredient in cosmeceutical industries, due to their excellent wetting behavior at interfaces and a nongreasy feeling upon applica-tion on the skin surfaces.12,13 This offers a potential solution
to formulate an emulsion system to deliver fullerene in an effective way.
Nanotechnology has been explored due to its potential to revolutionize the cosmetic and cosmeceutical industries. Nanoemulsion-based cosmeceuticals have improved effi-cacy; whereby, the active ingredient will have better skin penetration and a higher rate in successful drug delivery to the target site due to its small particle size. Besides, the long-term colloidal stability of nanoemulsions can be achieved through high ζ-potential due to the increase of the repulsive force between droplets. Nanoemulsion is a non-equilibrium colloidal system where oil phase is dispersed as fine droplets, usually with particle size from 20–200 nm, throughout the aqueous phase stabilized by surfactants.14
Nanoemulsions can be prepared by high-energy emulsifica-tion or by low-energy emulsificaemulsifica-tion methods.15 However,
nanoemulsions are thermodynamically unstable colloidal systems that are highly dependent on their physicochemical properties, usually based on the preparation method.14 Thus,
a precise preparation method is necessary to avoid over-processing, which will be a waste of time and cost. Process parameters that involved the controlling of the energy input of homogenizers and process time could be a deciding point to acquire ideal characteristics. However, combinations of emulsification methods are often applied, and an investiga-tion on each influence individually (the univariate approach) can be a tedious task.
These process variables influence the outcome of the responses in different manner where interaction between variables may even occur. Response surface methodology (RSM) is a powerful statistical tool that executes effectively in a multivariate way to study the relationships between independent and response variables. Based on mathemati-cal principles, the optimization of certain processes can be achieved easily by setting the desirable parameters. Moreover, the minimum number of experimental runs will be conducted to fully assess the effect of independent variables and their interactions between variables on the selected responses.16
The aim of this study was to investigate the influence of process parameters – homogenization rate, sonication
amplitude, and sonication time – on the physicochemical properties (particle size, ζ-potential, and viscosity) of fuller-ene nanoemulsions using RSM with two different designs. The comparison between Box–Behnken design (BBD) and central composite rotatable design (CCRD) was analyzed for the purpose of optimizing the condition to obtain desirable responses, such as small particle size and high ζ-potential. Fullerene solubilized in palm kernel oil esters was used to for-mulate an oil-in-water nanoemulsion system. An amplitude sweep test was carried out on the optimum formulations to find out the rheological characteristics that can be correlated with the nanoemulsions stability.
Materials and methods
Materials
Fullerene, with a purity of 99.5%, was purchased from Sigma-Aldrich (St Louis, MO, USA). Nonionic surfactants, polyoxyethylene sorbitan monooleate (T80), viscous liquid, and sorbitan monooleate (S80) were from Sigma-Aldrich. Xanthan gum from Xanthomonas campestris and white beeswax, bleached, were obtained from Sigma-Aldrich. Phenonip, preservative, was purchased from Bramble Berry (Bellingham, WA, USA). Palm kernel oil esters (PKOEs) were synthesized in our laboratory through the enzymatic transesterification of palm kernel oil and oleyl alcohol using Lipozyme RM IM as the catalyst.13 Deionized water was
purified using the Milli-Q water system (EMD Millipore, Billerica, MA, USA).
Fullerene nanoemulsions preparation
Formulations containing fullerene were prepared using a combination of high-energy emulsification techniques – high shear homogenization and ultrasonic dispersion. Fullerene was fully dissolved in PKOEs (160 μg/g) using a magnetic stirrer. The oil phase, which was composed of fullerene, 12.5% (weight/weight [w/w]) PKOEs, 1.0% (w/w) beeswax, and 0.7% (w/w) phenonip, and the aqueous phase, 7.7% (w/w) T80:S80 (4:1), 0.9% (w/w) xanthan gum, and deion-ized water, was stirred separately while heating at 75.0°C to dissolve all the ingredients completely. Phenonip was added into the formulations as an antimicrobial agent. Fullerene nanoemulsions (100 g) were prepared by adding an aqueous phase slowly into the oil phase while homogenized using Polytron high shear homogenizer (PT3100; Kinematica AG, Lucerne, Switzerland) at room temperature (25.0°C±2°C) for 15 minutes. The premixed emulsions were further subjected to ultrasonic dispersion by 24 kHz ultrasonic tip processor (UP400S; Hielscher Ultrasonics GmbH, Teltow, Germany)
International Journal of Nanomedicine downloaded from https://www.dovepress.com/ by 118.70.13.36 on 23-Aug-2020
Dovepress comparison of process parameter optimization
with a maximum power output of 400 W. The titanium probe tip of 14 mm diameter and 100 mm length was submerged into the emulsions while sonicated at specific amplitude (alternating on–off every 1 second). Samples were immersed in an ice bath to mitigate the ultrasound thermal effect. High shear homogenization rate, sonication amplitude, and time were varied, according to the experimental design.
Particle size and ζ-potential
determination
The particle size and ζ-potential were determined using a dynamic light scattering droplet size analyzer (Malvern Zetasizer Nano ZS90; Malvern Instruments, Malvern, UK) equipped with an argon laser (λ =488 nm). The measurement was performed with an angle of 173° at room temperature (25.0°C±0.5°C). The samples were diluted (1:200) with deionized water to avoid multiple scattering effects. Then, they were filled into the zeta disposable cells. The diluted fullerene nanoemulsions were filled into the capillary cell, using the 3 mL syringe to avoid the presence of air bubbles before inserted into the module. For optimization measure-ment, the instrument was equilibrated for 120 seconds to the acquired stable temperature. For data analysis, each sample was analyzed twice after 24 hours of sample preparation; each analysis consisting of five replicates and the measurements were reported as average for each analysis.
Viscosity measurement
The viscosity of colloidal systems was measured using a dynamic shear rheometer (Kinexus Rotational Rheometer; Malvern Instruments, Malvern, UK) at a fixed shear rate of 0.1 seconds-1 at 298 K. The measurements were performed
within 24 hours after sample preparation using cone and plate geometry (4°/40 mm), the gap being set at 0.15 mm. Samples were loaded and left for 5 minutes to equilibrate, before carrying out the measurement. The viscosity of each sample was recorded in pascal seconds (Pa·s) at an interval of 5 seconds until 60 data points were generated, and the average viscosity value was calculated.
rheological characterization
Oscillatory strain sweep analysis was run on the optimum for-mulation at different strain amplitudes from 1%–1,000% using the dynamic shear rheometer. The rheometer was equipped with cone and plate geometry (4°/40 mm). Measurements were performed at 25.0°C±0.1°C. Dynamic oscillatory experiments were done to identify the storage (elastic) (G′) and the loss (viscous) modulus (G″) at a fixed frequency
of 1 Hz to acquire a linear viscoelastic region (LVR). This region is referring to the region where the G′ is independent of applied shear stress up to the critical strain value (γc). This test is able to analyze the viscoelasticity of a specific microscopic architectural material.
experimental design
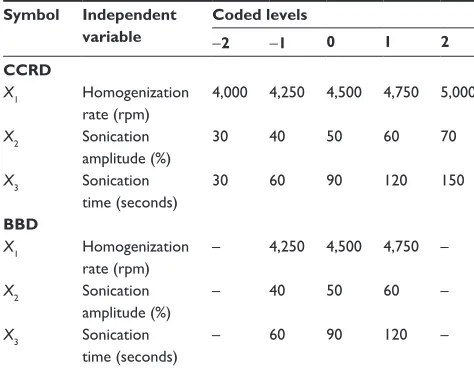
RSM was employed to study the process parameters of the independent variables: homogenization rate (X1); sonication amplitude (X2); and sonication time (X3), on the particle size (Y1), ζ-potential (Y2), and viscosity (Y3) of the nanoemulsions. The experiments were approached using two different designs as a comparison between the CCRD and BBD. The coded independent variables in both of the designs are shown in Table 1. The total number of runs was generated by Design Expert version 6.0.6 by Stat-Ease Inc. (Minneapolis, MN, USA). The design matrix was created, and the results were statistically ana-lyzed, which were then converted into a response surface.
The designs were evaluated separately based on the influ-ence of process variables in the modeling of the emulsion particle size, ζ-potential, and viscosity. Each design was expressed by second-order polynomial regression equation to generate the model shown below,
Yi= β0+β1X1+β2X2+β3X3+β11X12+β22X22+
β33X32+β12X1X2+β13X1X3+β23X2X3
(1)
Design Expert software was used to obtain the combi-nation of values that illustrate the response surface model. Experiments were run in a randomized order to avoid ques-tionable variability that affects the outcome of the response
Table 1 coded independent variables used in rsM design
Symbol Independent
variable
Coded levels
-2 -1 0 1 2
CCRD
X1 homogenization rate (rpm)
4,000 4,250 4,500 4,750 5,000
X2 sonication amplitude (%)
30 40 50 60 70
X3 sonication
time (seconds)
30 60 90 120 150
BBD
X1 homogenization rate (rpm)
– 4,250 4,500 4,750 –
X2 sonication amplitude (%)
– 40 50 60 –
X3 sonication time (seconds)
– 60 90 120 –
Abbreviations: rsM, response surface methodology; ccrD, central composite rotatable design; BBD, Box–Behnken design.
International Journal of Nanomedicine downloaded from https://www.dovepress.com/ by 118.70.13.36 on 23-Aug-2020
Dovepress Ngan et al
due to extraneous factors. The center of the experimental field was performed six and five times for CCRD and BBD, respectively.
statistical analysis
The analysis of variance (ANOVA) was performed to deter-mine the significant differences between the independent variables. A reduced model involves statistically significant independent variables (P0.05), which it takes into account. The three-dimensional (3D) surface response and contour plots were constructed to represent the interaction between independent variables and responses. Multiple regressions were applied in analyzing experimental data to predict the coefficients of the fitted second-order polynomial model.
Verification of models
Eight random formulations were prepared to validate the models. Experimental values were compared with the pre-dicted values to check the adequacy of the final reduced models. Recommended optimum process parameters were also performed to verify the optimum response values pre-dicted by the model. Percentage of residual standard error (RSE %) was calculated for each response.
Results and discussion
Model fitting
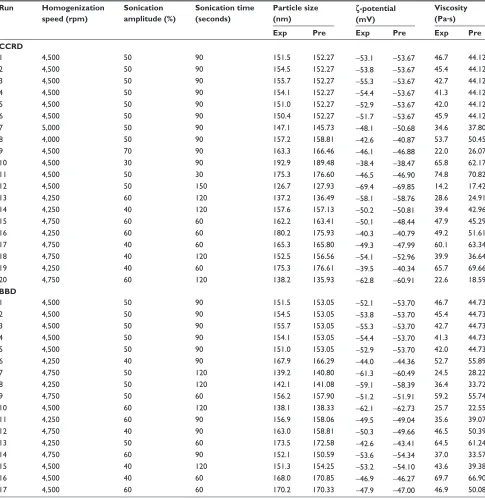
The particle size, ζ-potential, and viscosity of the fullerene nanoemulsions obtained from the experimental design using CCRD and BBD are given in Table 2. Coefficients of the polynomial equation were calculated using experimental values, and the equation was used in the prediction of the response values of the nanoemulsions. The predicted values derived from both designs were consistent with the experi-mental value. Final reduced models for particle size could be represented by the quadratic polynomial equations suggested using ANOVA as shown below,
CCRD: Y1= 152.27 - 3.27 X1 - 5.76 X2 - 12.17 X3 + 6.42X22+ 2.99 X
1X3- 4.56 X2X3 (2)
BBD: Y1= 153.09 - 3.74 X1 - 4.11 X2 - 12.15 X3 + 5.35X22+ 3.60 X
1X3- 3.85 X2X3 (3)
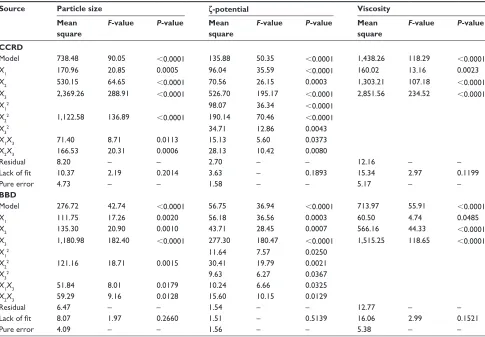
The ANOVA of the resultant quadratic polynomial models for the particle size of fullerene nanoemulsions is shown in Table 3. The significance of the regression coef-ficients was represented by the P-value for a polynomial equation. The smaller P-value indicates higher signifi-cance of the corresponding coefficients. The linear term of
sonication time (P0.0001) had the largest effect on the particle size, followed by the quadric term of sonication amplitude (P0.0001) and linear term of homogenization rate (P0.0001). The interactive effect between the sonica-tion amplitude and time (P0.05), as well as the interactive effect between the homogenization rate and sonication time (P0.05) exhibited a significant effect on the particle size of nanoemulsions. The remaining three interactive effect terms (homogenization rate and sonication amplitude, and the quadric terms of homogenization rate and sonication time) did not show any influence to the particle size of nanoemul-sions. Hence, the insignificant terms were excluded in the final models. Lack of fit value (CCRD =2.19; BBD =1.97) was insignificant, which points to the fact that pure errors such as the experimental error were at their minimum.
While the response for ζ-potential, ANOVA suggested that the quadratic polynomial equations best described the CCRD and BBD. All linear and quadric terms have a signifi-cant effect on ζ-potential of the colloidal system with P-value less than 0.05. The final reduced quadratic models for both experimental designs were demonstrated in the following equations in terms of coded factor.
CCRD: Y1= -53.67 - 2.45 X1 - 2.10 X2 - 5.74 X3
+ 1.97 X12+ 2.75 X
22- 1.18 X32 + 1.38 X1X3 (4)
- 1.87 X2X3
BBD: Y1= -53.70 - 2.65 X1 - 2.34 X2 - 5.89 X3
+ 1.66 X12+ 2.69 X
22- 1.51 X32 + 1.60 X1X3 (5)
- 1.97 X2X3
The ANOVA results and regression analysis were used to fit the models related to ζ-potential with the process parameters (Table 3). Quadratic polynomial models with large F-value and small P-value indicate substantial signifi-cance of the models with a confidence level of 95%. The interaction between the homogenization rate with sonica-tion amplitude and time shows a significant effect on the
ζ-potential (P0.05). Despite the interaction effect between different variables, the linear term of sonication time imposes the largest effect on the ζ-potential with the highest F-value (P0.0001). Since the interactive term between homogeni-zation rate and sonication amplitude gave an insignificant effect, it was excluded from the quadratic polynomial model. The P-value of lack of fit from both models was nonsig-nificant, indicating minimal pure errors which affirmed the fitness of the model.
For both experimental design of CCRD and BBD, linear interaction was suggested by showing the relationship between
International Journal of Nanomedicine downloaded from https://www.dovepress.com/ by 118.70.13.36 on 23-Aug-2020
Dovepress comparison of process parameter optimization
the three independent variables and the viscosity of the system. None of the interactive term was observed in this particular case on the viscosity of the fullerene nanoemulsions. Linear polynomial equation was selected, showing each term was highly significant toward the viscosity as shown here,
CCRD: Y1= 44.12 - 3.16 X1 - 9.03 X2 - 13.35 X3 (6)
BBD: Y1= 44.73 - 2.75 X1 - 8.41 X2 - 13.76 X3 (7)
The linear term of sonication time (P0.0001) stood out from the rest of the terms, showing the highest F-value followed by sonication amplitude (P0.0001) and homog-enization rate (P0.05). This indicated that sonication time has the largest effect on influencing the outcome of the nanoemulsions’ viscosity. No significant interaction effect between the variables was found in this event. Low lack of fit values (CCRD =2.97; BBD =2.99) implied the models
Table 2 Predicted and experimental values of particle size, ζ-potential, and viscosity of fullerene nanoemulsions obtained from ccrD and BBD experimental design
Run Homogenization
speed (rpm)
Sonication amplitude (%)
Sonication time (seconds)
Particle size (nm)
ζ-potential (mV)
Viscosity (Pa.s)
Exp Pre Exp Pre Exp Pre
CCRD
1 4,500 50 90 151.5 152.27 -53.1 -53.67 46.7 44.12
2 4,500 50 90 154.5 152.27 -53.8 -53.67 45.4 44.12
3 4,500 50 90 155.7 152.27 -55.3 -53.67 42.7 44.12
4 4,500 50 90 154.1 152.27 -54.4 -53.67 41.3 44.12
5 4,500 50 90 151.0 152.27 -52.9 -53.67 42.0 44.12
6 4,500 50 90 150.4 152.27 -51.7 -53.67 45.9 44.12
7 5,000 50 90 147.1 145.73 -48.1 -50.68 34.6 37.80
8 4,000 50 90 157.2 158.81 -42.6 -40.87 53.7 50.45
9 4,500 70 90 163.3 166.46 -46.1 -46.88 22.0 26.07
10 4,500 30 90 192.9 189.48 -38.4 -38.47 65.8 62.17
11 4,500 50 30 175.3 176.60 -46.5 -46.90 74.8 70.82
12 4,500 50 150 126.7 127.93 -69.4 -69.85 14.2 17.42
13 4,250 60 120 137.2 136.49 -58.1 -58.76 28.6 24.91
14 4,250 40 120 157.6 157.13 -50.2 -50.81 39.4 42.96
15 4,750 60 60 162.2 163.41 -50.1 -48.44 47.9 45.29
16 4,250 60 60 180.2 175.93 -40.3 -40.79 49.2 51.61
17 4,750 40 60 165.3 165.80 -49.3 -47.99 60.1 63.34
18 4,750 40 120 152.5 156.56 -54.1 -52.96 39.9 36.64
19 4,250 40 60 175.3 176.61 -39.5 -40.34 65.7 69.66
20 4,750 60 120 138.2 135.93 -62.8 -60.91 22.6 18.59
BBD
1 4,500 50 90 151.5 153.05 -52.1 -53.70 46.7 44.73
2 4,500 50 90 154.5 153.05 -53.8 -53.70 45.4 44.73
3 4,500 50 90 155.7 153.05 -55.3 -53.70 42.7 44.73
4 4,500 50 90 154.1 153.05 -54.4 -53.70 41.3 44.73
5 4,500 50 90 151.0 153.05 -52.9 -53.70 42.0 44.73
6 4,250 40 90 167.9 166.29 -44.0 -44.36 52.7 55.89
7 4,750 50 120 139.2 140.80 -61.3 -60.49 24.5 28.22
8 4,250 50 120 142.1 141.08 -59.1 -58.39 36.4 33.72
9 4,750 50 60 156.2 157.90 -51.2 -51.91 59.2 55.74
10 4,500 60 120 138.1 138.33 -62.1 -62.73 25.7 22.55
11 4,250 60 90 156.9 158.06 -49.5 -49.04 35.6 39.07
12 4,750 40 90 163.0 158.81 -50.3 -49.66 46.5 50.39
13 4,250 50 60 173.5 172.58 -42.6 -43.41 64.5 61.24
14 4,750 60 90 152.1 150.59 -53.6 -54.34 37.0 33.57
15 4,500 40 120 151.3 154.25 -53.2 -54.10 43.6 39.38
16 4,500 40 60 168.0 170.85 -46.9 -46.27 69.7 66.90
17 4,500 60 60 170.2 170.33 -47.9 -47.00 46.9 50.08
Abbreviations: ccrD, central composite rotatable design; BBD, Box-Behnken design; exp, experimental; Pre, predicted.
International Journal of Nanomedicine downloaded from https://www.dovepress.com/ by 118.70.13.36 on 23-Aug-2020
Dovepress Ngan et al
were insignificant, relative to pure error caused during the experiment.
The approximated regression coefficients describing the effect of independent variables were often related to standard deviation, prediction error sum of squares (PRESS), R2,
predicted R2, adjusted R2, and adequate precession.
Regres-sion coefficients of the final reduced quadratic polynomial models are tabulated in Table 4. The coefficients of deter-mination (R2) for particle size, ζ-potential, and viscosity
extracted using ANOVA were 0.9765, 0.9734, and 0.9569
for CCRD; whereas, they were 0.9625, 0.9736, and 0.9281 for BBD, respectively. The analysis showed that the viscosity has the highest coefficient value, followed by particle size and ζ-potential. The R2 value from CCRD showed a higher
value compared to BBD, but both designs fitted well into the second-order polynomial model.
response surfaces analysis
When the experimental data gathered from the responses of process parameters for both designs was analyzed, ANOVA
Table 3 Analysis of variance of the fitted linear/quadratic equation for particle size, ζ-potential, and viscosity of nanoemulsions
Source Particle size ζ-potential Viscosity
Mean square
F-value P-value Mean
square
F-value P-value Mean
square
F-value P-value
CCRD
Model 738.48 90.05 0.0001 135.88 50.35 0.0001 1,438.26 118.29 0.0001
X1 170.96 20.85 0.0005 96.04 35.59 0.0001 160.02 13.16 0.0023
X2 530.15 64.65 0.0001 70.56 26.15 0.0003 1,303.21 107.18 0.0001
X3 2,369.26 288.91 0.0001 526.70 195.17 0.0001 2,851.56 234.52 0.0001
X12 98.07 36.34 0.0001
X22 1,122.58 136.89 0.0001 190.14 70.46 0.0001
X32 34.71 12.86 0.0043
X1X3 71.40 8.71 0.0113 15.13 5.60 0.0373
X2X3 166.53 20.31 0.0006 28.13 10.42 0.0080
residual 8.20 – – 2.70 – – 12.16 – –
Lack of fit 10.37 2.19 0.2014 3.63 – 0.1893 15.34 2.97 0.1199
Pure error 4.73 – – 1.58 – – 5.17 – –
BBD
Model 276.72 42.74 0.0001 56.75 36.94 0.0001 713.97 55.91 0.0001
X1 111.75 17.26 0.0020 56.18 36.56 0.0003 60.50 4.74 0.0485
X2 135.30 20.90 0.0010 43.71 28.45 0.0007 566.16 44.33 0.0001
X3 1,180.98 182.40 0.0001 277.30 180.47 0.0001 1,515.25 118.65 0.0001
X12 11.64 7.57 0.0250
X22 121.16 18.71 0.0015 30.41 19.79 0.0021
X32 9.63 6.27 0.0367
X1X3 51.84 8.01 0.0179 10.24 6.66 0.0325
X2X3 59.29 9.16 0.0128 15.60 10.15 0.0129
residual 6.47 – – 1.54 – – 12.77 – –
Lack of fit 8.07 1.97 0.2660 1.51 – 0.5139 16.06 2.99 0.1521
Pure error 4.09 – – 1.56 – – 5.38 – –
Notes:X1, homogenization rate; X2, sonication amplitude; X3, sonication time.
Abbreviations: ccrD, central composite rotatable design; BBD, Box–Behnken design.
Table 4 Regression coefficients of the final reduced models
Regression coefficient
Particle size (nm) ζ-potential (mV) Viscosity (Pa.s)
CCRD BBD CCRD BBD CCRD BBD
standard deviation 2.86 2.54 1.64 1.24 3.49 3.57
Press 450.83 250.80 159.18 90.75 343.37 320.85
R2 0.9765 0.9625 0.9734 0.9736 0.9569 0.9281
adjusted R2 0.9657 0.9399 0.9541 0.9473 0.9488 0.9115
Predicted R2 0.9006 0.8546 0.8575 0.8054 0.9239 0.8610
Adequate precision 36.329 20.977 28.471 21.412 34.243 25.584
Abbreviations: CCRD, central composite rotatable design; BBD, Box–Behnken design; PRESS, prediction error sum of squares.
International Journal of Nanomedicine downloaded from https://www.dovepress.com/ by 118.70.13.36 on 23-Aug-2020
Dovepress comparison of process parameter optimization
showed a quadratic polynomial equation was best to predict the particle size and ζ-potential of the nanoemulsion. This showed that there was a significant effect in the interaction between independent variables, which was indicated by a large F-value and a small P-value of interaction terms. However, the viscosity of the nanoemulsion showed that the linear polynomial equation was best fitted for all
variables involved, and interaction terms were not signifi-cant in the model.
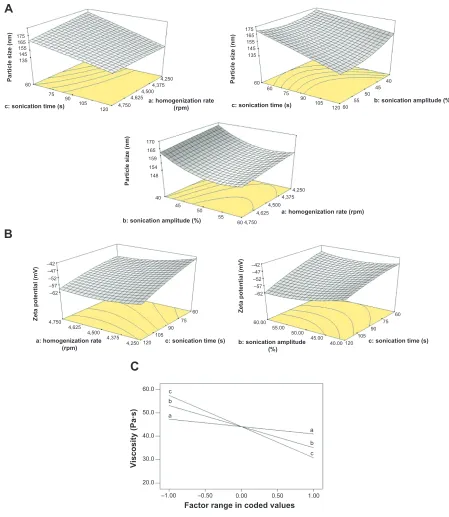
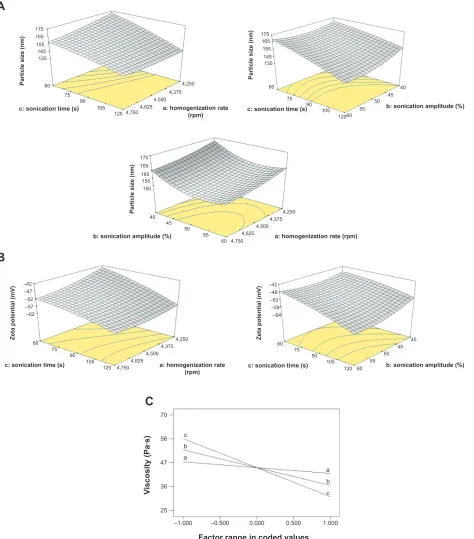
To better illustrate the effect of independent variables on the particle size and ζ-potential, the 3D surface response model graphs and contour plots of the quadratic polynomial models are shown in Figures 1 and 2. The 3D plots showed that increasing the sonication amplitude and homogenization
A
B
C
Particle size (nm)
Particle size (nm)
Zeta potential (mV
)
Vi
scosity (Pa∙s
)
Factor range in coded values
c 60.0
50.0
40.0
30.0
20.0
–1.00 –0.50 0.00 0.50 1.00 b
a
c b a
Zeta potential (mV
)
a: homogenization rate
(rpm) 4,250 120 105 90
75 60
4,375 4,500 4,625 4,750 –62 –57 –52 –47 –42
–62
60.00 55.00
50.00 45.00
40.00 120 105
90 75 60 –57
–52 –47 –42
b: sonication amplitude
(%) c: sonication time (s) c: sonication time (s)
Particle size (nm)
c: sonication time (s)
b: sonication amplitude (%)
a: homogenization rate (rpm) 60 4,750
4,625 4,500
4,375 4,250
55 50 45 4,750
4,6254,500 4,3754,250
120 105 90 75 60 135 145 155 165 175
a: homogenization rate
(rpm) b: sonication amplitude (%)
60 135 145 155 165 175
120 105 90 75 60
60 55 50 45
40
c: sonication time (s)
40 148 154 159 165 170
Figure 1 response surface plot (ccrD) showing effects of (a) homogenization rate, (b) sonication amplitude, and (c) sonication time on (A) particle size, (B) zeta potential, and (C) viscosity.
Abbreviation: ccrD, central composite rotatable design.
International Journal of Nanomedicine downloaded from https://www.dovepress.com/ by 118.70.13.36 on 23-Aug-2020
Dovepress Ngan et al
rate led to a reduction in the particle size of the nanoemul-sion. It was attributed to higher shear force or disruption mechanism applied, which breaks the oil droplets into a smaller size.17 Higher sonication time favored the formation
of nanoemulsions with smaller particle size. It was due to the
longer duration for the action of ultrasonic radiation forces to disperse the emulsion droplets into smaller sizes.
However, this trend was reversed after the particle reached its minimum size at the amplitude of 52%. This suggested that there was an optimum level for attaining the
A
B
C
Factor range in coded values
Vi
scosity (Pa∙s
)
a
25
–1.000 –0.500 0.000 0.500 1.000 36
47 58 70
a b
b c
c
Particle size (nm)
Zeta potential (mV
)
Zeta potential (mV
)
c: sonication time (s) a: homogenization rate c: sonication time (s) b: sonication amplitude (%) (rpm)
c: sonication time (s) b: sonication amplitude (%) 12060
55 50 45
40
60 55 50
45 40 105
90 75 60
60 –62 –57 –52 –47 –42
–64 –59 –53 –48 –42
75 90
105 120
60 75
90 105
120 4,750
4,625 4,5004,375
4,250
Particle size (nm)
b: sonication amplitude (%) a: homogenization rate (rpm) 150
40 45
50 55
60 4,750 4,625
4,5004,375 4,250 155
160 165 170
135 145 155 165 175
Particle size (nm)
c: sonication time (s) 120 4,7504,625 4,500
4,375 4,250
105 90 75 60 135 145 155 165 175
a: homogenization rate (rpm)
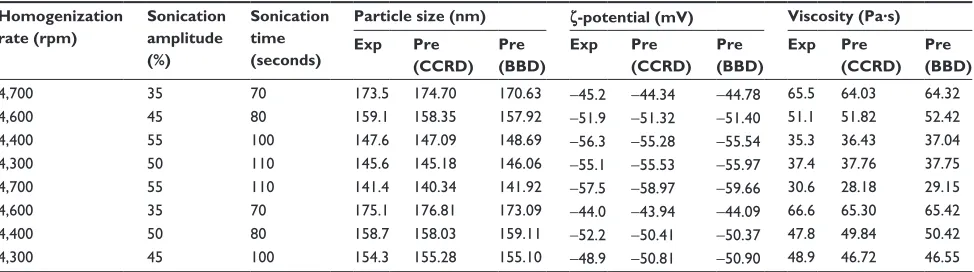
Figure 2 response surface plot (BBD) showing effects of (a) homogenization rate, (b) sonication amplitude, and (c) sonication time on (A) particle size, (B) zeta potential, and (C) viscosity.
Abbreviation: BBD, Box–Behnken design.
International Journal of Nanomedicine downloaded from https://www.dovepress.com/ by 118.70.13.36 on 23-Aug-2020
Dovepress comparison of process parameter optimization
maximum effect from acoustic emulsification.18 Hence, there
was no further reduction of particle size when the maximum dispersity was reached at the given acoustic power density. Another observation was witnessed where the effect was described as an overprocessing event, which was caused by the increase of coalescence in oil droplets at higher shear rate.19,20 Increase in sonication amplitude would increase the
ultrasonic radiation forces that drove the oil droplets to the anodes and antinodes of the acoustic field. Nearby droplets that were close to each other would coalesce and lead to overprocessing.21 In addition, the turbulence generated at
the vicinity of the probe tip at higher operating amplitude increase the rate of collision between the droplets, causing the production of acoustic bubbles. These bubbles were col-lected at the nodes of the acoustic field, due to the increase of the ultrasonic radiation forces. The remainder of the emulsions were shielded from the effect of acoustic oscil-lations by the bubble cloud and coalesced to form larger emulsion droplets.22
The absolute value of ζ-potential increased in the higher homogenization rate, due to the higher shear force applied that could disrupt the interfacial forces that hold the particle together and overcome Laplace pressure.23 Increase of
soni-cation amplitude had a similar effect on the ζ-potential of the colloidal system. However, there was no further increase in the absolute value of ζ-potential at sonication amplitude greater than 54%, where the particle has the smallest size. This observation could be explained by the overprocess-ing effect where the droplets had reached the maximum dispersity.23 Changes in the ζ-potential will depend on the
electrophoretic mobility of the dispersed particle, due to the effect of homogenization process in the nanoemulsion prepa-ration. Hence, the electrophoretic mobility of small particle size is greater and eventually leads to higher ζ-potential. In addition, the application of higher sonication amplitude would cause cavitation-induced thermal effect, resulting in the deterioration of T80:S80. Miscibility and solubility of the surfactant might be altered.24 At a constant
concentra-tion of T80:S80, the deterioraconcentra-tion of the mixed-surfactant lowered the amount of surfactant to adsorb on the newly formed droplet interface. Depletion interaction between the dispersed particles increased and rendered the colloidal system to be unstable.
Generally, higher sonication time favored the forma-tion of nanoemulsions. The interacforma-tion between sonicaforma-tion amplitude and time has a negative effect on ζ-potential of the nanoemulsions. Increase in sonication time caused a rising in the temperature of the system. The cavitation-induced
thermal effect caused by an increase of both sonication amplitude and time contributed to the overprocessing and the instability of the colloidal system. The temperature rise could cause the number of cavitation nuclei as well as their vapor pressure to increase. A damping of shock waves was produced, lowering the maximum pressure reached at the implosion sites.25 The emulsifying efficiency was affected
by this limitation, leading to a decrease in the absolute value of ζ-potential. It was observed that the emulsion that had been sonicated at amplitude 70%, and emulsion that had undergone sonication for 150 seconds was separated into two phases after 1 week. This observation is cor-roborated with the cavitation-induced thermal effect on the ζ-potential.
The linear polynomial equations can be best described for all the independent variables where they have negative effect on the viscosity of the nanoemulsions. Viscosity of the emulsions decreased as the high shear homogenization rate and sonication amplitude increased. The change of viscosity as the function of shear rate indicated that the nanoemulsions were non-Newtonian fluids. Before the application of shear force using the high shear homog-enizer, the coarse emulsions were aggregates of droplets. As the shear rate increased, the increasing hydrodynamic forces were able to deform and disrupt the flocs leading to a reduction in viscosity.26
On the other hand, higher sonication amplitude led to the formation of highly unstable bubbles that collapsed within a few milliseconds. The hydrocolloid dispersion particles were exposed to high shear forces around the bubble cloud. These high shear forces together with the thermal effect induced by sonication caused the cleavage of macromolecules of xanthan gum. The OH radicals formed in the cleavage of polysac-charides, resulting in broken glycosidic linkages, leading to a decrease in viscosity.27 As the sonication time increased,
the apparent viscosity of the nanoemulsions decreased, due to the expedited depolymerization of xanthan gum. The interactions between the polymer molecules were weakened, and this destruction of the polymer network resulted in a decrease of viscosity.28
Optimization of conditions
for formulating fullerene nanoemulsions
Fullerene nanoemulsion with desired characteristics, such as a small particle size and high absolute value of ζ-potential, can be considered as the optimum formulation. Despite want-ing these characteristics to be achieved, a cost-effective and fast preparation should not be compromised if expanded into
International Journal of Nanomedicine downloaded from https://www.dovepress.com/ by 118.70.13.36 on 23-Aug-2020
Dovepress Ngan et al
a large scale. The lowest energy input in producing fullerene nanoemulsions was chosen to reduce the cost of production, and the possibility of overprocessing can be avoided. In addition, production time could be cut down when sonica-tion time is reduced.
Under the optimum conditions, the process parameters involving a homogenization rate of 4,352 rpm and sonication amplitude of 48% for 97 seconds yielded a predicted response value for the particle size, ζ-potential, and viscosity were esti-mated to be 152.5 nm, -52.6 mV, and 44.6 Pa·s for CCRD; whereas, the optimum conditions suggested by BBD was a homogenization rate at 4,354 rpm and sonication amplitude of 49% for 105 seconds that would produce nanoemulsion with the particle size, ζ-potential, and viscosity of 148.5 nm,
-55.2 mV, and 39.9 Pa·s, respectively. Both designs predicted almost similar responses to each other; thus, this affirmed the reliability of the optimum formulation toward the desirable criteria. Formulations were also prepared under the recom-mended optimum conditions, and the resulting responses were compared to the predicted values for both models.
Verification of the models
The verification of final models was completed to test the adequacy of the predicted response values by performing eight additional randomized formulations, as shown in Table 5. No significant difference between the actual and
predicted values was shown in the results that indicated excellent fitness of the models generated.
comparison of ccrD and BBD models
in optimum conditions
Comparison between two experimental designs in obtaining optimum formulations using suggested process conditions by CCRD and BBD were conducted. The responses of three inde-pendent variables (homogenization rate, sonication amplitude, and sonication time) are shown in Table 6. Given the stated conditions, the extracted results were correlated with the pre-dicted outcome and RSE was computed as shown below,
( )
Exp value Pre valueResidual standard error % = 100%
Pre value
− × (8)
The result showed that CCRD produced a lower RSE value than the BBD for all variables, which suggested that CCRD is able to predict more accurate data compared to the actual experiment (Table 6). This indicates that CCRD is a better design comparing to BBD in this case.
rheological characterization
Optimum formulations suggested by CCRD and BBD were run through oscillatory strain sweep test, and the results were shown in Figure 3. G′ and G″ were constant at low
Table 5 Predicted and observed response values for randomized formulation in optimization of composition factor
Homogenization rate (rpm)
Sonication amplitude (%)
Sonication time (seconds)
Particle size (nm) ζ-potential (mV) Viscosity (Pa.s)
Exp Pre
(CCRD) Pre (BBD)
Exp Pre
(CCRD) Pre (BBD)
Exp Pre
(CCRD) Pre (BBD)
4,700 35 70 173.5 174.70 170.63 -45.2 -44.34 -44.78 65.5 64.03 64.32
4,600 45 80 159.1 158.35 157.92 -51.9 -51.32 -51.40 51.1 51.82 52.42
4,400 55 100 147.6 147.09 148.69 -56.3 -55.28 -55.54 35.3 36.43 37.04
4,300 50 110 145.6 145.18 146.06 -55.1 -55.53 -55.97 37.4 37.76 37.75
4,700 55 110 141.4 140.34 141.92 -57.5 -58.97 -59.66 30.6 28.18 29.15
4,600 35 70 175.1 176.81 173.09 -44.0 -43.94 -44.09 66.6 65.30 65.42
4,400 50 80 158.7 158.03 159.11 -52.2 -50.41 -50.37 47.8 49.84 50.42
4,300 45 100 154.3 155.28 155.10 -48.9 -50.81 -50.90 48.9 46.72 46.55
Abbreviations: ccrD, central composite rotatable design; BBD, Box–Behnken design; exp, experimental; Pre, predicted.
Table 6 Predicted and observed response values for optimal formulation
Model Independent variable Particle size
(nm)
RSE
(%) ζ(mV)-potential
RSE (%)
Viscosity (Pa.s)
RSE (%) Homogenization
rate (rpm)
Sonication amplitude (%)
Sonication time (seconds)
Exp Pre Exp Pre Exp Pre
ccrD 4,352 48 97 153.6 152.5 0.72 53.3 -52.6 1.33 44.1 44.6 1.12
BBD 4,354 49 105 150.4 148.5 1.28 54.1 -55.2 1.99 40.6 39.9 1.75
Abbreviations: ccrD, central composite rotatable design; BBD, Box–Behnken design; rse, residual standard error; exp, experimental; Pre, predicted.
International Journal of Nanomedicine downloaded from https://www.dovepress.com/ by 118.70.13.36 on 23-Aug-2020
Dovepress comparison of process parameter optimization
G
'
(Pa),
G
''
(Pa
)
Complex shear strain (%)
100
10
1
0.1
0.1 1 10 100 1,000 10,0000 10 20 30 40 50 60 70 80 G' G''
δ
90
Phase angle,
δ
(°
)
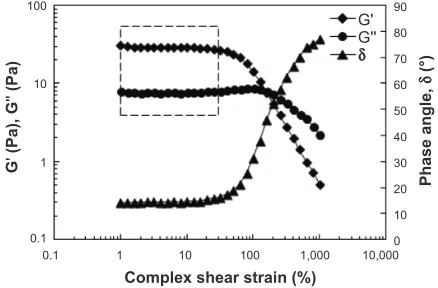
Figure 3 storage modulus (G′), loss modulus (G″), and phase angle (δ) as a function of strain amplitude γ of the optimum fullerene nanoemulsion.
deformation, which indicated the sample structure was unin-terrupted. Once the plateau started to decrease, this marked the end of LVR, due to the breakdown of architecture within the colloidal system. From the LVR, both formulations displayed higher G′ value (storage modulus) compared to G″ value (loss modulus) indicating that the systems exhibited elastic behavior rather than viscous behavior.29 The results showed
that both formulations generated wide LVR that directly related to high rigidity of the system. Samples with wide LVR indicated excellent stability against phase separation as well.29 Optimum formulations were found to be monophasic
even when they were left for 90 days at room temperature (25.0°C±0.5°C) and 45°C in the incubator DK-S1020 (DAIKI Sciences Co. Ltd, Seoul City, Korea). The LVR of the optimized formulation from CCRD and BBD have a similar complex shear strain of 31.57%. The yield stress of formulation was determined at the end of LVR, where an optimum formulation was 8.76 Pa. The phase angle was 16.4°, which was lower than 45.0°, indicating that the sample was solid-like material.
Conclusion
Control of process parameters in the fullerene nanoemul-sion preparation is crucial to acquire desirable attributes for effective transdermal delivery. The fullerene nanoemul-sion was prepared by employing high shear and ultrasonic emulsification methods while further optimized by CCRD and BBD as multivariate modeling tools in process param-eter studies for improved accuracy and quality in results. Significant interaction between the process parameters was observed in determining the particle size and ζ-potential (P0.05), except viscosity where no interaction between process parameters can be observed. Both final reduced models predicted the same polynomial model, which
validates one another in achieving the optimum process conditions. However, CCRD (RSE 1.2%) displayed a better performance in model fitting and estimation of actual values than BBD (RSE 2.0%). Optimum nanoemul-sion exhibited wide LVR giving great resistance against flow while maintaining the structure of the nanoemulsion itself, indicating excellent long-term stability. Therefore, the development of fullerene nanoemulsion by ultilizing multivariate statistical technique can be cost-effective and able to achieve desirable properties suitable for transdermal application in the same time.
Acknowledgments
The authors would like to thank the Ministry of Higher Education, Malaysia for the financial support under the Fundamental Research Grant Scheme (FRGS) (02-01-13-1235FR) and MyBrain15.
Disclosure
The authors report no conflicts of interest in this work.
References
1. Hirsch A, Brettreich M. Fullerene: Chemistry and Reactions. Wein-heim: Wiley-VCH Verlag GmbH & Co; 2005.
2. Krusic PJ, Wasserman E, Keizer PN, Morton JR, Preston KF. Radical reactions of c60. Science. 1991;254(5035):1183–1185.
3. Haley B, Frenkel E. Nanoparticles for drug delivery in cancer treatment. Urol Oncol. 2008;26(1):57–64.
4. Dugan LL, Lovett EG, Quick KL, Lotharius J, Lin TT, O’Malley KL. Fullerene-based antioxidants and neurodegenerative disorders. Parkin-sonism Relat Disord. 2001;7(3):243–246.
5. Ryan JJ, Bateman HR, Stover A, et al. Fullerene nanomaterials inhibit the allergic response. J Immunol. 2007;179(1):665–672.
6. Kolosnjaj J, Szwarc H, Moussa F. Toxicity studies of fullerenes and derivatives. Adv Exp Med Biol. 2007;620:168–180.
7. Inui S, Aoshima H, Nishiyama A, Itami S. Improvement of acne vulgaris by topical fullerene application: unique impact on skin care. Nanomedicine. 2011;7(2):238–241.
8. Lens M. Recent progresses in application of fullerenes in cosmetics. Recent Pat Biotechnol. 2011;5(2):67–73.
9. Kato S, Taira H, Aoshima H, Saitoh Y, Miwa N. Clinical evaluation of fullerene-C60 dissolved in squalane for anti-wrinkle cosmetics. J Nanosci Nanotechnol. 2010;10(10):6769–6774.
10. Bosi S, Da Ros T, Spalluto G, Prato M. Fullerene derivatives: an
attractive tool for biological applications. Eur J Med Chem. 2003; 38(11–12):913–923.
11. Cataldo F. Solubility of fullerenes in fatty acids esters: a new way to deliver in vivo fullerenes. Theoretical calculations and experimental results. In: Cataldo F, Da Ros, T, editors. Medicinal Chemistry and Pharmacological Potential of Fullerenes and Carbon Nanotubes (Carbon Materials: Chemistry and Physics). Berlin: Springer Science; 2008:317–335.
12. Mat Hadzir N, Basri M, Abdul Rahman MB, Salleh AB, Raja Abdul Rahman RN, Basri H. Phase behaviour and formation of fatty acid esters nanoemulsions containing piroxicam. AAPS Pharm Sci Tech. 2013;14(1):456–463.
13. Keng PS, Basri M, Zakaria MRS, et al. Newly synthesized palm esters for cosmetic industry. Ind Crops Prod. 2009;29(1):37–44.
International Journal of Nanomedicine downloaded from https://www.dovepress.com/ by 118.70.13.36 on 23-Aug-2020
Dovepress
International Journal of Nanomedicine
Publish your work in this journal
Submit your manuscript here: http://www.dovepress.com/international-journal-of-nanomedicine-journal The International Journal of Nanomedicine is an international,
peer-reviewed journal focusing on the application of nanotechnology in diagnostics, therapeutics, and drug delivery systems throughout the biomedical field. This journal is indexed on PubMed Central, MedLine, CAS, SciSearch®, Current Contents®/Clinical Medicine,
Journal Citation Reports/Science Edition, EMBase, Scopus and the Elsevier Bibliographic databases. The manuscript management system is completely online and includes a very quick and fair peer-review system, which is all easy to use. Visit http://www.dovepress.com/ testimonials.php to read real quotes from published authors.
Dove
press
Ngan et al
14. Gutiérrez JM, González C, Maestro A, Solè I, Pey CM, Nolla J. Nano-emulsions: new applications and optimization of their preparation. Curr Opin Colloid Interface Sci. 2008;13(4):245–251.
15. Rezaee M, Basri M, Rahman RN, Salleh AB, Chaibakhsh N, Karjiban RA. Formulation development and optimization of palm kernel oil esters-based nanoemulsions containing sodium diclofenac. Int J Nanomedicine. 2014;9:539–548.
16. Hao J, Fang X, Zhou Y, et al. Development and optimization of solid lipid nanoparticle formulation for ophthalmic delivery of chloram-phenicol using a Box-Behnken design. Int J Nanomedicine. 2011; 6:683–692.
17. Li PH, Chiang BH. Process optimization and stability of D-limonene-in-water nanoemulsions prepared by ultrasonic emulsification using response surface methodology. Ultrason Sonochem. 2012; 19(1):192–197.
18. Mason TJ. Large scale sonochemical processing: aspiration and actual-ity. Ultrason Sonochem. 2000;7(4):145–149.
19. Jafari SM, Assadpoor E, He Y, Bhandari B. Re-coalescence of emulsion droplets during high-energy emulsification. Food Hydrocoll. 2008;22(7) 1191–1202.
20. Desrumaux A, Marcand J. Formation of sunflower oil emulsions stabilized by whey proteins with high-pressure homogenization (up to 350 MPa): effect of pressure on emulsion characteristics. Int J Food Sci Tech. 2002;37(3):263−269.
21. Pangu GD, Feke DL. Acoustically aided separation of oil droplets from aqueous emulsions. Chem Eng Sci. 2004;59(15):3183–3193. 22. Kentish S, Wooster TJ, Ashokkumar M, Balachandran S, Mawson R,
Simons L. The use of ultrasonics for nanoemulsion preparation. Innova-tive Food Science and Emerging Technologies. 2008;9(2):170–175.
23. Cheong JN, Tan CP, Man YBC, Misran M. α-Tocopherol nanodisper-sions: Preparation, characterization and stability evaluation. J Food Eng. 2008;89(2):204–209.
24. Tang SY, Manickam S, Wei TK, Nashiru B. Formulation development and optimization of a novel Cremophore EL-based nanoemulsion using ultrasound cavitation. Ultrason Sonochem. 2012;19(2):330–345. 25. Canselier JP, Delmas H, Wilhelm AM, Abismail B. Ultrasound
Emulsification – An Overview. J Dispers Sci Technol. 2002;23(1–3): 333–349.
26. Floury J, Desrumaux A, Lardières J. Effect of high-pressure homog-enization on droplet size distributions and rheological properties of model oil-in-water emulsions. Innovative Food Science and Emerging Technologies. 2000;1(2):127–134.
27. Tiwari BK, Muthukumarappan K, O’Donnel CP, Cullen PJ. Rheological properties of sonicated guar, xanthan and pectin dispersions. Int J Food Prop. 2010;13:223–233.
28. Karaman S, Yilmaz MT, Ertugay MF, Baslar M, Kayacier A. Effect of ultrasound treatment on steady and dynamic shear properties of glucomannan based salep dispersions: optimization of amplitude level, sonication time and temperature using response surface methodology. Ultrason Sonochem. 2012;19(4):928–938.
29. Lippacher A, Müller RH, Mäder K. Liquid and semisolid SLN disper-sions for topical application: rheological characterization. Eur J Pharm Biopharm. 2004;58(3):561–567.
International Journal of Nanomedicine downloaded from https://www.dovepress.com/ by 118.70.13.36 on 23-Aug-2020