Available Online at www.ijcsmc.com
International Journal of Computer Science and Mobile Computing
A Monthly Journal of Computer Science and Information Technology
ISSN 2320–088X
IJCSMC, Vol. 4, Issue. 7, July 2015, pg.263 – 270
RESEARCH ARTICLE
COMPARING PROBABILITIES of
INEQUALITIES in DIMENSION INCOMPLETE
DATABASES USING INDEX STRUCTURE
M. JYOTHI
1, S. VASUNDRA
2¹CSE Dept(AI).,JNTUA College of Engineering, Anantapur, A.P,INDIA
²CSE Dept, JNTUA College of Engineering, Anantapur, A.P, INDIA
1
[email protected]; 2 [email protected]
Abstract:Real world applications using databases with incomplete data are common. Databases with incomplete data take place in a wide range of industry and research domains. There is a diversity of reasons why databases may contain incomplete data. The data may not be accessible at the time the record was created or it was not recorded because of equipment adverse conditions or malfunction. Data may have been accidentally omitted or the data is not related to the record at hand. The grant for and use of incomplete data may be purposely designed into the database. In some situations, the incompleteness of data is random, i.e. the incompleteness of some value does not depend on the value of another variable. The main aim of this paper is to implement an index structure that can utilize the inequality between the data to further improve the efficiency of the query process. The indexed structure will store all the probability values in ascending or descending order and gives rapid access when ever needed which in turn increases the search process.
I. Introduction
any information regarding its respective dimensions. When the dimensionality of the collected data is minor than its actual dimensionality, the dependency of dimensions on their related values is lost. We refer to such a problem as the dimension incomplete problem. In this case consider the sensor networks. The database usually contains time series data objects, each of which is represented by a sequence of values (x1; x2; . . . ;xm). The dimension
information associated with data values can be indirectly inferred from the data arrival order. This schema of data gathering and storing is very common in resource-constrained applications because clearly maintaining dimension information will cause additional costs. In this problem setting, missing a single data element will terminate the dimension information of the whole data object. For example, the original data object is (3, 1, 2, 5). When data element 1 is lost, then dimension information for the rest of data elements becomes unclear. For example, 3 can be the first or the second element, and 2 can be the second or the third element.
When data elements 1 and 5 are lost, then both elements 3 and 2 may locate on three altered dimensions. In applications where dimension information is clearly maintained, the dimension pointer itself may be missing. This will also cause the dimension incomplete problem. Missing Dimension Information posse’s great computational challenges. Incompleteness of data is a regular problem in many databases together with web multi-relational databases, heterogonous databases, spatial and temporal databases and data incorporation. The incompleteness of data initiate challenges in processing queries, as long as they provide accurate results that best meet the query conditions over incomplete database is not a trivial task. In the existing work dimension incomplete problem is studied which usually refers to the missing value problem that means, data values on certain dimension are unknown or uncertain. The existing work posses the common assumption regarding each dimension, whether it’s data values is missing or not become known. In real life application, if data collected from noisy environment not only data values miss but also dimension information missing. So that, we have to know the arrival order of data values without knowing which dimensions the values belongs to.
Dealing with missing data is a central issue for modern problems in statistical signal processing and machine learning. At the University of California, Irvine (UCI) database for machine learning data sets, users upload data sets and documentation for others to test their machine learning algorithms. One piece of meta-data about each data set is whether or not there are missing values. Approximately 25% of the data sets have a “Yes” in this category1. Not including the data sets which are marked “N/A”, approximately 40% of the data sets have missing values. In our own research, we have dealt with data from the UW Computer network, the Centre for Embedded Networked Sensing (CENS) Cold Air Drainage transect2, data capturing signal strength of the public wifi in Madison, Wisconsin, and data collected on the climate and ecosystem of the lakes in the state of Wisconsin. In all of these data sets, data were missing. Taking another perspective on this issue, sometimes it is not that data go missing, but instead that all the data cannot possibly be collected. In fact the problem of interest may be to infer a subset of the data points that we don’t have.
This paper focuses on data which are missing uniformly at random. This means that:
Which data are missing or observed is in no way dependent on the actual values themselves;
Which data are missing or observed is in no way dependent on which other values are missing or observed;
The probability that any one data point is missing is equal to that of any other data point being missing.
II. Related work
probability that a data object will become similar to the query. These bounds enabled efficient filtering of inappropriate data objects without clearly examining all missing dimension combinations. A probability triangle inequality is engaged to further reduce the search space and speed up the query process.
R. Fagin, R. Kumar, and D. Sivakumar [2] introduced rank aggregation as approach towards doing similarity search and classification. In this method, query and candidates are classified as points in multidimensional space. Each coordinate has been individually pointed out as voter. It ranks the points based on closeness to the corresponding coordinate of query. The winners are those points with the highest aggregated ranks which when are combined with dimensionality reduction yields a simple, database-friendly algorithm and gives a very good approximate answer to the nearest neighbor problem. This algorithm is observed to be efficient. Median rank aggregation is an efficient and useful form of rank aggregation.
E. Keogh [3] Dynamic Time Warping (DTW) is a much more robust distance measure for time series. DTW allowing similar shapes to match even if they are out of phase in the time axis. First, consideration in the case where the two sequences are of the equal length. This is not really a limitation because the user can always re interpolate the query to any desired length. Secondly, only index sequences if we assume the warping path is constrained.
D. Gu and Y. Gao [4] Incremental gradient descent imputation(InGrImputation) Model creates an universal model for the variable with missing data based on the relationship between the variable and other known variables. InGrImputation model uses a relationship among variables to estimate the missing value and therefore improves the performance of Learning Classifier Systems (LCS).
E. Keogh and M. Pazzani [5] Dynamic time warping (DTW) has been suggested as a technique to robust distance calculations for time series data, however it is computationally expensive. DTW is distance measure for time sequence, allowing related shapes to match even if they are out of phase in the time alignment. Related shapes to match even if they are out of phase in time alignment for time sequence is nothing but DTW distance measure. Modification of DTW that exploits a higher level representation of time series data. This produces one to three orders of magnitude speed-up without compromising in accuracy.
B. Bollobas, G. Das, D. Gunopulos, and H. Mannila [6] Gave a pair of un-identical complex objects, denying (and determining) however their similarity to each other is a nontrivial problem. In data mining applications, one needs to determine the similarity between two time series. Analyze a model of time-series similarity that allows outliers, different scaling functions, and present deterministic and randomized algorithms for computing this notion of similarity. Non trivial tools and methods from computational geometry on which algorithms are based. Use the properties of well-separated geometric sets. The randomized algorithm for computing similarity between two time series has provably good performance.
III. PROPOSED MODEL
This paper handles the missing data or misplaced data efficiently using the index structure. The index structure is used to maintain the data present in the database efficiently and the accessing speed of the searching will be increased greatly with indexing. The proposed method consists of the following models:
Indexing
Filtering the probability inequalities.
Filtering Lower and Upper Bounds.
Probability Verification
Fig.1 Components of the proposed model
A. Indexing:
The proposed method uses an indexing structure to access the data files efficiently. An activity index is a data mining procedure where the files of databases are stored in blocks and those are pointed using block pointer and whenever user searches the block details the pointer directly points to that block without searching entire data files. The figure below shows an example of that index structure.
Fig.2 Index Structure
The figure clearly depicts that the entire data is pointed to the index table where the pointers are stored rather than entire data.
B. Filtering the probability inequalities:
Given a query object Q, a dimension complete data object R (i.e., |Rj|=|Q|), and a dimension incomplete data object Xo whose underlying complete version is X, we have that
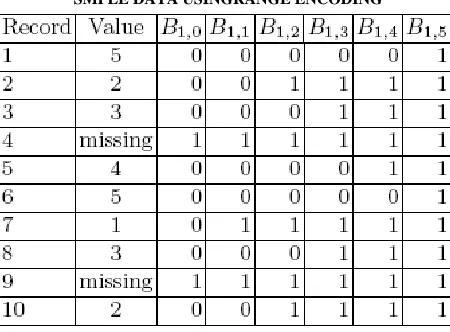
For range encoded bitmaps, bit Bi,j [x] is 1 if record x has a value that is less than or equal to j for attribute Ai and 0 otherwise. Using this encoding if Bi,j [x] = 1 then Bi,k[x] = 1 for all k > j.
In this case the last bitmap Bi,Ci for each attribute Ai is all 1s. Thus, we drop this bitmap and only keep
Ci−1 bitmaps to represent each attribute.
If attribute Ai has missing values we add the bitmap Bi,0 which has Bi,0[x] = 1 if record x has a missing value for attribute Ai. Also in this case Bi,j [x] = 1 for all j. We are treating missing data as the next smallest possible value outside the lower bound of the domain, in our case, the value 0.
In total the set of bitmaps required to represent attribute Ai with missing values is Ci. We also tried another kind of encoding in which instead of making missing data the smallest value we consider the extra bitmap to be a flag indicating whether the data is missing. In this alternative, if record x has a missing value for attribute
However, by making Bi,Ci [x] = 0 when x has a missing value for attribute Ai, we can no longer drop it. This will effectively increase the number of bitmaps for attribute Ai to Ci+1, and will not provide any advantage to the query evaluation logic.
C. Filtering Lower and Upper bounds:
The bitmaps are represented and stored in index and the lower bounds and upper bounds are provided by the user for filtering out the remaining tuples from the dataset. The limits are represented in range query. Here range represents the starting (upper bound) to the ending (lower bound).
With range encoded bitmaps the bitmaps used and the operations performed to execute a query depend on the range being queried.
(a) Missing Data is a Match (b) Missing Data is not a Match
Fig.3 Interval Evaluation for Bitmap Range Encoding
This paper identifies three scenarios, depending on whether the range includes the minimum value or maximum value, or within the domain and either the minimum or maximum. Figures 3(a) and 3(b) show how the interval is evaluated for a single query attribute when missing data implies a match or does not imply a match respectively. In the presence of missing data, range encoded bitmaps are more efficient for range queries than equality encoded bitmaps in all but extreme cases. In the case where missing data is a query match, we will need to access between 1 and 3 bit vectors per query dimension. In databases without missing data, we would need to access between 1 and 2 bit vectors per query dimension. Some overhead is introduced to deal with the missing data case. In the case where missing data is not a match, we need to access between 1 and 2 bit vectors per query dimension. This is also true for databases without missing data, but there are two conditions, specifically the conditions where the query range includes the minimum domain value, that require 1 extra bit vector access. This is due to the fact that missing values are encoded as 1’s in all bitmaps and a XOR operation is required to eliminate missing data from the result set.
TABLE 1
SMPLE DATA USINGRANGE ENCODING
D. Naïve Probability Verification:
IV. PERFORMANCE ANALYSIS
The searching process is tested for Precision In information retrieval contexts, precision is defined in terms of a set of retrieved documents (e.g. the list of documents produced by a web search engine for a query) and a set of relevant documents (e.g. the list of all documents on the internet that are relevant for a certain topic).
Precision:
In the field of information retrieval, precision is the fraction of retrieved documents that are relevant to the query:
{ } { } { }
For example for text search on a set of documents precision is the number of correct results divided by the number of results that should have been returned.
Fig.4 Precision Comparison
The figure 4 demonstrates that the proposed system provides constant rate irrespective of the tuple size and provided better precision rate compared to the existing system.
V. CONCLUSION
This paper introduced an everlasting problem of dimension incomplete data where the data will be misplaced or the data is missing. Searching that type of data is very difficult. So to search and retrieve the data efficiently this paper uses indexing and the probability models to estimate the missing values and to model the data efficiently. Further the system is tested for the Accuracy (Precision) and compared with the system in [1] which doesn’t support the indexing.
REFERENCES
W. Cheng, X. Jin, J. Sun, X. Lin, X. Zhang, and W. Wang., “Searching Dimension Incomplete Databases'' IEEE Transactions on knowledge and data engineering, pp. 725-738, 2014 as in [1]
R. Fagin, R. Kumar, and D. Sivakumar, “Efficient Similarity Search and Classification via Rank Aggregation,” Proc. ACM SIGMOD Int’l Conf. Management of Data (SIGMOD ’03), pp. 301-312, 2003 as in [2]
0 0.1 0.2 0.3 0.4 0.5 0.6 0.7 0.8 0.91
5 10 15 20 25
Pr
e
ci
si
o
n
No.Of Tuples Proposed
E. Keogh, “Exact Indexing of Dynamic Time Warping,” Proc. 28th
Int’l Conf. Very Large Data Bases (VLDB ’02), pp. 406-417, 2002 as in [3]
D. Gu and Y. Gao, “Incremental Gradient Descent Imputation Method for Missing Data in Learning Classifier Systems,” Proc. Workshops Genetic and Evolutionary Computation (GECCO ’05), pp. 72-73, 2005 as in [4]
E. Keogh and M. Pazzani, “Scaling up Dynamic Time Warping to Massive Data Sets,” Proc. Third European Conf. Principles of Data Mining and Knowledge Discovery (ECML/PKDD ’2009), pp. 1-11, 2009 as in [5]
B. Bollobas, G. Das, D. Gunopulos, and H. Mannila, “Time-Series Similarity Problems and Well-Separated Geometric Sets,” Proc. 13th Ann.Symp. Computational Geometry (SCG ’97), pp. 454-456, Kalbhor Swati et al, / (IJCSIT) International Journal of Computer Science and Information Technologies, Vol. 6 (1) , 2015, 198-200 as in [6]
M.Jyothi received B.Tech degree in Computer Science and Engineering from Gates Institute of Technology Anantapur, affiliated to JNTUA University, Anantapuramu, A.P, India, during 2009 to 2013. Currently pursuing M.Tech in Computer Science(Artificial Intelligence) from JNTUA College of Engineering, Anantapuramu, A.P, India, during 2013 to 2015 batch. Her Area of interests include Data mining, Network Security.