Western University Western University
Scholarship@Western
Scholarship@Western
Electronic Thesis and Dissertation Repository
8-14-2019 1:00 PM
Improving Stimulus Realism: The effect of visual dimension on
Improving Stimulus Realism: The effect of visual dimension on
affective responding
affective responding
Shannon Compton
The University of Western Ontario
Supervisor Mitchell, Derek
The University of Western Ontario Graduate Program in Neuroscience
A thesis submitted in partial fulfillment of the requirements for the degree in Master of Science © Shannon Compton 2019
Follow this and additional works at: https://ir.lib.uwo.ca/etd
Part of the Cognition and Perception Commons, and the Cognitive Neuroscience Commons
Recommended Citation Recommended Citation
Compton, Shannon, "Improving Stimulus Realism: The effect of visual dimension on affective responding" (2019). Electronic Thesis and Dissertation Repository. 6419.
https://ir.lib.uwo.ca/etd/6419
This Dissertation/Thesis is brought to you for free and open access by Scholarship@Western. It has been accepted for inclusion in Electronic Thesis and Dissertation Repository by an authorized administrator of
i
Abstract
For decades researchers have used 2D stimuli under the assumption that they accurately represent
real objects. This assumption has been challenged by recent vision and neuroeconomics research
which has found that 2D images can evoke different neural and behavioural responses than real
objects. The current study continues this line of research in the field of affective cognitive
neuroscience; a field where small effect sizes are common and rapid habituation to affective stimuli
used in the lab often occurs. The present study uses realistic 2D and 3D emotional images to
determine the impact of visual dimension on affective responding. Subjective ratings revealed a
perceptual advantage for 3D images which were rated more realistic and received some higher
ratings of emotion than 2D images. Conversely, there were no differences in psychophysiological
responding (i.e. skin conductance and electromyography) between 2D and 3D images. The
implications of these results and future directions are discussed.
Keywords
ii
Summary for Lay Audience
In order to generate an emotional reaction within a research setting, most psychology and
neuroscience studies use emotional 2D images (e.g. kittens to induce pleasant emotions, spiders to
induce fear). However, recent research suggests there are differences in the way the human brain
respond to 2D images versus actual, physical objects. Real objects are better remembered, attended
to, and are more highly valued than 2D images. This raises the question as to how well findings
from studies which use 2D images can generalize to real world situations. In the laboratory, it is
often difficult to mimic the impact of emotions in the real-world because emotional responses to
images tends to weaken significantly when they are presented repeatedly. The present study aims
to determine whether effects of emotion can be improved by using 3D images as they more closely
resemble real objects. This study compared photorealistic 2D and 3D images of insects and
arachnids of varying degrees of pleasantness (e.g. butterflies, scorpions). We predicted that 3D
images would be perceived as more realistic and generate more intense emotional reactions
compared to 2D images. To measure this, we explicitly asked participants to rate how realistic,
pleasant, arousing, approachable, and dangerous they found each image. We also measured
participants’ bodily responses to the images as specific patterns of bodily responses are associated
with different emotional reactions. The startle eye blink response is differentially affected by
emotional images; positive images decrease the magnitude of the startle and negative images
increase the magnitude of the startle. Skin conductance (SC) measures minute changes in the
amount of sweat present on the skin. SC increases in response to emotionally arousing images,
whether positive or negative. Our study found that 3D images showed greater subjective ratings
for realism, arousal, and danger, but these same 3D images did not result in significant differences
in visceral emotional reactions compared to 2D images. Before a definitive judgement can be made
on whether there are differences in visceral reactions between 2D and 3D images, future research
should compare these two image types using more arousing images, more bodily measures, and
iii
Co-Authorship Statement
I, Shannon Compton, completed all experimental and written work for this thesis project. I
designed the current study, recruited participants, completed all data collection, data processing,
data analysis, and wrote the written work.
My supervisor, Dr. Derek Mitchell, contributed to all aspects of this thesis project including the
formulation of the research question, consultation with task design, data analysis, interpretation,
iv
Acknowledgements
While this thesis is my work, I could not have completed it without the help and support of so
many wonderful people at Western University. Firstly, I would like to thank my supervisor Dr.
Derek Mitchell for his assistance and overwhelming support throughout this project. I will forever
be grateful for his guidance, from the inception of this project through to the writing of this thesis
(each and every draft of it). I would also like to thank Dr. Mitchell as well as Ian Jones and Marwan
Syed for creating the stimuli used in this study. A special thanks to Ian Jones for starting data
collection for the pilot study. I would also like to thank Kevin Stubbs for creating the MATLAB
script used in the current study and for taking the time to meet with me (on many occasions) to
make sure the computer task was as it needed to be.
I would like to thank my advisory committee, including Dr. Jody Culham, Dr. Ingrid Johnsrude,
and Dr. Ryan Stevenson, for their support and feedback throughout this project. I am especially
grateful to Dr. Stevenson for his assistance in the editing process of this written work.
I would like to thank my lab mates, past and present, including Tamara Tavares, Mary Ritchie, Dr.
Joana Vieira, Stephen Pierzhajlo, Cathleen Fleury, Emma Stewart and our many volunteers, for
their support through data collection headaches, presentation anxieties, and the sense of ennui that
sometimes overtakes graduate students. I am grateful to them for their companionship throughout
my graduate studies.
Finally, I would like to thank my family for their support and my partner, Cale Moore, for agreeing
v
Table of Contents
Abstract ... i
Summary for Lay Audience ... ii
Co-Authorship Statement... iii
Acknowledgements ... iv
Table of Contents ... v
List of Figures ... viii
List of Appendices ... xi
List of Abbreviations ... xii
CHAPTER 1 ... 1
1 Introduction ... 1
1.1 Affective Cognitive Neuroscience ... 1
1.2 Brain areas involved in emotion processing ... 3
1.3 Psychophysiological measures of emotion ... 5
1.4 Emotion and decision making ... 6
1.5 Emotion and attention ... 8
1.6 Difficulties with emotion research ... 9
1.7 Visual processing in the brain ... 10
1.8 Databases of affective stimuli ... 12
1.9 Questioning the ecological validity of 2D stimuli ... 14
1.10 Thesis objectives and hypotheses ... 17
CHAPTER 2 ... 19
2 Methods... 19
2.1 Participants ... 19
vi
2.3 Items ... 21
2.4 Subjective measures ... 22
2.5 Psychophysiological measures ... 23
2.6 Procedure: Pilot ... 25
2.7 Procedure: Main study ... 25
2.7 Statistics ... 28
CHAPTER 3 ... 29
3 Results ... 29
3.1 Subjective Ratings ... 29
3.1.1 Realism ... 29
3.1.2 Arousal ... 31
3.1.3 Danger ... 33
3.1.4 Approachability... 35
3.1.5 Pleasantness ... 40
3.2 Electromyography results ... 42
3.2.1. EMG first block ... 45
3.2.2. EMG habituation ... 46
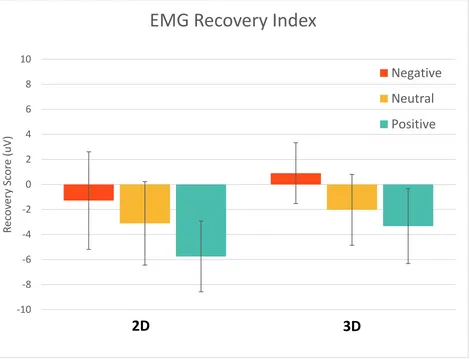
3.2.3 EMG recovery ... 47
3.3 Skin conductance response results ... 48
3.3.1 SCR first block ... 51
3.3.2 SCR Habituation ... 52
3.3.3 SCR Recovery ... 53
3.4 Adapted Fear of Spiders Questionnaire Correlations ... 54
3.5 Trait Anxiety Score Correlations ... 56
vii
4 Discussion ... 59
4.1 Study Results ... 59
4.2 Study implications ... 60
4.3 Limitations and future directions ... 64
4.4 Conclusions ... 67
References ... 69
Appendix A ... 94
1 Pilot Study ... 94
1.1 Realism ... 94
1.2 Arousal ... 95
1.3 Danger ... 96
1.4 Approachability ... 97
1.5 Pleasantness ... 98
Appendix B ... 99
viii
List of Figures
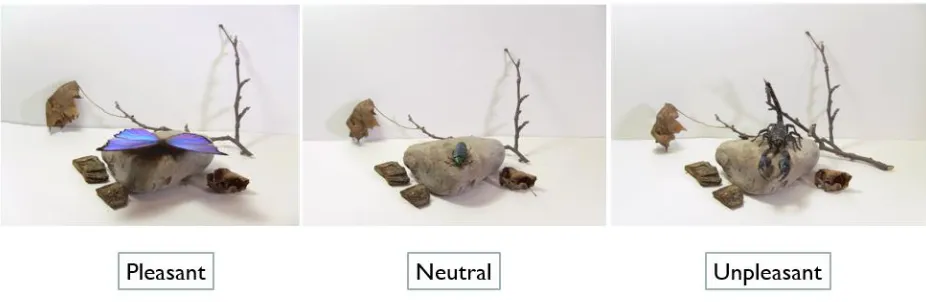
Figure 1. Examples of a pleasant, neutral, and unpleasant 2D stimuli in one stimulus subset. ... 21
Figure 2. SCR and EMG electrode placements. ... 24
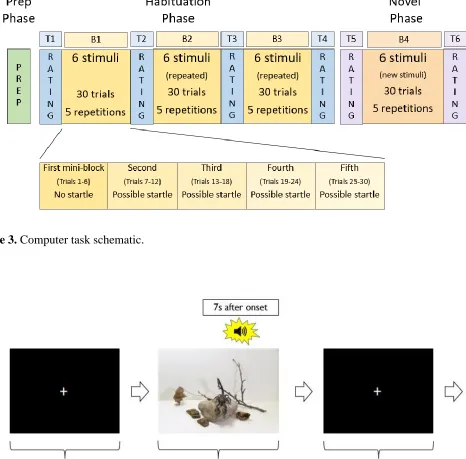
Figure 3. Computer task schematic. ... 27
Figure 4. Example of observation trial. SCR data were collected over all 30 trials within an observation block; SCRs were considered event related if they began between 1 to 7s after stimulus
onset. An acoustic startle probe was present on 3/5ths of observation trials thus EMG was collected
on 18 trials within an observation block. EMG responses were measured 20-200ms after the startle
probe. ... 27
Figure 5. Mean subjective ratings of Realism; error bars represent standard error. A) Realism ratings for 2D and 3D images across the 6 points in time that participants were asked to rate images;
one set of images was used for time points 1-4 and a novel set of images was used for time points
5-6. 3D images rated significantly more realistic than 2D images; Realism ratings decreased
slightly for both stimulus types over time. B) There was a significant Dimension X Emotion
interaction. 3D negative images were rated more realistic than neutral and positive 3D images
while there was no difference in Realism ratings between emotion categories for 2D images. ... 31
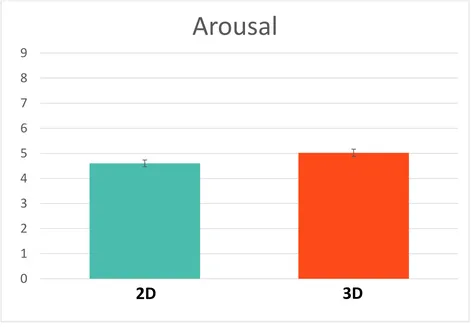
Figure 6. Mean subjective ratings of Arousal; error bars represent standard error. A) Arousal ratings for 2D and 3D images across the 6 points in time points. 3D images rated significantly
more arousing than 2D images; arousal ratings decreased slightly for both stimulus types over
time. B) Planned comparisons revealed 3D negative and positive images were rated more arousing
than neutral images while there was no difference in arousal ratings between emotion categories
for 2D images. ... 33
Figure 7. Mean subjective ratings of Danger; error bars represent standard error. A) Danger ratings for 2D and 3D images across the 6 points in time points. 3D images rated significantly more
dangerous than 2D images. B) There was a main effect of emotion in the expected direction
ix
by Emotion interaction. 3D negative and neutral images were rated more dangerous than their 2D
counterparts but there was no difference in danger ratings for positive images. ... 35
Figure 8. Mean subjective ratings of Approachability; error bars represent standard error. A) Approachability ratings for 2D and 3D images across the 6 points in time points. B)
Approachability ratings showing main effect of emotion (Positive > Neutral > Negative). There
was a significant Dimension by Emotion interaction. 3D negative and neutral images were rated
less approachable than 2D images. C) Emotion by Time interaction. D) There was a significant
three-way interaction. Between 2D and 3D images, negative images were significantly different
in time point 4, positive images in time point 1, and neutral images in time point 3. ... 40
Figure 9. Mean subjective ratings of Pleasantness; error bars represent standard error. A) Pleasantness ratings for 2D and 3D images across the 6 points in time points. There were no
significant differences between pleasantness ratings across dimension or time. B) There was a
main effect of Emotion with pleasantness ratings in the expected direction (Positive > Neutral >
Negative) for both stimulus types. ... 42
Figure 10. Mean maximum EMG amplitude after startle probe compared to a baseline; error bars represent standard error. A) EMG response to 2D images across blocks for each of the emotion
categories. Participants observed one set of images for blocks 1-3 and a novel set of images for
block 4. There was a significant decrease in EMG response over time for all emotion categories.
B) EMG response to 3D images over time for each emotion category. As with 2D images, there
was a significant reduction in EMG responding over time. ... 44
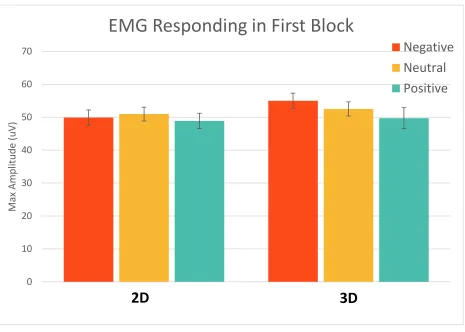
Figure 11. Mean maximum EMG amplitude in the first block of the experiment; error bars represent standard error. There were no significant differences in initial responding between 2D
and 3D images. There was also no significant emotional modulation of the eye blink startle
response... 45
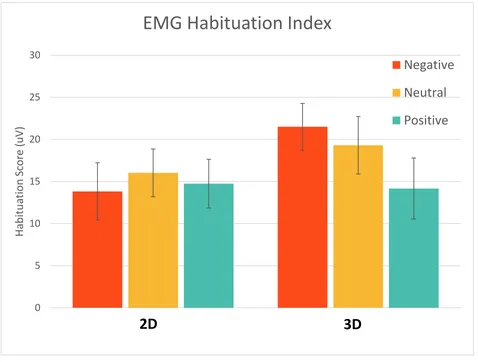
Figure 12. EMG Habituation Index; error bars represent standard error. There was no significant difference in habituation effects between the two dimensions. ... 46
x
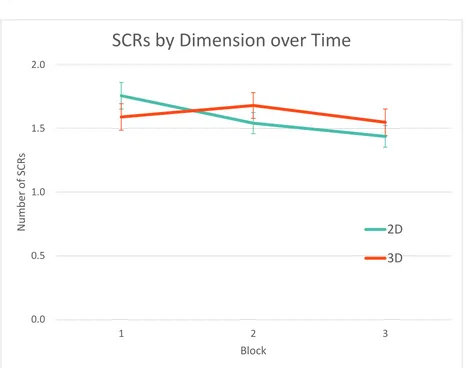
Figure 14. Mean amount of SCRs; error bars represent standard error. A) Number of SCRs to 2D images across blocks for each emotion category. B) Number of SCRs to 3D images across blocks
for each emotion category. C) Number of SCRs by Dimension across time. The number of SCRs
in response to 2D images decreased across blocks while there was no difference in SCRs to 3D
images across blocks. ... 50
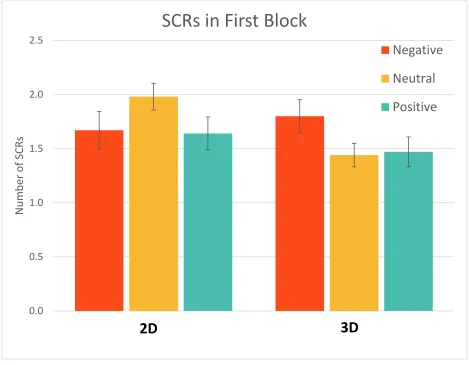
Figure 15. Mean number of SCRs in the first block of the experiment; error bars represent standard error. There was a significant difference in initial responding between 2D and 3D neutral images
where 2D elicited more SCRs but no difference between negative or positive images between the
two dimensions. Neutral 2D images elicited more SCRs than positive 2D images but there was no
other significant difference between images of different emotion categories within a dimension.
... 51
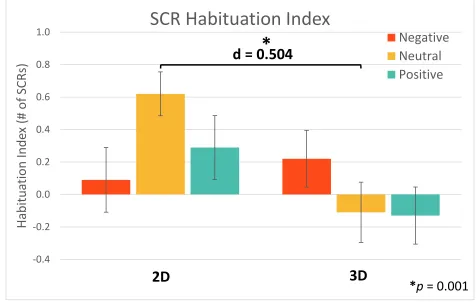
Figure 16. SCR Habituation Index; error bars represent standard error. There was no significant difference in habituation effects between the two dimensions. ... 52
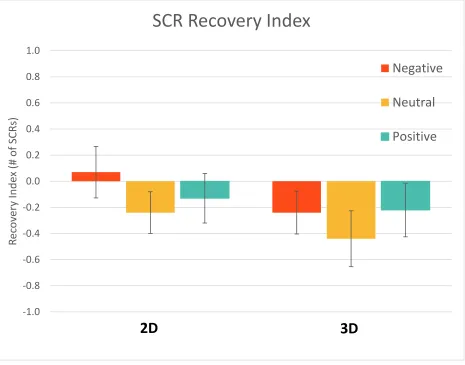
Figure 17. SCR Recovery Index; error bars represent standard error. There was no significant difference in recovery effects between the two dimensions. ... 53
Figure 18. Impact of fear of insects and spiders on affective responding. A) No correlation found between FSQ scores and startle eye blink magnitude. B) No correlation found between FSQ scores
and number of SCRs. ... 56
Figure 19. Impact of trait anxiety on affective responding. A) No correlation found between trait anxiety scores and startle eye blink magnitude. B) No correlation found between trait anxiety
xi
List of Appendices
Appendix A: Subjective rating results of pilot study
xii
List of Abbreviations
ACC Anterior cingulate cortex
ANEW Affective Norms for English Words
ANET Affective Norms for English Text
ANOVA Analysis of variance
ANS Autonomic nervous system
CSEA Center for the Study of Emotion and Attention
DmPFC Dorsal medial prefrontal cortex
EMG Electromyography
EmoPics Emotional Picture System
FSQ Fear of Spiders Questionnaire
GAPED Geneva Affective Picture Database
IADS International Affective Digitized Sound System
IAPS International Affective Picture System
LGN Lateral geniculate nucleus
NAPS Nencki Affective Picture System
OASIS Open Affective Standardized Image Set
OFC Orbitofrontal cortex
PFC Prefrontal cortex
SAM Self Assessment Manikin
STAI State Trait Anxiety Index
SCR Skin Conductance Response
V1 Primary visual cortex
vlPFC Ventral lateral prefrontal cortex
1
CHAPTER 1
1
Introduction
Imagine you wake up on a typical Saturday morning with plans to meet your friend for breakfast at
a local cafe. This everyday scenario is imbued with emotions that guide our behaviour. The
happiness we feel when we walk outside to go to the cafe reinforces the health benefits associated
with sun exposure and exercise. The fear we feel when exposed to threatening situations, like a car
speeding past us as we cross the street, reminds us to be more cautious and aware of our
surroundings when walking by the road in the future. The disgust we feel when we find mould on
our bagel prevents us from consuming potentially harmful fungi. By recognizing our
friend’s emotional facial expression we are able to infer her internal emotional state and behave
accordingly. For example, if our friend was frowning we would recognize that she was upset and
our sense of empathy would compel us to ask what was bothering her. In this way, our ability to
recognize emotions and the impact that ability has on our own emotional responses allows us
to have successful social interactions and form fulfilling social connections. Not only do these
emotions guide our behaviour but typical emotion processing is essential for us to function
normally and successfully within the world around us.
1.1 Affective Cognitive Neuroscience
The field of affective cognitive neuroscience investigates the underlying neural mechanisms
involved in the integration of emotional and cognitive systems. Research in this field identifies the
brain areas responsible for emotional processing and the neural correlates behind emotional
experiences. Information gained from these studies have revealed the ways emotions can impact
the way we behave, learn, attend, remember, and interact socially.
Emotions have been described as “states elicited by rewards or punishers” where “a reward
[is] something for which an animal (which includes humans) will work, and a punisher as
something that an animal will work to escape from or avoid (Rolls, 2005, p. 1-2). This definition
clearly indicates how emotions can influence our decision making; emotional psychophysiological
2
punishments (Damasio, Tranel, & Damasio, 1991). One example of how emotion can shape our
behaviours is through fear conditioning. Fear conditioning is a form of associative learning
encoded by the amygdala where a previously neutral stimulus (conditioned stimulus) is coupled
with an innately fearful stimulus (unconditioned stimulus) until it too is able to produce a fear
response (Phillips & LeDoux, 1992). This form of learning is biologically advantageous as it
allows us to quickly recognize and respond to potentially dangerous situations. For example, if we
burn ourselves by touching a hot pan we learn to associate the pan with pain and will be more
cautious when handling it in the future. Emotion also biases our attention by enhancing the salience
of biologically relevant stimuli. We preferentially attend to emotional stimuli; we are able to locate
them within the visual field more quickly than neutral stimuli and we are less able to ignore them
(Ohman, Flykt, & Esteves, 2001; Williams, Matthew, & MacLeod, 1996). For instance, it would
be difficult to focus on driving if there was a wasp in the car with you, your attention would be
drawn to the threatening stimulus. Just as with attention, emotional events are preferentially
encoded into memory compared to neutral events. Flashbulb memories are the most compelling
evidence of this; they are extremely vivid, detailed memories of surprising events that cause an
extreme emotional reactions, usually associated with traumatic events such as the 9/11 terrorist
attacks (Brown & Kulik, 1977). Finally, emotional processing is crucial for successful social
interaction. By recognizing emotional facial expressions we are able to deduce what others are
feeling and share in those feelings with them (Blair, 2003; Blair, 1995). Our ability to empathize
with others facilitates our social interactions by ensuring that we conduct ourselves in ways that
are deemed socially appropriate. As the breadth of these studies suggest, emotional processing is
integral to normal functioning. In fact, it is so central to our wellbeing that abnormalities in
emotional processing are present in almost every neuropsychiatric disorder (Vuilleumier, 2005).
There are disruptions of mood in major depressive and bipolar disorder, fear and anxiety in anxiety
disorders, aggression in antisocial personality disorder, and empathy in autism and conduct
disorders to name a few. Affective cognitive research identifies how neural processing differs in
these disorders allowing for the development of interventions and treatments which can then be
tested and evaluated for effectiveness.
To perform this research, experimenters must elicit emotion within the controlled setting of
a laboratory. The most common way experimenters evoke emotion is by using visual stimuli,
3
are afforded a high level of experimental control; they can be sure that the stimuli appear consistent
between participants.
1.2 Brain areas involved in emotion processing
While vision allows us to more easily complete practical tasks, it also allows us to admire
paintings, regard our loved ones, or notice a spider crawling towards us. These types of stimuli
elicit an emotional response; they influence internal states which reflect reward or punishment
(Rolls, 1999). Emotion has such an impact on human cognition that it influences the way we
process sensory information. Compared to neutral stimuli, emotional stimuli are more attention
grabbing (Fenske & Raymond, 2006; Williams & Broadbent, 1986; Vuilleumier & Schwartz,
2001), more memorable (Cahill & McGaugh, 1995; Kensinger, 2009; Bradley, Greenwald, Petry,
& Lang., 1992), and are able to prime reflexive actions (Bonnet, Bradley, Lang, & Requin, 1995;
Both, Everaerd, & Laan, 2003). As such, the emotional pathways within the brain are widely
connected and have strong bidirectional connections to the visual pathway (Amaral, Behniea, &
Kelly, 2003; Price, 2003; Vuilleumier, 2005).
To better understand how emotion is able to accomplish this sensory modulation, we can
examine the neural correlates of emotion. One region central to the neural processing of emotion
and social behaviour is the amygdala, a bilateral structure within the medial temporal lobe
(Aggleton, 2000). It is involved in almost every aspect of emotional processing including emotion
regulation (Banks et al., 2007; LeDoux, 2007), fear conditioning (Davis & Whalen, 2001; Duvarci,
Popa, & Pare, 2011), and emotion recognition (Yang et al., 2002; Garavan et al., 2001). The
amygdala responds preferentially to emotional stimuli of both positive and negative valence (Yang
et al., 2002; Hamann, Ely, Hoffman & Kilts, 2002; Sphors et al., 2018). Amygdala activation has
been observed over a variety of emotionally evocative stimuli spanning different modalities and
forms; this includes aversive natural stimuli (Krusemark & Li, 2011; Kensinger & Schacter, 2006),
pleasant and negative events (Hamann, Ely, Grafton & Kilts, 1999), emotional films (Bride et al.,
2014), aversive smells (Zald & Pardo, 1997), fearful vocal expressions (Phillips et al., 1998), and
aversive tastes (Zald, Lee, Flugel, & Pardo, 1998). The amygdala sends more projections to the
ventral visual pathway than it receives (Iwai & Yukie, 1987; Amaral, Behniea, & Kelly, 2003)
4
TE; Iwai, Yukie, Suyama, & Shirakawa, 1987; Amaral & Price, 1984). This association between
the amygdala and area TE is implicated in reward learning. A lesion study conducted by Spiegler
& Mishkin (1981) found that macaques were only able to perform an object-reward association
task when both area TE and the amygdala were intact; lesions to either of these areas impaired task
performance. Since area TE is involved in object recognition, this suggests that the amygdala was
responsible for linking the stimuli with the reward. The amygdala also modulates responding in
the visual cortex in response to emotional facial expressions. Amygdalar lesions are associated
with a reduction in fearful face recognition (Morris et al., 1998; Adolphs et al., 1999; Adolphs,
Tranel, Damasio, & Damasio, 1995) and result in less activation in visual areas, such as the
fusiform and occipital cortex, when viewing fearful faces compared to healthy controls
(Vuilleumier et al., 2004). The amygdala’s ability to increase activation in the visual cortex in
response to emotional stimuli has also been observed in healthy adults when observing positive
and negative emotional stimuli (Frank & Sabatinelli, 2014) and threatening stimuli, with activation
in both the amygdala and visual cortex increasing with arousal (Bradley et al., 2003; Sabatinelli,
Bradley, Fitzsimmons, & Lang, 2005).
While the amygdala is considered a central structure within the pathways of emotion due to
its extensive connections throughout the brain (Amaral et al., 1992), the ventromedial prefrontal
cortex (vmPFC) and orbitofrontal cortex (OFC) are also significantly involved in emotion
processing. Both structures are within the prefrontal cortex (PFC) and have strong, bidirectional
connections with the amygdala (Ghashghaei & Barbas, 2002; Amaral & Price, 1984; Barbas & De
Olmos, 1990). Lesion studies suggest that both structures are involved in the emotional processes
which underlie personality. A study by Barrash, Tranel, & Anderson (2000) found that bilateral
damage to the vmPFC impaired emotional expression, emotional affect, interest, social behaviour,
and insight. Likewise, a study by Hornak and colleagues (2003) found that patients with bilateral
OFC lesions had deficits in emotion recognition of vocal stimuli, emotional affect, and social
behaviour. The deficits in social behaviour (which were judged by an informant) were caused
mostly due to the patients’ inability to recognize or express emotions or provide insight into
another’s state of mind. The OFC has also been associated with insight into self behaviour, deficits
5
Although these are exclusive, the amygdala, vmPFC, and OFC have been identified as
playing a key role in emotional processing and their function in this context illustrates how
extensive the connections are between brain regions responsible for emotion and other systems.
These structures respond to appetitive and aversive stimuli from every modality and yet visual
stimuli are used most often in research on emotion. It is important to evaluate the visual stimuli
used in these studies to ensure that they are not only effective at generating an emotional response
but also that they accurately represent the emotional stimuli encountered outside a research setting.
1.3 Psychophysiological measures of emotion
Along with neural and behavioural measures, emotional responses can also be studied through
measures of psychophysiological arousal.
Electromyography (EMG) is a measure of the electrical activity produced by muscle
stimulation. The startle eye blink response is a response of the sympathetic autonomic nervous
system (ANS) that is triggered by an unexpected stimuli, such as a loud burst of white noise. EMG
electrodes can be placed on the orbicularis oculi muscle surrounding the eye to measure the
magnitude of the eye blink response. Emotional modulation of the startle response is bidirectional
where the valence of the stimuli presented affects the direction of the modulation. Positive images
inhibit the startle response and negative images enhance the response (Vrana, Spence, & Lang,
1988; Bradley, Codispoti, Cuthbert, & Lang, 2001). Cuthbert, Bradley, & Lang (1996) illustrated
this modulation in a study where participants viewed pleasant, neutral, and unpleasant images
while being exposed to a startling stimuli (a burst of white noise). They found a valence by arousal
interaction where, compared to neutral images, startle eye blink magnitude was larger for negative
images (further increasing the more arousing the images were) and smaller for positive images
(further decreasing the more arousing the images were).
Skin conductance (SC) measures the electrical conductance of the skin which increases with
the level of sweat and oils present. As such, SC is used as a measure of arousal of the sympathetic
ANS which innervates the sweat glands in response to threatening or arousing stimuli. A skin
conductance response (SCR) is a rapid, transient increase in SC which can occur in response to
6
it is often used in emotion research. Unlike the startle eye blink response, the SC response to
emotional stimuli is unidirectional; SC increases in response to stimuli of both positive and
negative valence (Simons, Detenber, Roedema, & Reiss, 1999; Khalfa, Isabelle, Jean-Pierre, &
Manon, 2002). A study by Bradley, Codispoti, Cuthbert & Lang (2001) found that SC increases to
emotional images with arousal; the more emotionally arousing the image, the greater the response,
regardless of whether the images were of positive or negative valence.
Amygdala activation has been linked to changes in psychophysiological responding related
to fear, including SC and the startle eye blink response (Davis & Whalen, 2001; Wood, Van Hoef
& Knight, 2014; Laine, Spitler, Mosher, & Gothard, 2009). Like the amygdala, SC and the startle
eye blink response habituate to emotional stimuli. Bradley, Lang & Cuthbert (1993) conducted a
habituation experiment where participants viewed pleasant, neutral, and unpleasant images
repeatedly over three blocks while SCR, heart rate (HR), and startle eye blink EMG were
measured. All three psychophysiological measures showed the expected valence effects within the
first block and showed a large reduction in responding across the three blocks. While largely
reduced, the startle eye blink response still displayed significant valence effects by the end of the
final block while the other two measures no longer showed an effect. This persistence of valence
effects is why the startle eye blink response is the primary psychophysiological measure in the
current study. SC and EMG are often recorded together in studies of affective autonomic signalling
to get a more complete view of how the brain processes emotional information.
1.4 Emotion and decision making
Our emotions do not only impact our internal states, they also impact our behaviour. Emotions
influence our behaviour in ways that increase the likelihood of rewarding outcomes and decrease
the likelihood of punishing outcomes. The somatic marker hypothesis (Damasio, 1994) postulates
that emotional bodily responses (or ‘somatic markers’) are responsible for guiding decision
making behaviour. Activation in the vmPFC is correlated with autonomic responses to emotional
stimuli (Damasio, Tranel, & Damasio, 1990) so it is unsurprising that it has been implicated in the
somatic marker hypothesis. In a study using a gambling task, both controls and patients with
damage to the vmPFC were able to generate SCRs in response to rewards and punishments but
7
preceding riskier decisions (Bechara, Tranel, Damasio, & Damasio, 1996). From these results the
experimenters concluded that vmPFC patients were impaired in their ability to change their
autonomic responses in response to anticipated negative consequences. This study illustrates that
autonomic signals generated by the vmPFC may play a role in guiding our decisions. While the
somatic marker hypothesis has since been questioned (Dunn, Dalgleish, & Lawrence, 2006;
Caramazza, Deldin, Hauser, & Tomb, 2002; Maia & McClelland, 2004), other studies have
replicated the finding that autonomic signals related to emotion and their neural correlates play a
role in decision making related to rewards and punishments (Bechara, Damasio, Damasio, & Lee,
1999; Guillaume et al., 2009; Bechara, Tranel, & Damasio, 2000).
In addition to the vmPFC, the OFC and ventrolateral prefrontal cortex (vlPFC) are also
implicated in emotional decision making. Activation in the OFC has been linked to representations
of reward and punishment (Rolls, 1999) and reward evaluation and choice difficulty (Arana et al.,
2003). The OFC is involved in stimulus-reinforcement associated learning where a rewarding
stimulus (e.g. an appetitive food) is associated with a neutral stimulus (i.e. an image) until the
neutral stimulus alone becomes associated with reward (Rolls, 2000; Kringelbach & Rolls, 2004).
During stimulus-reinforcement learning tasks, activity in the medial OFC is correlated with
reward, with greater activation for greater gains, while activity in the lateral anterior OFC is
associated with punishment, with greater activation for greater losses (O’Doherty et al., 2001). The
OFC also represents outcome expectations and modulates associations between a stimulus and an
expected outcome in response to violations of these expectations (Mitchell, 2011). In this way, the
OFC impacts our behaviour by devaluing stimuli that are no longer rewarding (Gotfried,
O’Doherty, & Dolan, 2003). Similarly, the vlPFC is involved in changing behaviour in response
to changes in context (Mitchell, 2011). Lesions to the vlPFC result in impaired performance during
reversal learning tasks, where one stimulus is associated with a reward and another with a
punishment before the associations are reversed (Fellows & Farrah, 2003). This suggests that the
vlPFC is necessary for alterations in decision making based on new information related to the
reward and punishment value of certain behaviours. Taken together, these studies illustrate how
the PFC influences decision making by optimizing behaviours that will result in rewards and
8
There is a saying about how we should not let our emotions make our decisions but these
studies show that this would not only be difficult to accomplish but also maladaptive. Emotions,
presently felt or anticipated, guide our behaviour in part due to the autonomic signals we receive
or will experience once we make a decision. As previously mentioned, these autonomic signals
can then be used as a measure of emotional arousal and have been in many affective cognitive
neuroscience studies (Bradley, Lang, & Cuthbert, 1993; Kimmel & Gardern, 1986; Vrana, Spence,
& Lang, 1988; Codispoti, Ferrari, & Bradley, 2007). The present study will use two measures of
autonomic signaling to evaluate the differences in affective responding between emotional stimuli
of two different modalities.
1.5 Emotion and attention
Attention is a cognitive process where certain stimuli are selected for further processing while
other stimuli are neglected (Blair & Mitchell, 2009). The biased competition model of attention
postulates that stimuli within the environment compete for neural representation and cognitive
processing (Desimone & Duncan, 1995). As the name suggests, this competition is biased,
specifically by bottom up and top down processes. Bottom up processes prioritize stimuli based
on their low level visual features. Bottom up systems would bias attention towards stimuli that are
large, colourful, and have a high contrast ratio (Beck & Kastner, 2009). Top down processes
prioritize stimuli based on their higher order cognitive relevance. Top down systems would bias
attention towards task relevant stimuli, for example stimuli which appear in a particular location
within the visual field where participants were instructed to attend (Kastner, Weerd, Desimone, &
Ungerleider, 1998). In either case, the neurons representing these stimuli would become highly
active (Blair & Mitchell, 2009). The representation that generates the most activation will win the
competition for attention.
So far, the processes described here identify ways that mundane stimuli compete for attention
but a particular advantage is given to emotional stimuli. The preferential processing or enhanced
encoding of emotional stimuli is thought to be conferred via the bidirectional interaction between
the ventral visual stream and the amygdala (Pessoa and Ungerleider, 2004). Pessoa & Adolphs
(2010) proposed a model where emotional stimuli are recognized by the amygdala which amplifies
9
by tracer studies and studies of functional connectivity which have shown the amygdala is highly
connected to the ventral visual cortex (Amaral, Behniea, & Kelly, 2003; Vuilleumier, 2005) and
that activity in this cortex is intensified in response to emotional stimuli (Morris et al., 1998;
Pessoa, McKenna, Gutierrez, & Ungerleider, 2002). Just as the amygdala modulates activity in the
visual cortex, activity in the amygdala can be modulated. The PFC can modulate amygdala activity
to prevent emotional stimuli from reaching awareness (Amting et al., 2009). This modulation may
be a result of the PFC’s role in directing visual attention to emotionally salient information. A
study by Wolf and colleagues (2014) found that patients with vmPFC lesions exhibited deficits in
identifying emotional facial expressions. Eye tracking data revealed that this impairment was due
to the fact that patients were not attending to areas which would provide emotional information
(e.g. the eyes), regardless of which facial expression was being displayed.
Although these studies reveal that emotional stimuli are salient, there are still issues
associated with their use which has a negative impact on affective cognitive research. These
limitations will be discussed and addressed in the current study.
1.6 Difficulties with emotion research
Small effect sizes are expected in emotion research as brain areas responsible for emotional
encoding rapidly habituate to emotive stimuli (Plichta et al., 2014; Fischer et al., 2003; Wright et
al., 2000). Unsurprisingly, this includes the amygdala which not only responds to emotional stimuli
but also rapidly habituates to them (Plichta et al., 2014; Buchel, Morris, Dolan, & Friston, 1998;
Wedig, Rauch, Albert, & Wright 2005). A neuroimaging study conducted by Brieter and
colleagues (1996) found that the amygdala responds preferentially to faces of both positive and
negative valences and rapidly habituates to them. This pattern of activation and habituation within
the amygdala has been replicated in many studies featuring negative and positive stimuli (Wright
et al., 2001; Fischer et al, 2003). Habituation to emotional stimuli is a common phenomenon in
brain areas related to emotion; a neuroimaging study by Denny and colleagues (2014) found that
repeated presentation of aversive stimuli resulted in a decrease in activation in several brain areas
implicated in emotion processing including the amygdala but also the ventral PFC. Likewise,
Wright and colleagues (2001) found significant habituation effects with both happy and fearful
10
Emotion research is further restrained by ethical limitations. One of the central reasons why
ethical guidelines are used in research is to ensure the individuals participating in research are not
harmed. Although activation in brain areas related to emotion have been found to increase with
arousal (Garavan et al., 2001), there is a possibility that exposing participants to highly arousing
negative stimuli featuring death, violence, and/or gore may distress or traumatize some participants
and thus cause them harm. There is evidence to suggests that images alone are enough to negatively
impact an individuals’ emotional state; studies on media exposure following natural disasters or
terrorist attacks reveal that frequent exposure to distressing images can cause anxiety and increase
the likelihood of developing post-traumatic stress disorder (Ahern et al., 2002; Yeung et al., 2018;
Busso et al., 2014; Bodas, Siman-Tov, Peleg, & Solomon, 2015). As such, highly emotional
negative images are uncommon in emotion research even though they would evoke the most
compelling effects of emotion.
One possible solution to these issues would be to improve upon the emotional stimuli that
can be ethically used in emotion research by improving their level of realism. Emotional responses
may be more robust and sustained if participants’ experiences within the laboratory more closely
resemble an authentic, real life experience. One possible way to accomplish this would be to use
virtual 3D environments which are becoming more popular commercially in video gaming for
exactly this reason (LaViola, 2008; Tachi, 2013).
1.7 Visual processing in the brain
Vision allows us to observe, navigate, and easily interact with our environment (Barry, 1997;
Ekstrom, 2015; Cronin & Douglas, 2014). While not essential to daily living, having the ability to
see assists us in almost every aspect of our daily functioning from simple tasks like washing and
feeding ourselves to complex functions like operating a motor vehicle as we navigate through the
city on our way to work.
Visual processing begins with the eye when images are projected through the cornea
and lens onto the photoreceptors in the retina at the back of the eye (Enoch, Bedell, & Tobey,
1981). These photoreceptors then synapse onto a series of cells in the optic nerve which in turn
11
Hubel, 1963; Sefton & Swinburn, 1964). The LGN is divided into 6 layers, half of which receive
information from one eye and half receiving information from the other eye (Bishop, Kozak,
Levick, & Vakkur, 1962). This information corresponds to one visual hemifield; the left LGN
processes information from the right visual field while the right LGN processes information from
the left (Glees & le Gros Clark, 1941; Connolly & Van Essen, 1984). From here, visual information
finally moves on to the cortex for processing, the first stop being the primary visual cortex (V1) in
the occipital lobe (Hubel & Wiesel, 1974; Tootell, Silverman, & De Valois, 1981).
V1 processes basic visual features. Cells within V1 are sensitive to orientation; they respond
to lines pointed in a particular direction which allows them to detect edges and bars (Hubel &
Wiesel, 1977). After V1, a two pathway theory of vision has been suggested; a ventral ‘vision for
perception’ pathway for object recognition and identification and a dorsal ‘vision for action’
pathway for object location and action-guided behaviour (Goodale & Milner, 1992; Mishkin,
Ungerleider, & Macko, 1983; Goodale & Humphrey, 1998). The ventral pathway projects from
V1 to the temporal lobe and includes V2 (which also processes basic visual features), V4 (which
is involved in colour processing), and the inferior temporal lobe (Kobatake & Tanaka,
1994; Rousselet, Thorpe, & Fabre-Thorpe, 2004). The dorsal pathway projects from V1 to the
occipital and parietal lobes and includes V2, V3A and V5/MT (which are involved in motion
perception), and the posterior parietal cortex (McKeefry et al., 1997; Goodale, 2011).
While the LGN processes visual information from both eyes, the information is still
segregated within different layers. The first time visual information from both eyes actually
integrate is within the V1 (Hubel & Wiesel, 1959; Bridge & Cumming, 2001). Simple and
complex cells within the V1 use this information for edge detection (Hubel & Wiesel,
1962) but other cells respond to the fact that the visual information they receive form each eye is
slightly different (Pettigrew, Nikara, & Bishop, 1968; Heeger, Polonsky, Blake, & Braun,
2000). Since human eyes are horizontally separated by approximately 6 cm, objects fall on a
different part of the retina of each eye. This difference between the images projected onto each
retina is referred to as binocular disparity. Stereopsis is the process by which binocular disparity
is used to perceive depth. The binocular neurons in V1 alone are not enough for the conscious
perception of depth (Cumming & Parker, 1997; Cumming & Parker, 1999) but work in
12
Durand, Zhu, Celebrini, & Trotter, 2002), V3A (Felleman & Van Essen, 1987; Tsao et al., 2003;
Wang et al., 2016), and V5/MT (Cumming, DeAngelis, & Newsome, 1998; Wang et al., 2016).
While stereopsis provides the most compelling depth information, it is not the only way
humans are able to perceive depth. Monocular depth cues allow us to estimate distance with the
visual information from one eye. Some examples of monocular depth cues include shadows (Kim
& Anstis, 2016), occlusion (objects in front of other objects are perceived to be closer to the
observer; Palou & Salembier, 2013), relative size (smaller objects are perceived to be farther away
than larger objects; Sousa, Brenner, & Smeets, 2011), and motion parallax (when an observer is
moving, objects that move fast are perceived to be closer than objects that move slower; Gibson,
Gibson, Smith, & Flock, 1959).
1.8 Databases of affective stimuli
To facilitate research on emotion, several databases of standardized emotion-provoking stimuli
have been created for use worldwide. Visual stimuli are most commonly used in affective cognitive
research due to their convenience, the level of experimental control they afford, and their ability
to generate unique behavioural and psychophysiological responses corresponding to particular
emotional states (Mauss et al., 2005; Bradley et al., 1993; Rosenberg & Ekman, 1994). Many
databases of emotional visual stimuli have been created to aide in this research including the
International Affective Picture System (IAPS; Lang, Bradley, & Cuthbert, 1997), Geneva
Affective Picture Database (GAPED; Dan-Glauser & Scherer, 2011), the Nencki Affective Picture
System (NAPS; Marchewka, Zurawski, Jednorog, & Grabowska, 2013), the Emotional Picture
System (EmoPicS; Wessa et al., 2010), and the recently created and freely available Open
Affective Standardized Image Set (OASIS; Kurdi, Lozano, & Banaji, 2016). These databases
provide normative valence, arousal, and dominance ratings for thousands of emotional images
which cover the full range of valence and arousal dimensions, from very positive (e.g. happy
babies, dogs) to very negative (e.g. spiders, cemeteries) and low arousal (e.g. flowers, baskets) to
high arousal (e.g. erotic nudes, mutilated bodies).
The IAPS database was developed over 30 years ago and is now the most widely used
13
Center for the Study of Emotion and Attention (CSEA) with the goal of creating a standard set of
images which could be used universally in psychological and neuroscience research to allow direct
comparisons to be made between experiments and exact replication studies to be conducted (Lang
& Greenwald, 1988). Since its creation, new stimuli have been consistently added to the database
which is now comprised of over 1000 images across several different categories including images
that feature humans, animals, objects, and scenes (Lang, Bradley, & Cuthbert, 2008). The database
has been validated in many populations; most frequently with healthy adults but also adolescents
(Vasa et al., 2011; Truedsson et al., 2019), older adults (Gruhn & Scheibe, 2008; Rehmert &
Kisley, 2013), and clinical populations such as individuals with schizophrenia (Pankow et al.,
2013), fibromyalgia (Rhudy et al., 2013), and depression (Gollan et al., 2016). Subsets of the
database have also been tested across cultures with studies proposing different normative ratings
for certain cultures including Spain (Molto et al., 1999), Belgium (Verschuere, Crombez, &
Koster, 2001), Brazil (Ribeiro et al., 2005), India (Lohani, Gupta, & Srinivasan, 2013), and China
(Huang et al., 2015; Gong & Wang, 2016). Along with these cross-cultural validation studies,
IAPS is further trusted due to its reliability. IAPS images have a high internal consistency for
valence and arousal ratings with both dimensions having highly reliable split-half coefficients
when presented on paper (rs = 0.94 and rs = 0.94, p < 0.001) or on a computer (rs = 0.94 and rs =
0.93; Lang, Bradley, & Cuthbert, 1997).
Despite these benefits, there are some limitations to using this database. IAPS images are
not matched on low level visual features like colour composition, luminance, or contrast (Coan &
Allen, 2007) which can lead to differences in affective and visual processing (Bradley, Hamby,
Low, & Lang, 2007; Wiens, Sand, & Olofsson, 2011). In order to correct for these physical
differences, experimenters would need to use photoediting tools or select images based on their
low level visual features. A test of spatial frequency, such as a wavelet analysis (Delplanque et al.,
2007), would then need to be conducted to confirm that the images were not significantly different
on these features. Another issue is that, while there are an extensive number of images in the IAPS
database, the number of stimuli in some specific categories have been found to be limited
(Marchewka, Zurawski, Jednorog, & Grabowska, 2013; Wessa et al., 2010; Dan-Glauser &
Scherer, 2011). This is an issue for experiment designs that require many trials such as fMRI, EEG,
or repetition experiments where the number of stimuli must be large enough to prevent any
14
so widely used may also be one of its determinants. Many participants in psychological research
are university students who participate in many studies. Thus the more studies that use IAPS
images, the more likely participants are to have seen these images before which would lower their
emotional impact (Marchewka, Zurawski, Jednorog, & Grabowska, 2013).
Along with the IAPS, the CSEA has created several other emotion-provoking databases
including the International Affective Digitized Sound system (IADs), the Affective Norms for
English Words (ANEW), and the Affective Norms for English Text (ANET) which provide
normative ratings of emotion for sounds, English words, and brief English texts
respectively. These databases are also used in research on emotion although they are not as
extensive or ubiquitous as the IAPS.
Despite the number of emotional databases that exist there is still a lack of variety regarding
visual stimuli. While the visual databases do contain a vast variety of images of different emotional
content, they currently only feature 2D photographic stimuli. Moving forward, these databases
should take advantage of the recent advances in vision technologies and work to create a set of
standardized 3D images.
1.9 Questioning the ecological validity of 2D stimuli
For decades researchers have been using 2D stimuli under the assumption that they accurately
represent real objects. This assumption that has been challenged by recent studies which show
differences in neural, cognitive, and behavioural responding between the two stimulus types. For
example, a neuroimaging study conducted by Snow and colleagues (2011) investigated the
differences in repetition effects when using 2D images and real objects. Repetition suppression is
a phenomenon where there is a characteristic reduction in the hemodynamic response (a direct
measure of blood oxygenation levels within the brain and an indirect measure of neural activation)
when stimuli are presented repeatedly. The Snow study found that there was a change in activation
for 2D stimuli where there was a reduction in activation in a condition where stimuli were
presented twice compared to a condition where they were only presented once. Conversely, there
was no reduction in response when using real objects in the condition where stimuli were repeated.
15
participants viewed real objects suggesting an inherent difference in the way these stimuli are
perceived and processed.
As for cognition, Snow, Skiba, Coleman & Berryhill (2014) conducted a study which
compared memory effects between 2D images and real objects. There were three conditions where
participants were shown either black-and-white line drawings, coloured photographs, or real
household objects. Participants then completed a free-recall task, where they wrote down as many
stimuli as they remembered, and a recognition task, where they just had to state whether they had
seen the object or not. Participants in the real object condition performed significantly better on
both tasks whereas performance did not differ in the colored photograph or line drawing
conditions.
The differences in responding between these two stimulus types extend to behavioural
responses as well. Bushong, King, Camerer, & Rangel (2010) conducted a neuroeconomics study
which compared the differences in valuation judgements between real objects and 2D images of
those objects. Participants gave real objects significantly higher valuations than 2D images,
increasing their willingness to pay for the item by 40-60%.
Taken together, these studies show a fundamental difference in the way 2D images and real
objects are processed. Therefore, they raise questions about whether the results gained from studies
which use 2D stimuli can be generalized to make claims about real world experiences as they have
been in the past.
Several studies have been conducted to delineate the processes behind these observed
differences in responding between 2D images and real objects. These studies most commonly
focus on whether these differences exist because real objects can be interacted with in a purposeful
way whereas 2D images cannot. One such study was an action priming study by Squires,
Macdonald, Culham & Snow (2016). Action priming refers to the observation that viewing an
object before being asked to interact with that same object facilitates grasping (Valyear et al.,
2011). Interestingly, this study found that there was no difference in action priming between 2D
images of tools and real tools. Although this study showed no difference in behavioural responses
due to the interactive nature of real objects, a study by Gomez, Skiba, & Snow (2018) showed that
16
task (where participants respond to a central image which is flanked by two distractor images)
compared to 2D or 3D images only when the objects were graspable. As soon as a barrier was
placed between the object and the participant, the differences in attentional effects disappeared.
Further, a study by Marini, Breeding & Snow (2019) found that real objects elicited greater
activation in action-related brain areas and brain areas related to stereopsis compared to 2D images.
Taken together with past research, these studies suggest that the differences observed between real
objects and other visual stimuli may be due to differences in visual processing and the fact that
real objects are interactive.
While these studies provide a compelling argument that the brain responds differently to 2D
images and real objects, this does not mean that all experiments should attempt to use real stimuli.
While real objects would provide the most ecologically valid results, they are not always feasible
to use within a laboratory setting, especially with research related to emotion. Biologically
significant visual stimuli such as threat related stimuli (e.g. spiders, wolves) and social stimuli (e.g.
emotional facial expressions) would be difficult to present in a controlled and consistent manner
across participants. Even the act of storing and presenting these stimuli would be difficult in studies
with designs that require many stimuli or many trials. In cases where using real stimuli is not
possible, a compromise may be made by using 3D images. Just as with real objects, there is
evidence to suggest that there are differences in responding between 2D and 3D stimuli. A study
conducted by Rooney, Benson, & Hennessy (2012) compared participants’ perception of and
psychophysiological arousal to scenes from films presented in either 2D or 3D. Participants in the
3D film condition gave higher ratings of realism and had a higher heart rate compared to
participants in the 2D condition. This difference in subjective ratings was replicated in a study by
Gaebler and colleagues (2014) where participants rated a 3D film more immersive compared to
the 2D version of that film.
While these studies provide intriguing results, most studies on emotion still use static 2D
stimuli. To date, we are aware of only two prior studies that compared 2D and 3D emotional
images. These were two neuroimaging studies conducted by Dores and colleagues (2013, 2014)
which investigated the difference between pleasant, unpleasant, and neutral scenes presented in
2D and anaglyph 3D. These studies discovered greater activation in the amygdala for unpleasant
17
frontal gyrus for both pleasant and unpleasant 3D scenes. Despite these promising results, these
studies alone are not enough to conclude that 2D and 3D images produce different effects of
emotion. The emotional scenes created for these studies were computer generated, giving both 2D
and 3D stimuli a cartoonish appearance instead of looking like actual photographs of real scenes.
Given the evidence that photographic 2D images and real objects are already known to engage the
visual system and related systems in fundamental different ways (Snow et al., 2011; Gomez, Skiba
& Snow, 2018; Marini, Breeding & Snow, 2019), it cannot be assumed that computer generated
images would engage these systems in the same way as either stimulus type. Also, these studies
used an anaglyph technique to create the illusion of depth. Red-cyan anaglyph glasses affect the
colour of the stimuli further reducing its appearance of realism. Additionally, ghosting (where
images appeared doubled as an image designed for one eye bleeds through to the other) is common
with anaglyph glasses which impairs the stereoscopic effect and reduces image quality by blurring
the edges of objects in the foreground (Woods & Rourke, 2004). Most emotion research does not
use generated 2D images but 2D photographs of actual stimuli. So even if 3D
computer-generated images do elicit greater effects of emotion compared to computer-computer-generated 2D images,
this does not indicate that either have greater effects than realistic 2D images. Additional research
needs to be conducted comparing photorealistic 2D and 3D emotional images before conclusions
about differences in processing can be drawn.
1.10 Thesis objectives and hypotheses
Even though humans perceive the world in three dimensions, almost all prior studies on vision and
emotion have used 2D stimuli. It was believed that 2D images were able to elicit responses that
closely resembled those that would be experienced in the real world but recent research challenges
this belief by revealing differences in neural, cognitive, and behavioural responding between 2D
images and real objects (Snow et al., 2011; Snow, Skiba, Coleman & Berryhill, 2014; Bushong et
al., 2010; Gomez, Skiba, & Snow, 2018). While the differences between 2D images and real
objects are being explored, there is very little research comparing 2D and 3D images in the field
of affective cognitive neuroscience. Research in this area could be especially beneficial for this
field where small effect sizes are expected as brain areas and psychophysiological responses
rapidly habituate to emotional stimuli (Breiter et al., 1996; Plichta et al., 2014; Bradley, Lang, &
18
resistant to repetition effects (Snow et al., 2011). This leaves a gap in current knowledge, there are
no studies we are aware of that explore whether there are differences in affective responding
between photorealistic 2D and 3D emotional images.
The overall objective of this thesis is to determine if 3D images can be used to improve
stimulus realism and be used in emotion research to achieve more reliable effects of emotion. We
predict that, compared to 2D images, 3D images will elicit greater affective responses.
Specifically, we predict that 3D images will:
1. Receive higher subjective ratings of realism and emotion;
2. Initially elicit increases in psychophysiological responding;
3. Be more resistant to habituation effects; and
4. Experience a greater recovery of response when novel emotional images are
presented after habituation.
The difficulties associated with emotion research increase the likelihood of committing a
Type I error; effects may be missed due to the small or rapidly diminishing effects of emotion. The
aim of this study is to determine whether classic emotion research methods can be improved upon
by using stimuli that more closely represent real world experiences to bolster effects of emotion to
ensure they are not wrongly overlooked. Unlike previous research, the present study will use
photorealistic stimuli presented with 3D shutter glasses to more directly compare classic,
photographic 2D stimuli to realistic 3D stimuli. The results of this study could expand beyond
emotion research and inform all studies which use visual stimuli on how to improve effect sizes
19
CHAPTER 2
2
Methods
2.1 Participants
Fifty-three participants (32 female, 21 male; mean age, 22.4; range, 18-35 years) from Western
University took part in the current study. Three participants were excluded for being unable to
distinguish between 2D and 3D stimuli (less than a 1-point difference in mean visual
dimensionality scores between the two stimulus types). Of the 50 remaining participants, EMG
and SCR data were collected from 45 participants. Participants were recruited from flyers posted
around campus. All participants were screened for vision and psychiatric disorders and had normal
or corrected-to-normal vision. Even though only participants with normal or corrected-to-normal
vision were recruited, the Randot Stereo Vision Test (2018) was employed to ensure that all
participants displayed normal depth perception. Eligible participants had a visual acuity score of
50 arcseconds or better, one participant was excluded for having a stereoacuity score greater than
400 arcseconds. All participants provided written informed consent and received monetary
compensation at a rate of $15/hour. This study was approved by the University of Western Ontario
Research Ethics Board.
2.2 Stimuli
A 3D stimulus set was created by photographing 39 plant and taxidermic entomological
specimens. The stimulus set consisted of 6 plant specimens, 16 beetle specimens, 3 wasp specimen,
12 butterfly specimens, and 2 arachnid specimens. One 2D and one 3D image was created of each
specimen to create a stimulus set of 78 images. To create the stimuli, the specimens were
positioned on a rock in front of a white background. Foliage was added to the background to
provide additional monocular depth cues. A digital camera was placed approximately 188 cm away
from the specimen, although images were later cropped and resized to optimize
three-dimensionality when the images were viewed at 30 cm. To create the 2D images, two pictures
were taken of the specimen from an established center line. To create the 3D images, one picture
20
to the right of a center line to mimic the distance between human eyes. StereoPhoto Maker
(Version 5.10; 2015) was used to superimpose the two images and merge them into a single .JPS
file. The physical properties of the images were matched as closely as possible. Even though the
specimen varied in size, the rock and foliage were consistent throughout the stimulus set in size
and position. The images were then matched for colour, luminance, and size using MATLAB
(2018a). To adjust colour and luminance, the top left corner of each image (which did not feature
any objects) was measured as the average background colour and brightness. The rest of the image
was adjusted so the background had an RGB of [230 230 230]. All images were sized to 1582 x
1315 pixels, with the background consistent and target centered in each image. For 3D images
there was a 30 pixel separation between the left and right images (each 15 pixels away from the
center). These stimuli were displayed using NVIDIA 3D Vision Photo Viewer on an ASUS
24-inch 3D gaming monitor (MG248Q) using NVIDIA 3D Vision 2 Goggles.
A subset of 36 of the 78 images in our stimulus set were chosen to use in the main study
based on participants’ ratings in a pilot study (see Appendix A for mean ratings). Stimuli were first
split into three groups based on pleasantness ratings from a pilot experiment (Fig. 1); the images
with the top third of pleasantness ratings were considered ‘pleasant’ (mean ratings between 6.33 – 8.17), the middle third ‘neutral’ (mean ratings between 4.31 – 5.77), and the bottom third ‘unpleasant’ (mean ratings between 1.58 – 3.38). Six images were then chosen from each emotion
category based on visual dimensionality ratings; images with the greatest disparity in visual
dimensionality ratings between the 2D and 3D version of the images were chosen (mean disparity
4.13 points). These images were chosen as the main study examines the effect of visual dimension
on affective responding; thus, the images with the greatest perceived difference in visual
dimensionality would be best suited to reveal any differences in responding between 2D and 3D
stimuli if such a difference exists. Six stimulus subsets were created from these 36 images so that
there was one 2D and one 3D image from each emotion category in each set. Subsets were created