Scholarship@Western
Scholarship@Western
Electronic Thesis and Dissertation Repository
November 2018
Experimental Investigation of the Heat Source Orientation on the
Experimental Investigation of the Heat Source Orientation on the
Transient Flow and Thermal Behaviour of Phase Change Material
Transient Flow and Thermal Behaviour of Phase Change Material
During Phase Transition
During Phase Transition
Steven Jevnikar
The University of Western Ontario
Supervisor Siddiqui, Kamran
The University of Western Ontario
Graduate Program in Mechanical and Materials Engineering
A thesis submitted in partial fulfillment of the requirements for the degree in Master of Engineering Science
© Steven Jevnikar 2018
Follow this and additional works at: https://ir.lib.uwo.ca/etd
Part of the Energy Systems Commons, and the Heat Transfer, Combustion Commons
Recommended Citation Recommended Citation
Jevnikar, Steven, "Experimental Investigation of the Heat Source Orientation on the Transient Flow and Thermal Behaviour of Phase Change Material During Phase Transition" (2018). Electronic Thesis and Dissertation Repository. 5777.
https://ir.lib.uwo.ca/etd/5777
This Dissertation/Thesis is brought to you for free and open access by Scholarship@Western. It has been accepted for inclusion in Electronic Thesis and Dissertation Repository by an authorized administrator of
i
The present study reports the characterization of transient flow and transient thermal behavior of phase change material (PCM) during solid-liquid phase change (melting) through experimental investigation. Two specific aspects of the current work, both important in the field of latent heat thermal energy storage, are to investigate the influence of the flow behavior within liquid PCM on the melting and heat transfer processes, and the impact of heat source orientation on the underlying melting and heat transfer processes. A relationship between heat source orientation and the Nusselt number was discussed. The results show that the fluid velocity is critical for both the heat transport within the liquid domain and the overall melting pattern and rate. These results further extend the understanding of phase change and the associated heat transfer processes in the PCM and provide comprehensive benchmark data for the improvement of numerical models simulating the solid-liquid phase change process.
Keywords
ii
I would first like to express my thanks and gratitude to my supervisor Dr. Kamran Siddiqui, for his above and beyond support throughout both my undergraduate and graduate degrees. He was a major reason why I decided to further my education into the Graduate program and I am thankful for the opportunities he has provided me.
I would also like to thank my colleagues and faculty members who provided me support and helped me during my study. Their assistance for all problems, big or small is sincerely appreciated.
iii
Abstract ... i
Acknowledgments... ii
Table of Contents ... iii
List of Tables ... vi
List of Figures ... vii
Nomenclature ... ix
Notation/ List of Symbols (in order of appearance)... ix
Abbreviations ... xi
Chapter 1 ... 1
1 Introduction ... 1
1.1 Energy Storage ... 4
1.1.1 Mechanical Energy Storage ... 5
1.1.2 Electrochemical Energy Storage ... 5
1.1.3 Thermal Energy Storage ... 6
1.2 Comparison Between Types of Energy Storage ... 9
1.3 Phase Change Materials ... 11
1.4 Literature Review... 12
1.4.1 Investigation of Heat Transfer Characteristics ... 14
1.4.2 Heat Transfer Enhancement ... 16
1.4.3 PCM-based TES Applications ... 18
1.5 Motivation and Knowledge Gaps ... 19
1.6 Thesis Objectives ... 20
1.7 Thesis Layout ... 21
iv
2.1 Preliminary Experimental Setup Designs ... 22
2.1.1 First Iteration ... 22
2.1.2 Second Iteration ... 23
2.1.3 Third & Fourth Iteration ... 25
2.1.4 Fifth Iteration ... 27
2.2 PCM Enclosure (Final Iteration) ... 27
2.3 Thermal Energy Storage Medium ... 30
2.4 Heating Circuit ... 31
2.5 Particle Image Velocimetry ... 33
2.5.1 Working Principal of PIV Technique ... 33
2.5.2 Implementation of PIV Technique... 34
2.6 Thermocouple Temperature Measurements ... 37
2.7 Experimental Uncertainty ... 40
2.8 Data Analysis ... 40
2.8.1 PIV Velocity Fields... 40
2.8.2 Plotting of the Velocity Data ... 42
2.8.3 Temperature Field Data ... 42
2.9 Conclusions ... 43
Chapter 3 ... 44
3 Results and Discussion ... 44
3.1 Spatial-Temporal Behavior of the Transient Melting Process ... 44
3.2 Solid-liquid Interface Tracking ... 59
3.3 Time History of Melted Fraction ... 62
v
3.6 Time History of Specific TC Temperature Readings ... 67
3.7 Cumulative Sensible and Latent Heat Absorbed Energy ... 71
3.8 Transient Nusselt Number Analysis ... 73
3.9 Transient Rayleigh Number Analysis ... 75
3.10 ... Conclusions 80 Chapter 4 ... 81
4 Conclusions and Recommendations ... 81
4.1 General Conclusions ... 81
4.2 Contributions... 84
4.3 Future Recommendations ... 84
References ... 86
vi
Table 1: Polyfin thermo-physical properties [55], [92] ... 30
Table 2: Average velocity in boundary regions for all tilt angles, at 80, 240 and 600 minutes ... 56
vii
Figure 1: Estimated shares of global anthropogenic GHG, 2014 [6] ... 2
Figure 2: World CO2 emissions by sector [6] ... 3
Figure 3: Sensible and latent heat storage principles ... 8
Figure 4: Breakdown of primary and secondary PCM classifications [23] ... 11
Figure 5: Initial PCM enclosure ... 23
Figure 6: Schematic of the second iteration of the PCM enclosure ... 24
Figure 7: Schematic of third enclosure iteration ... 26
Figure 8: Highlighted bubbles from dissolved gasses during lauric acid melting ... 27
Figure 9a: PCM experimental enclosure (insulation removed) ... 28
Figure 10: Complete experimental setup ... 32
Figure 11: Schematic highlighting tilt angle of entire enclosure ... 33
Figure 12: Experimental setup, highlighting PIV optics and camera mount ... 35
Figure 13: Temperature profiles at three TC positions along the mid-horizontal plane of the enclosure for periodically removed and permanent insulation cover. Right side of figure highlights the three TC positions within the enclosure. ... 37
Figure 14: Thermocouple horizontal and vertical spacing within PCM enclosure. All values are in mm. ... 39
Figure 15: Original capture image (i), interface detected image through algorithm (ii) and generated binary image (iii) ... 41
viii
(ii) 8-degrees and (iii) 18-degrees. Units in [°C]. ... 46
Figure 18: Velocity field, resultant velocity, and temperature field for (i) 0-degrees, (ii) 8-degrees and (iii) 18-8-degrees at time 40 minutes. Velocity plot units in [cm/s], temperature plot units in [°C]. ... 48
Figure 19: Velocity field, resultant velocity, and temperature field for (i) 0-degrees, (ii) 8-degrees and (iii) 18-8-degrees at time 80 minutes. Velocity plot units in [cm/s], temperature plot units in [°C]. ... 50
Figure 20: Velocity field, resultant velocity, and temperature field for (i) 0-degrees, (ii) 8-degrees and (iii) 18-8-degrees at time 120 minutes. Velocity plot units in [cm/s], temperature plot units in [°C]. ... 52
Figure 21: Velocity field, resultant velocity, and temperature field for (i) 0-degrees, (ii) 8-degrees and (iii) 18-8-degrees at time 240 minutes. Velocity plot units in [cm/s], temperature plot units in [°C]. ... 53
Figure 22: Velocity field, resultant velocity, and temperature field for (i) 0-degrees, (ii) 8-degrees and (iii) 18-8-degrees at time 600 minutes. Velocity plot units in [cm/s], temperature plot units in [°C]. ... 55
Figure 23: Predicted interface location for (a) 0-degrees, (b) 8-degrees, (c) 18-degrees at times 60, 160, 240 and 600 minutes in rows 1,2,3 and 4, respectively. All plots use the same legend shown in (a). The black line denotes the actual interface and the red line is the predicted interface ... 61
Figure 24: Time history of melted fraction ... 63
Figure 25: Contour temperature plots for (a) 120 minutes, (b) 240 minutes and (c) 600 minutes. The 0, 8 and 18-degree cases are shown in column 1, 2 and 3, respectively. Units in [°C]. ... 65
ix
Figure 28: Total absorbed energy versus time ... 72
Figure 29: Nusselt number as a function of total melt time ... 75
Figure 30: Rayleigh number plotted against fraction of total melt time with varying bulk temperature and characteristic length calculations. All y-axes refer to the Rayleigh number and each plot uses the legend in (i) ... 78
Nomenclature
Notation/ List of Symbols (in order of appearance)
m Mass, [kg]
𝑄𝑠 Stored sensible thermal energy, [kJ]
𝑐𝑝 Specific heat capacity, [kJ/kg K]
∆𝑇 Change in temperature. [K]
𝐶𝐴𝐵 Thermochemical component
A Reactant A
B Reactant B
𝑄𝐿 Stored latent thermal energy, [kJ]
ℎ𝐿 Latent heat of fusion, [kJ/kg]
𝑄𝑇 Total heat storage capacity (sensible + latent), [kJ]
𝑐𝑝𝑠 Specific heat capacity, solid phase, [kJ/kg K]
x
𝑇𝑙 Melting temperature, [K]
𝑇2 Final/initial liquid temperature, [K]
𝛾𝑚 Melt fraction
𝑁𝑇𝑙 Number of interpolated grid coordinates above melting temperature
𝑁𝑇𝑙 Number of interpolated grid coordinates below melting temperature
𝑁𝑡𝑜𝑡𝑎𝑙 Total number of grid points within PCM domain
𝑇𝑙𝑚𝑒𝑎𝑛 mean temperature of the liquid PCM, [℃]
𝑄𝑠𝑒𝑛𝑠𝑖𝑏𝑙𝑒 Instantaneous sensible heat transfer, [kJ]
𝑡 Time, [sec]
𝜌𝑠 Solid density, [kg/m3]
𝜌𝑙 Liquid density, [kg/m3]
𝑇𝑚−𝑙𝑖𝑞 Mean liquid temperature, [K]
𝑇𝑚−𝑠 Mean solid temperature, [K]
𝑇𝑖 Initial PCM temperature, [K]
𝑉𝑙 Volume of liquid fraction, [m3]
𝑉𝑠 Volume of liquid fraction, [m3]
𝑄𝑙𝑎𝑡𝑒𝑛𝑡 Instantaneous latent heat transfer, [kJ]
xi
𝐿 Characteristic length, [m]
𝑘𝑙 Liquid PCM thermal conductivity, [W∙m-1∙K-1]
ℎ(𝑡) Surface-average heat transfer coefficient, [W∙m-2∙K-1]
𝑇𝑠 Average hot wall surface temperature, [K]
𝑇𝑖𝑛𝑡 Average temperature of solid-liquid interface, [K]
𝑅𝑎 Rayleigh number
𝑔 Gravitational acceleration, [m∙s-2]
𝛽 Coefficient of thermal expansion of the fluid, [K-1]
𝑇𝑏 Bulk temperature of the fluid, [K]
𝜈 Kinematic viscosity, [m2∙s-1]
𝛼 Thermal diffusivity, [m2∙s-1]
𝐿𝑖𝑛𝑡 Horizontal distance: hot wall to mid-point of the solid/liquid interface, [m]
𝐿𝑤𝑎𝑙𝑙 Characteristic length, horizontal width of enclosure, [m]
Abbreviations
GHG Greenhouse Gases
CAES Compressed air energy storage
TES Thermal energy storage
xii
PIV Particle image velocimetry
CCD Charge-coupled device
PID Proportional–integral–derivative
Chapter 1
1
Introduction
Energy is an indispensable part of everyday human life. Powering appliances in homes and offices, heating and cooling living spaces, traveling to and from work, and manufacturing goods all require some form of energy. By now, for most, it is expected that this energy supply will be reliable and available on demand. However, with growing concerns surrounding the scarcity of conventional energy resources and the environmental impact from the utilization of these fossil-based energy resources, there is a desperate and urgent need to explore alternative options to fulfill energy demand while mitigating the environmental damage. Furthermore, careful planning and consideration is also necessary to ensure a reliable supply of energy and livable environment for future generations [1].
Global demand for energy consumption continues to rise. Over the past two decades, from 1984 to 2004, primary energy consumption has grown by 49% [2]. This growth is forecasted to continue, with estimates predicting that by 2040, there will be a further increase of 28% in the global energy use [3]. The ongoing rise of global energy consumption can be attributed to, in part, a combination of increased growth in residential, commercial and transportation sectors partly due to increasing global population [4] and a growing middle class with a desire for an improved lifestyle [5]. This expanding middle class is most prevalent in emerging economies, where it is predicted that by 2020, the energy demand will exceed that of developed countries [2].
A significant consequence of this increased energy consumption (primarily from fossil fuels) is the rise in global greenhouse gases (GHG), where over half of the current emissions (in 2017) can be attributed to energy use (see Figure 1) [6]. There is a growing concern over these rising GHG and their negative impacts on the planet. These emissions are primarily in the form of CO2 which has steadily increased, doubling in the past 40 years
Figure 1: Estimated shares of global anthropogenic GHG, 2014 [6]
Rising GHG, including CO2 emissions have a determinantal impact on the environment,
Figure 2: World CO2 emissions by sector [6]
With the transition of energy generation towards more renewable sources, such as wind and solar, a significant restructuring of power generation, consumption, and use will be necessary. While the potential for clean energy is great, many renewable energy sources still suffer from new challenges not necessarily considered before. These include mismatch between supply and demand, fluctuation of the energy intensity with seasonal variation, dependency on current weather conditions and unpredictable availability of energy sources [10]. Ultimately, due to the intermittency of their supply (i.e. lack of wind, sun, etc.), renewable energy sources in their current form are not considered as reliable resources to provide consistent energy supply.
renewable energy sources, growing pressure is placed on developing methods to increase consistency. One such method to improve the consistency of energy supply from renewable resources is through energy storage [11]. Furthermore, with fossil fuels remaining a dominant energy source to meet rising energy demand, increasing pressure is placed on energy conservation as fossil fuel resources are finite. Energy storage is again a potential solution to conserve energy.
1.1
Energy Storage
Energy storage is an important component in both the conservation and utilization of generated energy. Through the storage of energy during off-peak times, or storage of excess and waste energy, the reliance on conventional energy resources can be reduced.
Within Canada, solar and wind energy are two of the fastest growing sources of electricity production [12]. Unlike conventional sources, such as fossil fuel or hydro, these types of sources are highly dependent on uncontrollable factors such as the availability of sunlight or wind. However, by utilizing stored energy, acquired during times when excess energy is available, supply can be provided at all times, even when the current generation sources may be reduced. This combination of generation and storage can mimic a more traditional type of energy production system [11].
Energy storage can be classified and divided into three primary categories: mechanical, electrical and thermal.
1.1.1
Mechanical Energy Storage
Mechanical energy storage is the most common large-scale type of storage. Mechanical storage is primarily in the form of pumped hydropower storage, where excess energy is used to store potential energy in the form of water that is pumped to higher elevation. Another form of mechanical energy storage which works on a similar principal, is compressed air energy storage (CAES) which uses excess energy to drive compressors, storing compression energy. Both storage methods are primarily utilized for large-scale and/or long-term energy storage [15]. Flywheels, another type of mechanical storage, converts excess energy into the form of rotational (kinetic) energy. However, unlike pumped hydropower storage and CAES, they are predominantly used for intermediate energy storage [16]. All types of mechanical storage require a relatively large footprint. Hydropower storage, which accounts for 99% of the total global storage capacity [17], use expansive reservoirs which are difficult to zone, and can negatively influence the surrounding environment [15].
1.1.2
Electrochemical Energy Storage
Electrical energy storage consists primarily of rechargeable batteries. These batteries are charged through a chemical reaction, induced by applying direct electric current. When discharged, the stored chemical energy is converted back to electrical energy. Today, electrochemical energy storage can provide very energy dense storage and it has the distinct advantage of allowing direct storage of electrical energy. However, it is often very costly to provide this storage on large scales. Therefore, while advancements have been made, it is still predominantly used with end-user storage, often utilized by consumers for temporary storage in personal devices [17].
charge and discharge. This makes them ideal for applications that often experience either a rapid surge of excess energy or are required to provide a burst of energy [15].
1.1.3
Thermal Energy Storage
Thermal energy storage (TES) is the storage or removal of internal energy in the form of heat. It can be subdivided into sensible heat, latent heat and thermochemical heat. Sensible and latent heat storage involve the transfer of thermal energy through a temperature gradient. Thus, to store either form there needs to exist a temperature difference between the transfer and storage medium. Thermochemical heat storage involves endothermic chemical reactions and are less dependent on existing temperature gradients. When choosing an appropriate storage medium, crucial criteria include high stability from thermal cycling and resistance to long term degradation of thermal properties [16].
1.1.3.1
Sensible Heat Storage
The most common form of thermal energy storage is sensible heat storage. Sensible heat storage involves increasing or decreasing the temperature, and therefore internal energy, of the storage medium. This storage medium could either be in a fluid state (liquid or gaseous) or a solid state. However, due to lower specific heat and pressurization problems, gaseous phases are not a feasible nor practical option for the thermal energy storage. Thus, a sensible heat storage medium is either in the liquid phase (e.g. oil, water, molten salts) or the solid phase (e.g. stone, concrete, metal). Since sensible heat storage only involves temperature change in a single phase, a high specific heat capacity is desirable [19].
The amount of thermal energy stored in a medium is dependent on the mass and temperature change. It can be expressed as a function of the mass, 𝑚 [kg], the specific heat capacity, 𝑐𝑝 [kJ/kg K] and the change in temperature, ∆𝑇 [K]:
𝑄𝑠 = 𝑚𝑐𝑝∆𝑇 (1.1)
1.1.3.2
Thermochemical Storage
In thermochemical energy storage, reversible chemical reactions are used to charge and discharge the thermal storage. Primarily, these reactions occur in either the solid or liquid state. Furthermore, this type of storage often uses a mixture of both sensible and/or latent heat storage in combination with the chemical reactions. The primary advantage of this type of storage is the ability to store thermal energy over long periods of time. While sensible and latent heat storage are often used for relatively short-term storage, thermochemical energy storage can be used for long term applications, such as seasonal storage. This is because, due to the chemical reactions in this type of storage, little energy is lost over time and the storage medium can be left at ambient temperatures [20]. Thermochemical TES involves an endothermic reversible reaction, where the thermochemical component 𝐶𝐴𝐵, with the addition of heat, is separated into reactants, 𝐴 and 𝐵, which can then be independently stored. When combining the reactants, heat is released.
𝐶𝐴𝐵+ heat ⇄ 𝐴 + 𝐵 (1.2)
Thermochemical storage is still in its infancy of development, with minimal commercial presence. Currently, high costs and degradation of chemical reactants during thermal cycling are primary barriers preventing this type of storage from commercial use. Additionally, these types of endothermic reactions occur above 0 Celsius, limiting their use in cold temperature and cooling applications [21].
1.1.3.3
Latent Heat Storage
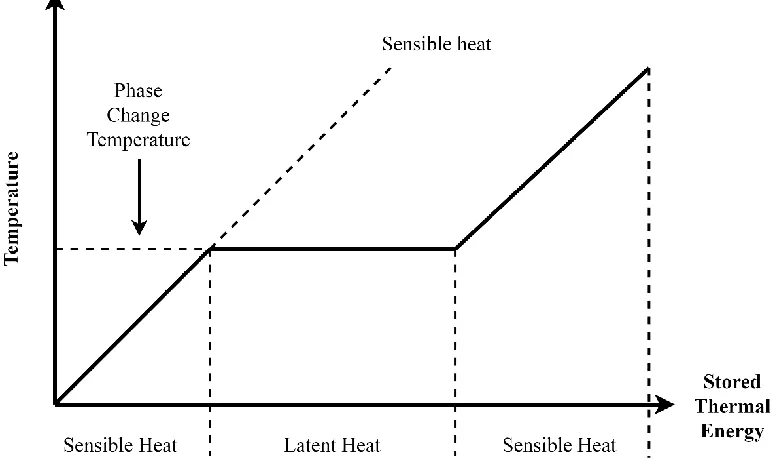
primarily between solid and liquid states due to practical reasons. Since heat is transferred during phase transition, unlike sensible thermal energy storage, this type of storage is theoretically near isothermal. This is beneficial for applications which require a constant temperature or when the charging and discharging of heat is within a narrow temperature band. Furthermore, the latent heat storage is attractive due to the high energy storage density, gained from the exploitation of the enthalpy of phase change. Using equal masses of water as an example, to match the total latent heat energy released during ice freezing, it would require sensibly cooling liquid by 80 Celsius [19]. The differences between sensible and latent heat storage is shown in Figure 3. Latent heat can store thermal energy at a nearly constant temperature, whereas sensible heat storage requires a large temperature difference, i.e. the greater the temperature of the medium, the more heat stored.
Figure 3: Sensible and latent heat storage principles
The total energy stored in latent heat storage can be expressed as a function of the materials mass, 𝑚 [kg], and latent heat of the phase change of the material, ℎ𝐿 [kJ/kg].
Materials used in latent heat storage are referred to as phase change materials (PCMs). Water is one of the most common type of PCM, however, it is primarily limited for cooling applications. By using PCMs with different melting temperatures, latent heat storage can be implemented over a wide temperature range. Currently, there are commercially available PCMs with melting temperature ranging from below -33 Celsius, to above 850 Celsius [22].
Often latent heat storage systems use a combination of both sensible and latent heat storage. That is, as the storage medium is warmed or cooled in a single phase, sensible heat storage occurs, while the latent heat storage occurs during phase transition. Therefore, for a system utilizing solid-liquid phase transition, the total heat storage capacity is often expressed as [23]: 𝑄𝑇 = ∫ 𝑚𝑐𝑝𝑠𝑑𝑇 𝑇𝑙 𝑇1 + 𝑚ℎ𝐿+ ∫ 𝑚𝑐𝑝𝑙𝑑𝑇 𝑇2 𝑇𝑙 (1.4)
Where 𝑚 [kg] is the total mass of heat storage medium, 𝑐𝑝𝑠 and 𝑐𝑝𝑙 [kJ/kg.K] are the
specific heat capacities for the solid and liquid phases, respectively, and ℎ𝐿 [kJ/kg] is the latent heat of fusion. The variables, 𝑇1, 𝑇𝑙 and 𝑇2 [K] refer to the initial/final (depending on melting/freezing) solid temperature, the melting temperature and the final/initial (depending on melting/freezing) liquid temperature, respectively. The first term corresponds to the sensible energy of the solid PCM, the second term is the absorbed/released latent energy and the third term is the sensible energy of the liquid PCM [23].
1.2
Comparison Between Types of Energy Storage
technology. Previous reviews of each energy storage technology have been considered [16], [24], [25]. These reviews base their comparisons on criteria such as cost, energy density, durability, efficiency and environmental impact.
Focusing on the most impactful benefits and drawbacks, a brief comparison can be conducted. Mechanical energy storage is frequently utilized in large scale applications, allowing for direct storage of excess potential energy such as pumped hydropower. However, mechanical energy storage often requires a large footprint. This limits its application in dense urban areas where energy demand is greatest [26]. Additionally, since this storage type often requires the conversion between multiple forms of energy, namely between electrical and mechanical (kinetic/potential) energy, significant losses can occur during this conversion. Electrochemical energy storage has a high energy storage density and allows for direct electrical energy storage. There exists great potential for both small and large-scale applications, with the most likely scenario involving end user storage in residential applications. However, the cost, short lifespan and environmental impact from insufficient established recycling programs remain as challenging concerns which cannot be overlooked [27]. Thermal energy storage can be used in small, medium and large-scale applications. It has the advantage of allowing direct energy transfer from heat sources, such as solar energy or waste heat. Additionally, the potential exists to incorporate TES with existing systems, to improve the efficiency of energy consumption. Latent heat thermal energy storage (LHTES) is attractive because it [16], [24]:
• Provides high energy storage density
• Is available over an extensive range of temperatures and,
• Provides nearly isothermal thermal energy storage; ideal for temperature sensitive
applications.
1.3
Phase Change Materials
Phase change materials are materials with relatively high latent heat storage capacity. A wide range of PCMs have been developed with various melting and vaporization temperatures, increasing their suitability for a wide range of applications.
Depending on the type of material used for LHTES, PCMs can undergo solid, solid-liquid and solid-liquid-gas phase transitions. Solid-solid-liquid transition is the most commonly used phase transition, because as mentioned earlier, during liquid-gas transformation, there are high volume and pressure changes creating practical problems. Similarly, there are very few PCMs exist which have suitable transition temperatures for solid-solid transformation, limiting their use [19].
PCMs can be classified into three primary groups: organic, inorganic and inorganic/organic eutectics. A breakdown of each primary and secondary classifications is shown in Figure 4 [23].
Numerous reviews have been conducted of PCM classifications, comparing properties, characteristics, and highlighting benefits/drawbacks of each group [28],[29],[30],[31],[32]. In summary, the primary focus is on desirable thermal, physical and chemical properties when selecting a suitable PCM for LHTES. The advantageous thermal properties include:
• Appropriate phase transition temperature
• High latent heat capacity
• High thermal conductivity.
Thermal conductivity is a concern for many PCMs, as most suffer from low conductivity in all phases; an undesirable trait for thermal energy storage.
Desirable physical properties of PCMs include: small volume change between phases, high density and congruent melting. In terms of chemical properties, high chemical stability with thermal cycling, low reactivity with storage enclosure, low toxicity and low flammability are all desirable traits. Additionally, PCMs that do not suffer from supercooling are advantageous.
Selection of the appropriate PCM depends on the type of application. Often, the critical selection criteria is dependent on the operating temperature range of the proposed application, and as such, the ideal PCM can be selected with a phase transition temperature in that range. The PCM selection can then be further narrowed through selection methods considering required thermal, physical and chemical properties [23].
1.4
Literature Review
Some of the earliest studies on two-phase heat transfer considered only one-dimensional conduction and ignored effects of natural convection in the liquid phases. These early works, most notably by Stefan in 1891 [33] on sea ice formation, continue to impact the scientific community. Although it requires significant assumptions, the mathematical model, commonly referred to as the Stefan problem, provides a reasonable approximation of the temperature distribution within a homogeneous medium undergoing phase change [34].
Presently, it is well established that natural convection plays an important role in liquid phase during melting. Studies conducted by Sparrow et al. [35] and Bathelt et al. [36] are two of the earliest published studies that experimentally investigated two phase melting while considering convective heat transfer. Sparrow et al. [34] concluded through experimental work that natural convection has a dominant role in the melting of a solid, and Bathelt et al. [35] found that a combination of the transient melt shape (i.e. solid-liquid interface), surface temperature and heat transfer coefficients contribute to the significance of natural convection. In both studies it was concluded that natural convection should be considered in both the analysis and design of phase change systems and should not be neglected.
1.4.1
Investigation of Heat Transfer Characteristics
Studies investigating the fundamental heat transfer characteristics present in phase change often utilize simplistic enclosure geometries. These enclosures are often either rectangular [39], [40], [41], cylindrical [42], [43], [44], [45], or spherical [46], [47]. Studies either include insulated walls, with one vertical/horizontal wall as the heat source (heated) and another as the heat sink (cooled) or only insulated walls and a single heated wall.
Commonly, it is determined that the melting process is dominated by conduction in the initial stages of heating when the heat transfer medium remains solid and after this initial stage, when melting is initiated, natural convection becomes the dominant heat transfer mode within the liquid region [48], [49], [50], [51], [52].
C.-J. Ho and R. Viskanta [53] experimentally, and numerically studied the melting of n-octadecane, isothermally heated from a vertical wall within a rectangular cavity. Comparison between experimental and mathematically predicted melt front profiles and volume fractions were conducted, finding increasing discrepancy between the two. This error was attributed to the neglection of volumetric expansion in the mathematical models and the coarseness of the utilized grid. It was concluded that melt rate, melt interface profiles and heat transfer are all significantly influenced by the buoyancy induced fluid motion in the liquid region.
Shokouhmand and Kamkari [49] investigated the heat transfer characteristics of lauric acid (an organic PCM) in an insulated vertical rectangular enclosure subjected to heating from a single vertical wall. Photographs, combined with temperature data, were used to infer flow structures and characterize the heat transfer processes. Four melt stages were observed: dominant conduction, transition, dominant strong convection and weak convection. Additionally, it was found that the intensity of the convection current decreases as the melt front moves away from the hot wall source, contributing to the reduction in the melting rate.
Kamkari et al. [50] further expanded upon their previous work [49], by investigating the effect of inclination angle on the heat transfer characteristics of lauric acid in a rectangular enclosure. Experiments were conducted with a heat source at 0 degrees (vertical), 45 degrees and 90 degrees (horizontal). It was found that the inclination angle of the heat source had a significant effect on both the heat transfer rate and the melting time of the PCM. It was suggested that these heat transfer enhancements were due to an increase in the natural convection currents present in the liquid PCM.
Benard et al. [54] also studied, both numerically and experimentally, the melting process in a rectangular enclosure with one vertically heated wall using pure n-octadecane as the PCM. All other walls were insulated and the wall adjacent to the hot wall was cooled and held at a constant temperature, 0.4 Celsius below the melting temperature. The solid-liquid interface, observed through imaging, combined with thermocouple temperature measurements were used to study the melting process. It was concluded that the behaviour of melting could be approximated as a two-stage process, before and after the melt front contacted the cold wall.
higher than that in the outer region. They also proposed a new Nusselt-Rayleigh numbers correlation to characterize the heat transfer during melting by a U-shaped heat source.
1.4.2
Heat Transfer Enhancement
As previously mentioned, a major drawback of many potential PCMs is the low thermal conductivity. This is especially the issue in organic PCMs which often have a liquid thermal conductivity of approximately 0.15 to 1 W∙m-1∙K-1 [56]. The poor thermal conductivity limits the ability to rapidly transfer heat in and out of the thermal storage. As such, a significant number of studies have been conducted to improve heat transfer in PCM based thermal energy storage. A detailed review of experimental and computational studies pertaining to the thermal conductivity enhancement of PCM was conducted by Fan and Khodadadi [57].
A common technique to enhance heat transfer is by using fins. Several studies have been conducted to introduce fins into the PCM medium [58], [59], [60], [61].
Bugaje [62] looked to overcome the slow thermal response of organic PCMs contained within plastic enclosures. Within a vertical glass column, paraffin wax with embedded aluminum fins was studied during heating and cooling. The fins were utilized to increase the overall heat transfer to/from the PCM. Overall melting and solidification times were recorded, and it was found that the phase transition time could be reduced by over two times during heating, and four times during cooling.
Other techniques to improve thermal conductivity involve adding highly conductive particles into the PCM medium to increase thermal conductivity. Often these particles are classified as nanoparticles which are embedded into the phase change material [64], [65].
Motahar et al. [66] experimentally investigated n-octadecane bounded in a rectangular enclosure heated from one vertical wall. All other walls were insulated. Nanoparticles were added to enhance the effective thermal conductivity of PCM. They observed a reduction in the melting rate as time progressed due to the reduction in the natural convection current, which was attributed to the increase in viscosity due to the nanoparticles addition.
Bashar and Siddiqui [67] investigated the transient melting and heat transfer characteristics of a nanoparticle-PCM mixture. Four different types of nanoparticles were tested: silver, copper oxide, aluminum and multi-walled carbon nanotubes and were added to the PCM, paraffin wax. A surfactant was added to the PCM to improve nanoparticle dispersion. Results show improvements to thermal performance for all studies with nanoparticles. It was shown that the addition of nanoparticles increases the PCM viscosity. However, the added surfactant was found to counteract the viscosity rise from the nanoparticles, limiting any negative reduction in the natural convection. Silver and the copper oxide nanoparticles were found to be the most effective, increasing heat transfer coefficients by approximately 18% and 14%, respectively. It was concluded that nanoparticle-enriched PCM is beneficial for latent heat TES.
Other methods of heat transfer enhancement include methods such as the addition of carbon fibers [65], [68] and with technological advances, carbon nanotubes [69].
1.4.3
PCM-based TES Applications
There are many studies investigating practical applications of the PCM-based TES systems. Dincer and Rosen [71] provided an extensive overview of various TES systems. Other studies also provided reviews on current and potential implementations of PCM-based TES systems [22], [72], [73].
Common PCM-based TES applications include, but are not limited to: storage of solar thermal energy [74], [75], [76], [77], passive cooling in buildings [78], [79], [80], integration with electricity generation, utilizing off-peak demand TES [81], [82] [83] and cooling from engines (combustion or electric) [84], [85].
Sun et al. [86] developed a novel TES system to recover heat from industrial residual water (IRW), a byproduct of a production process which was used during operation to heat the production plant. However, to meet heating requirements, production was required to run at less than 100% capacity to distribute the workload and allow continuous operation 24 hours of the day. By storing excess waste heat during production, the plant could run more efficiently at full capacity, and utilize stored thermal energy during plant shutdown. A mathematical model, validated with experimental data, was generated to test the potential application and benefits of a shell and tube TES system. It was concluded that such a system could meet heating requirements and provide over 10% energy savings for the overall production unit.
1.5
Motivation and Knowledge Gaps
As previously discussed, in efforts to reduce GHG, thermal energy storage can play a crucial role in two major aspects, 1) to conserve energy from conventional fossil fuel sources and 2) to store energy from intermittent renewable energy sources to improve the reliability and consistency of clean energy supply. Specifically, solid/liquid latent heat thermal energy storage has shown to have distinct advantages over other storage methods. This type of storage does have challenges however, particularly due to the complexity of the underlying physical processes involved during phase change. The heat transfer during phase change is complex and transient, with varying magnitudes of conduction and convection from the simultaneous changes in liquid and solid fractions. The complexity is further increased with the non-linear behaviour of the solid-liquid interface. As well, during natural convection, the orientation of the heat source/sink plays an important role in the overall processes involved.
It has been found that while previous experimental studies have advanced the scientific understanding of the heat transfer processes during PCM phase change, a significant gap remains in our understanding of the underlying liquid flow behaviour. Previous studies are limiting as they primarily focused on temperature distributions within the PCM. From these studies the flow behaviour was only inferred from the temperature measurements and imaging. Detailed characterization of the fluid velocity behavior throughout the liquid PCM is vital from two fundamental aspects:
1) The knowledge of the fluid flow dynamics is vital in the understanding of underlying natural convection processes. Convection heat transfer is dominant over the conduction heat transfer and hence its characteristics significantly influence the overall heat transfer.
Furthermore, numerical studies of PCM have acknowledged the limitations of the current numerical models to accurately capture the phase change processes [46], [88], [89], [90]. The numerical studies often accurately simulate melting behaviors at initial times. However, there is often an observed divergence between numerical and experimental results which typically increase both during times of strong natural convection and at later stages of melting. Detailed experimental characterization of the flow dynamics along with the temperature behavior can provide benchmark data that is invaluable for numerical studies through numerical model improvement. The knowledge advancement of the fundamental thermo-fluids processes during phase transition in a PCM-based thermal storage is essential to improve these energy storage systems for practical applications.
The present research is an effort towards this knowledge advancement by addressing some of the current knowledge gaps in the scientific literature related to the phase change process. While these knowledge gaps include both the charging and discharging aspects of a TES i.e. both melting and freezing processes of a PCM, due to experimental challenges, specifically during PCM freezing, the present research is focused on characterizing the melting behaviour of the PCM.
1.6
Thesis Objectives
The objectives of this experimental study are to:
1) Conduct a detailed investigation of the transient flow behavior in the liquid domain of phase change material during solid-liquid phase change (melting)
2) Conduct a detailed investigation of the transient thermal behavior of phase change material during solid-liquid phase change (melting)
3) Investigate the effects of heat source orientation on the transient heat transfer processes of natural convection-driven melting of the phase change material.
1.7
Thesis Layout
Chapter 1 provides background information on current energy supply, the need for energy conservation and renewable energy sources. The concept of energy storage is introduced and the role that this storage will play in the transition from convectional to renewable energy is highlighted. A summary of each type of energy storage is provided, and a comparison between each, with benefits and drawbacks, are discussed. A brief background of PCMs is provided and a literature review of solid-liquid phase change studies is included. Motivations, knowledge gaps and thesis objectives are also discussed.
Chapter 2 contains the methodology and experimental setup. Previous designs are discussed, highlighting the drawbacks which led to further iterations. The full details of the final experimental setup are presented, including the PCM enclosure, PCM properties, heating circuit, particle image velocimetry measurements, temperature measurements, experimental uncertainty, and data analysis processes.
Chapter 3 includes the results and discussion of recorded experimental data. Combined analysis of both velocity and temperature measurements enable a detailed discussion into the underlying heat transfer characteristics present during the melting of the PCM paraffin wax.
Chapter 2
2
Methodology and Experimental Setup
Experiments were conducted in a laboratory setting at the University of Western Ontario. Two primary experimental setups were constructed to measure and characterize 1) the fluid velocity fields within the liquid PCM region and 2) the temperature field within the entire (solid and liquid) PCM domain. The construction of the PCM enclosure, including materials, insulation, and the heat source, remained unchanged between both setups. Two enclosures were constructed to mitigate interferences between the Particle Image Velocimetry (PIV) imaging technique for velocity measurements and the temperature measurements.
2.1
Preliminary Experimental Setup Designs
Due to the novel approach of velocity fields measurement within liquid PCM, several iterations of the experimental setup, mainly the PCM enclosure, were considered before selecting the final version.
2.1.1
First Iteration
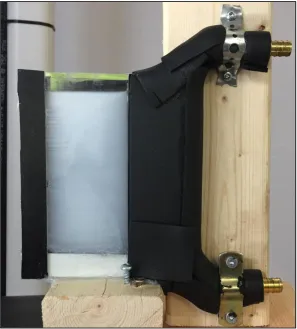
Figure 5: Initial PCM enclosure
2.1.2
Second Iteration
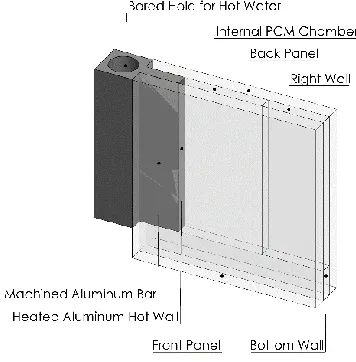
The second iteration of the PCM enclosure was constructed from a glass (front face) and acrylic (back face) sheet, both measuring 120mm high (H), 60mm wide (W) and 10mm deep (D). The left and bottom face of the enclosure was constructed from PVC plastic. The glass was chosen for its optical properties, with low distortion of the camera image. Again, paraffin wax was chosen as the PCM. In this iteration, the heat source was modified to address the previous issues of an uneven heating surface. A brass bar functioned as the heat source and a vertical wall, replacing the copper pipe. Instead, a copper pipe was brazed to the external face of the brass bar, and heated water was pumped through the pipe to provide the heat source.
of the PCM enclosure. A four-megapixel CCD camera was used, with a resolution of 2052 x 2048 pixels. To maximize the potential vector resolution within the liquid PCM, the studied field of view was reduced, capturing only the upper two thirds of the enclosure. As well, it was assumed that since the majority of the melted fraction would occur within the top of the enclosure, the chosen field of view would still allow sufficient velocity data collection. However, after data analysis, utilizing this experimental setup, it was discovered that the velocity behavior would require a full field of view for proper analysis and hence further testing was required.
2.1.3
Third & Fourth Iteration
Figure 7: Schematic of third enclosure iteration
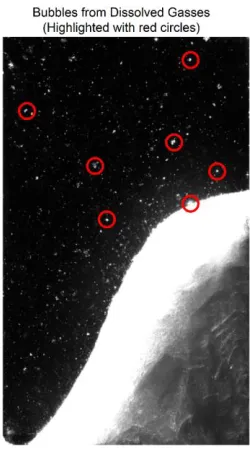
Figure 8: Highlighted bubbles from dissolved gasses during lauric acid melting
2.1.4
Fifth Iteration
Ultimately it was concluded that further analysis of the lauric acid would be unsuccessful and a fifth iteration was generated. This iteration utilized the same enclosure from the previous study, but replaced the lauric acid with the previous PCM, paraffin wax PCM. This design was the final iteration and was used for all analysis presented.
2.2
PCM Enclosure (Final Iteration)
of the captured camera images during both the PIV and temperature measurement. The left wall of the enclosure was constructed from a machined aluminum bar (k ≈ 205 W/m.K). This bar served as the heat source for the PCM. A square, 38mm section of the aluminum extended from the acrylic enclosure and within this region a hole was bored lengthwise to allow hot water to flow through the entire height of the bar, which served as the heat source.
The acrylic sheets were bonded together with an acrylic solvent glue, and the aluminum wall was epoxied directly to the acrylic sheets. This provided a leak proof design, which remained sealed when subjected to thermal expansion during heating.
The entire PCM enclosure, including aluminum heater, was further insulated with polystyrene boards (k ≈ 0.028 W/m.K), shown in Figure 9b. The polystyrene sheets were 25.4mm thick on each face. A section of the front and top faces was cut out of the insulation. This is highlighted as the semi-transparent cross hatched region in Figure 9b. This section was removed for short durations during imaging to provide optical access to the enclosed PCM (details will be provided later). Additionally, a 4mm thick sheet of fiberglass (k ≈ 0.038 W/m.K) was added to the sectioned cutout to reduce convective heat loss.
Figure 9a: PCM experimental
enclosure (insulation removed)
Figure 9b: PCM experimental
The PCM enclosure, camera, and PIV optics were mounted on a hinged steel frame, shown in Figure 10, Figure 11, and Figure 12. Figure 10 shows the full setup, including the heating circuit, steel frame, PCM enclosure and PIV laser light sheet. It is shown in the X-Y plane, providing a front view. Figure 11 displays the steel frame with optics, camera and PCM enclosure rotated at three angles. Figure 12 shows the same setup as the previous two figures, but in the Z-Y plane, highlighting the PIV optics and the camera supports. The hinged steel frame shown in both Figure 10, Figure 11 and Figure 12 allowed for the consistent alignment of all optics and camera positioning through adjustment of varying angles.
2.3
Thermal Energy Storage Medium
A commercially available mixture of paraffin wax and copolymer alloys in the form of white pellets, known as Polyfin, was utilized as the phase change material. The Polyfin, herein referred to as paraffin wax, was chosen as the PCM for its suitable visualization properties for PIV measurements. That is, in the solid state it has a white appearance and becomes transparent (optically accessible) in the liquid (molten) state. The average melting point of the paraffin wax is 55 Celsius. A summary of the Polyfin thermo-physical properties, as per published literature, is included in Table 1.
Table 1: Polyfin thermo-physical properties [55], [92]
Property Value
Melting Temperature [℃] 55.0
Density [𝐦𝐤𝐠𝟑] Solid: 934.5
Liquid: 775.0
Specific Heat [𝐤𝐠 ∙ 𝐊𝐤𝐉 ] Solid: 2.78
Liquid: 2.08
Thermal Conductivity [𝐦 ∙𝐊𝐖 ] Solid: 0.24
Liquid: 0.18
Kinematic Viscosity [𝐦
𝟐
𝐬 ]
5.234 x 10⁻⁶
Latent Heat of Fusion [𝐤𝐠𝐤𝐉] 180
Thermal Diffusivity [𝐦
𝟐
𝐬 ]
8.4615 x 10⁻⁸
2.4
Heating Circuit
Shown in Figure 10 are the components for the heating circuit which was utilized to melt the PCM. A recirculating hot water bath was used to heat the aluminum block. Water was heated in an insulated glass tank with two submersed 1000W electric heaters (110V, 9A and 220V, 4.54A). The two heaters provided redundancy in the chance of one heater failure. The 110V heater (Model: C10 from Haake), contained a mixing impeller to provide an isothermal water bath. To maintain a constant water temperature, both heaters were controlled with a proportional–integral–derivative (PID) controller and feedback was supplied through a K-type thermocouple. The water bath was held at a temperature of 80 Celsius and it was observed that the water temperature remained within ± 1 Celsius of the set value during all experiments.
Figure 11: Schematic highlighting tilt angle of entire enclosure
2.5
Particle Image Velocimetry
Particle image velocimetry was utilized during the investigation of the transient flow behavior in the liquid domain of phase change material during solid-liquid phase change.
2.5.1
Working Principal of PIV Technique
Particle image velocimetry is a non-intrusive measurement technique, enabling the measurement and recording of instantaneous velocity fields in a cross-section of the flow with high spatial resolution. A typical PIV setup consists of a CCD camera, synchronizer, high power laser (light source), optics (to convert a laser beam into a light sheet), and tracer particles.
method essentially ‘freezes’ the particles in place, eliminating motion blur from fluid motion. Additionally, the frequency of the synchronizer controls the time delay between subsequent images and laser pulses. An instantaneous velocity field is then obtained by processing consecutive camera images (for example, image one and image two) and determining the particles displacement.
Analysis of PIV data involves search and interrogation windows. Image one is divided into regions called interrogation windows. Image two is divided into larger regions, generally twice the size of the interrogation window, called search windows. By cross-correlating between the interrogation region and search window in both images, a peak signal is produced, identifying the common particle displacement between images. Cross-correlation is computed for all interrogation and search windows to provide the displacement of particles in the full image. The velocity vector in each interrogation window can then be calculated since the time delay between images is known. Combining all velocity vectors from each interrogation window provides the overall instantaneous velocity field.
2.5.2
Implementation of PIV Technique
In the present study, silver-coated hollow glass spheres were used as the tracer particles. To prepare the PCM for velocity measurements, the paraffin wax was melted outside of the enclosure and silver-coated hollow glass spheres were introduced into the liquid phase. The glass spheres, with an average diameter of 13 µm, were fully mixed into solution in a separate container, providing an even dispersion throughout the PCM before being added to the enclosure. The silver coated spheres were used as tracer particles for the PIV measurements.
the set of optical lenses affixed to the adjustable steel frame. The first optical lens (250 mm focal length, spherical lens, Thorlabs) reduced the diameter of the laser beam from 3-4mm to 2mm. The second lens (-12mm focal length, cylindrical lens, Thorlabs) split the beam into a horizontal light sheet. The light sheet (in the Z-direction), was directed towards a mirror, reflecting it vertically (Y-direction) towards the opening of the PCM enclosure. The light sheet spanned the entire mid-vertical plane of the enclosure.
The CCD camera was affixed on a rail, mounted to the steel frame (see Figure 12). The rail allowed the camera to traverse in the Z-direction, enabling the alignment of the camera field of view (see Figure 10 and Figure 12) to capture the entire PCM enclosure. Eight-bit images at a 12-Hz sampling rate were captured using an image acquisition system (DVR Express CORE, IO Industries) connected to a PC and controlled by an image acquisition software (CoreView, I O Industries). The raw images contained a colour channel, which was removed during export to greyscale images only.
Due to the slow nature of the melting progression, its behavior and associated flow field were captured at discrete time intervals. The melting rate slowed over time, and the interval of image collection increased as the experiment progressed. From the beginning of the heating process to first 60 minutes, images were captured every 5 minutes, beginning at 15 minutes. This delay in initial imagining was due to the lack of melted PCM from 0 to 15 minutes. From 60-120 minutes, images were captured every 10 minutes. The remaining time intervals are as follows: 120, 140, 160, 180, 210, 240, 300, 420, 600 minutes. At each of these time steps, the top and front insulation cover was removed during imaging. The cover removal is necessary for the velocity measurements by allowing both the laser light sheet to enter the PCM chamber through the top of the enclosure and the camera to capture images of the PCM via the front wall. The images were acquired for 30 seconds and immediately after both insulation covers were reinstalled.
Figure 13: Temperature profiles at three TC positions along the mid-horizontal
plane of the enclosure for periodically removed and permanent insulation cover.
Right side of figure highlights the three TC positions within the enclosure.
2.6
Thermocouple Temperature Measurements
The second set of experiments were focused on quantifying the temperature field within the PCM domain, utilizing the enclosure, support frame and heating circuit from the velocity measurement study. Temperature measurements were conducted using 64 independent Neoflon-PFA insulated T-type thermocouples (Omega Engineering), referred herein as TC. A wire gauge of 36 AGW was selected to minimize interference between the TC probes and the liquid flow of PCM. Each TC was rated for special limits of error (SLE) which corresponds to a temperature accuracy of ±0.5 Celsius. The thermocouples were constructed separately from the PCM enclosure and were initially calibrated using an isothermal water bath from InnoCal (Model #14576-00). The bath was varied from 25 to 80 Celsius in 5-degree increments. All 64 thermocouples were placed within the hot water bath. At each 5-degree increment, temperature measurements from all TCs were simultaneously recorded and time averaged over 30 seconds. These 12 temperature increments were used to determine a calibration equation for each thermocouple. The
Position
Position 2
results show an almost linear trend for all calibration equations. However, it was later determined that the temperature reading from the InnoCal was biased, and as such provided temperature measurements significantly lower than that of the 64 TCs. The maximum standard deviation of the recorded TC temperatures was 0.35 Celsius; less than the manufacturer stated accuracy of ±0.5 Celsius. Therefore, the TC temperature readings were compared with the known PCM melting temperature to determine accuracy. Comparison between the recorded TC temperatures and the melt fraction from camera images was conducted, finding good agreement between both. As such, it was determined that the temperatures recorded by the TCs were accurate, with little bias, and therefore did not require a third-party calibration.
Within the PCM enclosure, 47 thermocouples were arranged in a staggered grid pattern using 5 columns alternating between 9 and 10 rows. The spacing and TC locations are highlighted in Figure 14. The thermocouples were inserted into the PCM domain through holes drilled in the acrylic at the back of the enclosure. They were placed at a depth of 3mm, corresponding to the midplane of the paraffin wax. The column grid spacing was varied depending on the distance from the hot wall. It was assumed that the largest temperature gradients would exist in the region closest to the hot wall. Therefore, TC spatial resolution increased with increasing proximity to the heat source. A column of 10 TCs, denoted by red markers in Figure 14, were placed directly to the hot wall and epoxied to the surface of the aluminum bar. OmegaBond 101 epoxy (Omega Engineering) was used to secure the TCs to the hot wall. These TCs were used to measure the surface temperature of the hot wall.
discussion of the total absorbed energy for each tilt angle is provided in Chapter 3, however the results show that heat losses to the surroundings was minimal and did not significantly influence the overall melting behaviour.
Figure 14: Thermocouple horizontal and vertical spacing within PCM enclosure. All
values are in mm.
2.7
Experimental Uncertainty
The uncertainty in the velocity values was calculated for all cases (0, 8 and 18 degrees). Using the results of Cowen and Monismith [93] and Prasad et al. [94], the uncertainty was estimated to be 0.31 pixels, corresponding to approximately 1.73% of the average mean resultant velocity presented. As the light sheet was passing through two different mediums, air and liquid PCM, with a moving air-PCM interface (free surface), there was potential for light sheet distortion in the liquid domain. It was observed that for all cases, despite the movement, the free surface remained flat (also confirmed from PIV images). Hence, the free surface did not cause any distortion of the laser light sheet inside the liquid PCM domain.
The uncertainty in the temperature values is from a combination of both the TC uncertainty, and the data acquisition hardware. As provided by National Instruments, the data acquisition uncertainty is typically ±0.35 Celsius and ±1.1 Celsius for the NI9214 [95] and NI9211 [96], respectively. This uncertainty, as stated by National Instruments, accounts for gain errors, offset errors, differential and integral nonlinearity, quantization errors, noise errors and isothermal errors [96]. Therefore, accounting for the uncertainty in the TC themselves, the total uncertainty is ±1.6 Celsius and ±0.85 Celsius for the NI9214 and NI9211, respectively.
2.8
Data Analysis
2.8.1
PIV Velocity Fields
Instantaneous velocity fields were computed by cross correlating two images of a given image pair using an in-house computer code operated in the digital image processing software, Heurisko (Aeon, Germany). An interrogation window of 32 × 32 pixels, a search window of 64 × 64 pixels and a grid space of 16 pixels (with 50% overlap) were used. This corresponds to a resolution of 0.73mm × 0.73mm of the velocity vectors field.
interval was calculated by time averaging the velocity vectors at each grid point over 132 instantaneous velocity fields. As the time-scale of the melting process was very large (i.e. several hours), the velocity changes within the 22 seconds of data were found to be very small (almost negligible). The prime purpose of time-averaging over this short interval was to remove noise from the velocity field at a given discrete time. Hence, the mean velocity field is still a representative of the instantaneous velocity field at a given discrete measurement time.
A sample PIV image is shown in Figure 15(i). As figure shows, the regions of solid and liquid PCM are distinguishable due to the distinct gray values associated with each phase. An in-house image processing algorithm, developed in the MATLAB environment, facilitated the automatic detection of the solid-liquid interface by exploiting the distinct gray values of each phase. The solid-liquid interface detected by the algorithm is depicted in Figure 15(ii). A script was created to generate a binary image (Figure 15(iii)) through segmentation between the two phases of solid and liquid. The solid PCM was marked as the white region and the liquid PCM was marked as the dark region. These binary images were used as masks to exclude velocity vectors that were outside the liquid domain, since those were false vectors.
Figure 15: Original capture image (i), interface detected image through algorithm
2.8.2
Plotting of the Velocity Data
The plots of velocity vectors and contour plots of resultant velocity were generated from the mean velocity fields. In all plots, the light grey region denotes an area within the enclosure, but above the free surface of the liquid wax. To provide a proper comparison between all angles, the 0-degree cases were not fully filled to match the volume of the angled trials. Therefore, this grey region is visible in all cases. A black region corresponds to the solid, nonmelted wax and highlights the generated mask region where false vectors were removed. To improve the visual clarity by decreasing overlapping vectors, the resolution of the velocity vector plots was reduced by removing every other column and row of vectors.
2.8.3
Temperature Field Data
The temperature field at each angle and each discrete time was calculated through the recorded thermocouple data. As mentioned earlier in the experimental setup, 47 thermocouples were placed at discrete locations within the PCM domain. For a better perception of the temperature field, the temperature data was expanded to a grid of 635×350 via interpolation, covering the entire 127mm by 70mm enclosure domain. Each grid position corresponds to 0.2mm of the enclosure field. A natural neighbor scheme was utilized for the interpolation.
2.9
Conclusions
Different experimental setups were constructed to measure and characterize the velocity field within the liquid PCM and the temperature field within the entire PCM (solid and liquid) domain. Construction of the enclosure progressed through five iterations before the final design was selected. It was found that specific attention regarding enclosure material and its resistance to corrosion should be considered when using PCMs which are acidic in nature. Additionally, the selection of the PCM in regards to PIV measurements is important to note, as not all PCMs are suitable for velocity measurements due to undesirable properties. This may include a low solubility of dissolved gasses which can cause the formation of air bubbles that interfere with the instantaneous velocity calculations.
The final design of the PCM enclosure utilized clear cast acrylic sheets for their resistance to corrosion and optical accessibility for PIV measurements. An aluminum bar was used as the heat source for its high thermal conductivity and corrosion resistance. A hot water bath with a PID controlled heater was implemented to provide a consistent heat source. The entire enclosure, including PIV optics and thermocouple measurement devices, was mounted on a hinged steel frame which could be rotated. This aided in the investigation of heat source orientation on the PCM melting process by allowing a consistent experimental setup through multiple tilt angles.
Velocity measurements were recorded through the PIV technique, utilizing a synchronized laser and camera to capture images of the liquid PCM domain. Both the velocity fields and resultant velocity plots were generated from the processed PIV data. Temperature data was recorded through thermocouples which were imbedded into the PCM domain. Interpolated temperature fields were generated from the recorded thermocouple measurements.
Chapter 3
3
Results and Discussion
The high-resolution simultaneous imaging and temperature fields allowed for an in-depth qualitative and quantitative analysis of the transient melting process inside the PCM enclosure.
3.1
Spatial-Temporal Behavior of the Transient Melting Process
Figure 16: Temperature contours at 5 minutes of melting for tilt angles of (i)
0-degrees, (ii) 8-degrees and (iii) 18-degrees. Units in [°C].
conduction remained the primary mode of heat transfer in the bulk of the domain. Note that the heat loss from the top to the confined air was considerable only in the very early stages of heating.
Figure 17: Temperature contours at 20 minutes of melting for tilt angles of (i)
0-degrees, (ii) 8-degrees and (iii) 18-degrees. Units in [°C].
As conduction heating progressed and the melted region grew, a growing amount of liquid PCM was propelled by the increasing buoyancy forces, which exceeded that of the viscous forces. This led to the induction of buoyancy-driven natural convection which is shown beginning within the top of the enclosure in Figure 17 and growing in magnitude in Figure 18.
As the buoyancy-driven vertical flow reached the upper surface of the liquid PCM, due to its impermeable nature, the flow was diverted in the horizontal direction towards the solid PCM, satisfying mass conservation. The temperature of the diverted flow decreased upon contacting the cooler, solid, upper boundary. This temperature decrease resulted in a density increase, and the descent of the heavier liquid created a recirculation zone within the top of the enclosure (see Figure 18).
Figure 18: Velocity field, resultant velocity, and temperature field for (i) 0-degrees,
(ii) 8-degrees and (iii) 18-degrees at time 40 minutes. Velocity plot units in [cm/s],
As melting progressed, and the hot liquid contacted the cooler, solid PCM, further melting is induced. Heat is transferred from the warm liquid PCM causing it to cool and increase in density. This is visible in the temperature plots, which show a region immediately adjacent to the solid interface that contains cooler, liquid PCM. Figure 19 shows that there is an average temperature reduction of approximately 9 degrees Celsius between the center of the concave melt region, and the solid/liquid interface. The liquid parcels, now denser then the surrounding fluid, descend from the top of the enclosure. As they descend along the solid interface, additional heat is lost at the boundary, further increasing their density, and accelerating the flow. This is visible in the resultant velocity plots; the velocity of liquid PCM along the interface shows an increase as it descends from the top of the enclosure. Results in Figure 19 show that the velocity magnitude increased by approximately 300% as the PCM descends from the top to the mid height of the enclosure at all three enclosure angle configurations.
![Figure 1: Estimated shares of global anthropogenic GHG, 2014 [6]](https://thumb-us.123doks.com/thumbv2/123dok_us/1927735.1253147/15.612.125.514.95.307/figure-estimated-shares-global-anthropogenic-ghg.webp)
![Figure 2: World CO2 emissions by sector [6]](https://thumb-us.123doks.com/thumbv2/123dok_us/1927735.1253147/16.612.124.524.73.381/figure-world-co-emissions-sector.webp)
![Figure 4: Breakdown of primary and secondary PCM classifications [23]](https://thumb-us.123doks.com/thumbv2/123dok_us/1927735.1253147/24.612.144.501.387.645/figure-breakdown-primary-secondary-pcm-classifications.webp)