Western University Western University
Scholarship@Western
Scholarship@Western
Electronic Thesis and Dissertation Repository
8-1-2019 1:00 PM
Neurodevelopmental Outcomes of Infantile Hydrocephalus: An
Neurodevelopmental Outcomes of Infantile Hydrocephalus: An
fMRI Case Study
fMRI Case Study
Ikhlas Ahmed Hashi, The University of Western Ontario
Supervisor: Sandrine de Ribaupierre, The University of Western Ontario
A thesis submitted in partial fulfillment of the requirements for the Master of Science degree in Neuroscience
© Ikhlas Ahmed Hashi 2019
Follow this and additional works at: https://ir.lib.uwo.ca/etd
Part of the Cognitive Neuroscience Commons, Congenital, Hereditary, and Neonatal Diseases and Abnormalities Commons, Developmental Neuroscience Commons, Development Studies Commons, Neurology Commons, Neurosciences Commons, and the Pediatrics Commons
Recommended Citation Recommended Citation
Hashi, Ikhlas Ahmed, "Neurodevelopmental Outcomes of Infantile Hydrocephalus: An fMRI Case Study" (2019). Electronic Thesis and Dissertation Repository. 6313.
https://ir.lib.uwo.ca/etd/6313
This Dissertation/Thesis is brought to you for free and open access by Scholarship@Western. It has been accepted for inclusion in Electronic Thesis and Dissertation Repository by an authorized administrator of
Abstract
Ventricle dilatation caused by infantile hydrocephalus may result in extensive damage of the posterior cortex (parietal and occipital lobes). We hypothesize that pathological changes in the development of the posterior cortex can be linked to non-verbal learning disabilities in children with previous infantile hydrocephalus. This case study will investigate the neurodevelopmental outcomes of 3 treated hydrocephalus patients, when compared to a group of healthy control children (n = 12). Within the hydrocephalus group, patients displayed differences in non-verbal test performance as well as parietal brain activation during an fMRI number comparison task. We associated these differences with clinical variables such as prematurity of birth, age of onset, and timing of treatment. The methodology and findings of this case study offers new possibilities for future research of using fMRI in conjunction with behavioural assessments as a prognostic tool for studying the neurodevelopmental outcomes of pediatric patient populations.
Keywords
Summary for Lay Audience
Infantile hydrocephalus is a medical condition which involves the inadequate drainage of
cerebrospinal fluid (CSF), a clear fluid that circulates within the brain and spinal cord and can
occur during the first two years of life. There can be multiple causes of infantile hydrocephalus,
such as genetic malformations, premature birth that may lead to bleeding in the brain, and severe
bacterial infections of the brain such as meningitis. The buildup of CSF within the skull, can
result in an increase in pressure and damage to surrounding brain areas. The compression of the
developing brain may lead to negative outcomes in behavior and cognition, as well as the
emergence of various developmental disabilities during childhood. Due to the progression
pattern of hydrocephalus, areas of the brain located towards the back (posterior brain areas) will
experience greater damage and compression when compared to brain areas towards the front
(anterior brain areas). This current study will examine whether changes in development of the
posterior brain will lead to deficits in non-verbal learning, their associated cognitive outputs.
Non-verbal learning includes mathematics, visual processing, and spatial orientation skills. The
current study involves the cases of 3 treated hydrocephalus patients and a group of healthy
control children to assess and compare their behavioural outcomes. Functional MRI (fMRI) was
used to measure brain activity in parietal cortex during a number comparison task, children
played during the MRI scan. Differences in the behavioural test scores and brain activity were
found among the patients, we associated these differences to various clinical and socioeconomic
variables. The experimental design and findings of this study offer new avenues for future
research into using fMRI with behavioural tests as a tool for studying the developmental
Co-Authorship Statement
This thesis contains material from a manuscript, titled Nonverbal Learning Outcomes in Infantile
Hydrocephalus Patients: An fMRI Case Study, that is in preparation for publication in the journal
Clinical Neurology and Neurosurgery. The manuscript was co-authored by Ikhlas Hashi, Dr. Sandrine de Ribaupierre, Dr. Roy Eagleson and Estelle Ansermet. Ikhlas Hashi made
Acknowledgments
I would like to sincerely thank my supervisor, Dr. Sandrine de Ribaupierre, for her support and guidance. Thank you for taking me on as your master’s student. Thank you for your mentorship and providing me with the essential tools for my project to grow. I would also like to thank all of my academic advisors. Dr. Roy Eagleson and Dr. J. Bruce Morton thank you for insights, advice, your feedback during my advisory committee and lab meetings. Dr. Derek Mitchell, thank you for your guidance, feedback, and direction throughout the course of my master’s. I would like to
especially thank Dr. Daniel Ansari, for your support these past two years, whether that would be by providing me with essential feedback during my advisory committee meetings, setting up fMRI tasks, helping me with data analysis, or reviewing my thesis. Your intellectual insight, expertise, and work ethic is truly inspiring. I am grateful for your mentorship.
In addition, I would like to thank Ms. Bea Goffin, for her help with recruitment, providing me with behavioural tests, and teaching me about the mock scan. I would also like to thank the Centre for Functional and Metabolic Mapping staff, for helping me run the MRI scans. I would like to especially thank Mr. Scott Charlton, for helping ensure the MRI protocol ran so smoothly, and making scans enjoyable and fun for our young participants and their families.
To the Brain3dViz lab members thank you for your support throughout the course of my
master’s. I would like to especially thank Estelle Ansermet, for all your help with setting up my project, and teaching me how to run the behavioural tests. Thank you, Marcus Lo, for helping me recruit patients, collecting clinical data, and being the first participant during our pilot MRI scan. I would also like to thank my fellow trainees Daamoon Ghahari and Daiana Pur for all of their support and help.
I would like to thank my parents and siblings for their unwavering support, boundless motivation and endless encouragement. A special thanks to all my participants and their families for their consent and participation, whom without this project would have not been possible. Finally, I
Table of Contents
Abstract ______________________________________________________________________ i
Keywords ____________________________________________________________________ i
Summary for Lay Audience _____________________________________________________ ii
Co-Authorship Statement _______________________________________________________ iii
Acknowledgments_____________________________________________________________ iv
Table of Contents _____________________________________________________________ v
List of Tables _______________________________________________________________ viii
List of Figures ________________________________________________________________ x
List of Abbreviations _________________________________________________________ xiv
Chapter 1 ____________________________________________________________________ 1
1 Introduction ______________________________________________________________ 1
1.1 Infantile Hydrocephalus ________________________________________________ 1
1.2 Clinical Presentation and Symptoms ______________________________________ 3
1.3 Monitoring __________________________________________________________ 4
1.4 Treatment ___________________________________________________________ 6
1.5 Neuroanatomical Changes in the Posterior Cortex ____________________________ 8
1.6 Current Study _______________________________________________________ 10 1.6.1 Hypothesis________________________________________________________ 10
1.7 Study Objective ______________________________________________________ 11 1.7.1 fMRI Case Study___________________________________________________ 11
Chapter 2 ___________________________________________________________________ 14
2 Methods________________________________________________________________ 14
2.1.2 Hydrocephalus Patients ______________________________________________ 15 2.1.3 Control Group _____________________________________________________ 22
2.2 Experimental Protocol ________________________________________________ 23
2.3 Behavioural Assessments ______________________________________________ 25 2.3.1 Beery Visual Motor Integration _______________________________________ 25 2.3.2 Wechsler Preschool and Primary Scale of Intelligence and Wechsler Intelligence Scale for Children ________________________________________________________ 26 2.3.3 Number Sense Screener _____________________________________________ 29
2.4 Neuroimaging _______________________________________________________ 30 2.4.1 Functional Magnetic Resonance Imaging ________________________________ 30 2.4.2 MRI parameters ___________________________________________________ 31 2.4.3 Task Paradigm ____________________________________________________ 31
2.5 Data Analysis of fMRI data ____________________________________________ 33 2.5.1 Preprocessing _____________________________________________________ 33 2.5.2 First Level Analysis ________________________________________________ 34 2.5.3 Second and Group Level Analysis _____________________________________ 35 2.5.4 Region of Interest Analysis ___________________________________________ 35
Chapter 3 ___________________________________________________________________ 37
3 Results _________________________________________________________________ 37
3.1 Behavioural Results __________________________________________________ 37 3.1.1 Beery VMI _______________________________________________________ 37 3.1.2 WISC and WPPSI __________________________________________________ 38 3.1.3 NSS _____________________________________________________________ 41
3.2 Parietal Cortex Activation______________________________________________ 43 3.2.1 Number Contrast ___________________________________________________ 43
Chapter 4 ___________________________________________________________________ 52
4 Discussion and Conclusions ________________________________________________ 52
4.1 Discussion __________________________________________________________ 52
4.2 Limitations and Future Directions _______________________________________ 57
4.3 Conclusions _________________________________________________________ 59
References __________________________________________________________________ 60
Appendix ___________________________________________________________________ 76
Appendix A – MRI CFMM Protocol ___________________________________________ 76
Appendix B – Permission to use Dartmouth Database of Children's Faces ______________ 80
Appendix C – Research Ethics Board Approval Notice _____________________________ 81
List of Tables
Table 1: The parental educational score of the Hollingshead system for SES. Ranging 1 to 7,
with 1 equal to a seventh-grade education level, and 7 for graduate level degree or above. ... 15
Table 2: The list of participant ID, sex, age at time of participation, parental education, single vs
two parent family, and SES score of patients who were diagnosed and treated for hydrocephalus
during infancy. All of the patients were male, their age was measured at time of participation.
Patients 1A and 3A were excluded from further analysis as they were unable to complete the
experimental protocol of the study. ... 15
Table 3: The control group: participant ID, sex, age at the time of participation (in years and
months), parental education, single vs two parent family, and SES score of each control
participant. All controls completed the behavioural assessments and MRI protocol. ... 22
Table 4: Standard scores of VMI, visual perception and motor coordination. The mean standard
score was 100 with a standard deviation of 15. Relative performance (high, average, low) was
assessed by the converted standard scores. The “% of age group” is the percentage of individuals
who achieved a particular standard score range (Beery et al., 2010). ... 26
Table 5: Administered subtests of the WISC and WPPSI. Note the check marks indicate which
subtest was a part of the respective battery. ... 27
Table 6: Scaled scores of WPPSI and WISC subtests. The mean standard score was 10 with a
standard deviation of 3. The number of standard deviations (SD) from the mean scaled score as
well as the percentile rank equivalent are also listed (WISC-V; WPPSI-IV). ... 28
Table 7: List of the contrasts or the linear combination of parameter estimates (COPE) of the
GLM. The two-hypothesis contrast were designed to localize posterior activation: number
contrast (numbers > faces & shapes), and shape contrast (shapes > numbers & faces). The face
contrast (faces > numbers & shapes) was used as a control contrast... 34
Table 8: The MNI coordinates of the derived ROI from the fMRI analysis of the number
Table 9: Mean percent signal change of the right IPS for the control group, patient 2A, patient
4A, and patient 5A during the number contrast. Patients 2A and 4A had significantly greater mean percent signal change than the control group. While patient 5A had a significantly lower mean percent signal change when compared to the control group. ... 48
Table 10: Mean percent signal change of the left IPS for the control group, patient 2A, patient
4A, and patient 5A during the number contrast. Patient 2A had a significantly greater mean percent signal change than the control group. Patients 4A and 5A did not have a significant difference to that of the control group. ... 48
Table 11: Mean percent signal change of the right SPL for the control group, patient 2A, patient
4A, and patient 5A during the number contrast. Patients 2A and 4A had a significantly greater mean percent signal change than the control group. Patient 5A did not have a significant
difference to that of the control group. ... 51
Table 12: Mean percent signal change of the left SPL for the control group, patient 2A, patient
List of Figures
Figure 1: A common feature of infantile hydrocephalus is a large head circumference which can
be accredited to an increase in intraventricular pressure leading to ventricular dilatation (VD) and
consequently an increase in head circumference (From: Hydrocephalus, 2019). ... 1
Figure 2: Flow of CSF begins in the lateral ventricles then to the third ventricle via the foramen
of Monro, after which CSF passes through the cerebral aqueduct into the fourth ventricle and
leaving through the foramina of Luschka and Magendie (From: Cerebrospinal fluid, 2019;
Wright et al., 2016), where it enters the subarachnoid space, circulating around brain and spinal
cord until it finally reaches the arachnoid granulations, into venous circulation (From:
Cerebrospinal fluid, 2019). ... 2
Figure 3: (A) The cranial US of an infant with hydrocephalus. Note the dilatation of lateral
ventricles’ frontal horns, indicated by the yellow arrow, and temporal horn, indicated by the
white arrow(From: Hydrocephalus, 2019). (B) The US of a premature infant with marked
periventricular cysts, circled in red (From: Pediatric Radiology)... 5
Figure 4: T2-weighted MRI image of a two-year-old male hydrocephalus patient with
Dandy-Walker syndrome. (DWS) (From: Gaillard) ... 6
Figure 5: The ventriculoperitoneal (VP) shunt, shown in the above figure (From: About Your
Ventriculoperitoneal (VP) Shunt Surgery for Pediatric Patients), is the most common form of
ventricular shunts for infantile hydrocephalus treatment (From: Wright et al., 2016). ... 7
Figure 6: The structural MRI images of patient 2A, just before their VP shunt insertion (A, B)
and years after surgery (C). Figure 6A shows the progression of patient 2A from moderate to
severe ventricular dilatation. The T1 weighted image on the left (i) shows patients 2A at 2
months with moderate ventricular dilatation. As their condition progressed, patient 2A developed
severe ventricular dilatation at 4 months, shown in the T2 weighted image on the right (ii).
Patient 2A’s MRI structural images, just prior to their VP shunt insertion (B), years after surgery
(C) at 9 years of age. At the time of participation, patient 2A ventricles had substantially reduced
images are indicated as superior (S), anterior (A), posterior (P), right (R), left (L), inferior (I),
and posterior (P). ... 17
Figure 7: The preoperative coronal head US of patient 4A at 1 month (A) showing the frontal
horn of the lateral ventricles. Patient 4A had severe ventricular dilatation, however due to their
immediate shunt insertion, they did not have large volumes of CSF for a long period of time. The
structural MRI images of patient 4A (B) show reduction of ventricle size, years following
surgery, at age 6. Note, the partial formation of patient 4A’s cerebellum, as well as their enlarged
posterior fossa, a consequence of Dandy Walker Malformation. The directions of the MRI
images are indicated as superior (S), anterior (A), posterior (P), right (R), left (L), inferior (I),
and posterior (P). ... 19
Figure 8: The preoperative sagittal head US of patient 5A at 1 month (A) showing the moderate
dilatation of the frontal horns. Periventricular cysts, indicated by the green arrow, were found
around the ventricles at the site of hemorrhage (B). The structural MRI images of patient 5A
years following surgery, at age 8 is shown in Figure 8C. At the time of participation, patient 5A
ventricles had substantially reduced in size, due to the continual CSF drainage provided by the
VP shunt. The directions of the MRI images are indicated as superior (S), anterior (A), posterior
(P), right (R), left (L), inferior (I), and posterior (P). ... 21
Figure 9: MRI storybook, for young children. The Hidden Lighthouse (A) and the Magical
Tower (B) were created for younger participants during MRI mock scan. ... 23
Figure 10: Blood-oxygen-level dependent (BOLD) signal used to measure brain activation in
fMRI (Ekstrom, 2010; Magnetism; Ulmer, 2013). This graph illustrates the changes in blood oxygenated levels due to neuronal activation which can be correlated to signal on the recorded fMRI image. The initial dip is due to an initial increase in deoxygenated blood, which is followed by positive response due to an increase in oxygenated blood, leading to a peak in signal. The under-shoot is caused by a decrease in blood volume. ... 30
Figure 11: Example the stimuli given during the fMRI comparison task numbers (A), faces (B),
and shapes (C). Images of the child faces were provided by Dartmouth Database of Children's
Figure 12: The standard scores of Berry VMI assessment for hydrocephalus patients (2A, 4A,
and 5A) and the control group, shown in the above bar graph. The standard scores are also listed
in the table. We observed lower performance in Beery VMI for patients 2A and 5A and above
average performance for patient 4A. The mean standard score (100) of the norms is represented
by the black horizontal line. The standard error of the control group mean standard scores are
indicated by the error bars... 38
Figure 13: The scaled scores of selected subtests in the WISC for patients 2A, patient 5A and the
control group. The mean scaled score is represented by the black horizontal line. The verbal
subtests (information and vocabulary) are indicated in blue, while the non-verbal subtests (block
design and arithmetic) are indicated in green. Lower scaled scores were found in the non-verbal
subtests in WISC for hydrocephalus patients (2A and 5A), and average performance for the
control group. The standard error of the control group mean scaled scores are indicated by the
error bars. The scaled scores of the patients (2A and 5A) and the control group are also listed in
the table below the bar graph. ... 39
Figure 14: The scaled scores of selected subtests in the WPPSI for patient 4A and the control
group. The mean scaled score is represented by the black horizontal line. The verbal subtests
(information and vocabulary) are indicated in blue, while the non-verbal subtests (block design
and arithmetic) are indicated in green. Patient 4A had average scaled scores in the block design
and information subtests. While having low scaled scores in the vocabulary subtest and high
scores in the object assembly subtests. The standard error of the control group mean scaled
scores are indicated by the error bars. ... 41
Figure 15: The standard scores of NSS for patient 4A and control group. Similar standard
scores, of average performance, were displayed in both patient 4A and control group. The mean
scaled score is represented by the black horizontal line. The standard error of the control group
mean standard score is indicated by the error bar. ... 42
Figure 16: Parietal cortex activation during the number contrast: activated clusters in the
bilateral IPS (control group, patient 2A, patient 4A) and right SPL (patient 5A) activation during
the number comparison task. The above figure displays the results of a cluster-based analysis for
to MNI [X Y Z]. The panel shows the activation masks are in (left to right) sagittal, coronal,
axial view. The directions are indicated by superior (S), anterior (A), posterior (P), right (R), left
(L), inferior (I), and posterior (P). Brain signal intensity was displayed using the color bar, with
lower signal (z-statistic) being red and higher signal (z-statistic) intensity being yellow. ... 44
Figure 18: BOLD signal response in the bilateral IPS during each of the three contrasts
(numbers, faces and shapes) for single participants. The bar graph above displays the mean
percent signal change, a measure of BOLD signal, of the right IPS (A) and left IPS (B), during
the number contrast (numbers > faces & shapes), face contrast (faces > numbers & shapes) and
shape contrast (shapes > numbers & faces). Each participant is defined by the ID number,
furthermore the participants are divided by the blue dotted line, with the control group are at the
left side of the graph, while the patients are on the right end. The standard deviation of the
percent signal change for each contrast is indicated by the black error bars. The mean percent
signal change was highly variable between the individual participants showing no difference
between controls and patients. ... 47
Figure 19: BOLD signal response in the bilateral SPL during each of the three contrasts
(numbers, faces and shapes) for single participants. The bar graph above displays the mean
percent signal change, a measure of BOLD signal, of the right SPL (A) and left SPL (B), during
the number contrast (numbers > faces & shapes), face contrast (faces > numbers & shapes) and
shape contrast (shapes > numbers & faces). Each participant is defined by the ID number,
furthermore the participants are divided by the blue dotted line, with the control group are at the
left side of the graph, while the patients are on the right end. The standard deviation of the
percent signal change for each contrast is indicated by the black error bars. The mean percent
signal change was highly variable between the individual participants showing no difference
List of Abbreviations
CSF – cerebrospinal fluid
CNS – central nervous system
IVH – intraventricular hemorrhage
ICP – intracranial pressure
VD – ventricle dilatation
US – ultrasound
CT – computerized tomographic scan
MRI – magnetic resonance imaging
NICU - neonatal intensive care unit
fMRI – functional magnetic resonance imaging
BOLD – Blood-oxygen-level dependent
ROI – region of interest
SES – socioeconomic status
mg/dl – milligrams per decilitre
VP – ventriculoperitoneal
ETV – endoscopic third ventriculostomy
g – grams
ROI – region of interest
CFMM - Centre of Functional and Metabolic Mapping
ep – echo planar
TE – echo time
TR – repetition time
FOV – field of view
mm – milometers
Beery VMI – Beery-Buktenica Developmental Test of Visual Motor Integration
VMI – Visual Motor Integration
NSS – Number Sense Screener
WPPSI – Wechsler Preschool and Primary Scale of Intelligence
WISC – Wechsler Intelligence Scale for Children
DICOM – Digital Imaging and Communications in Medicine
NIfTI – Neuroimaging Informatics Technology Initiative
BIDS – Brain Imaging Data Structure
FSL - FMRIB Software Library
BET – Brain Extraction Tool
FEAT –FMRIB’s Easy Analysis Tool
FWHM – full-width at half maximum
BBR – boundary-based registration
MNI – Montreal Neurological Institute
NIH – National Institute of Health
NIHPD – MRI Study of Normal Brain Development
GLM – general linear model
EVs – explanatory variables
COPE – combination of parameter estimates
FWE – family wise error rate
IPS – intraparietal sulcus
List of Appendices
Appendix A – MRI CFMM Protocol
Appendix B – Permission to use Dartmouth Database of Children's Faces
Chapter 1
1
Introduction
1.1
Infantile Hydrocephalus
Derived from the ancient Greek word ‘hudrokephalon’ which literally translates to ‘water’ ‘head’, hydrocephalus is the accumulation of excess fluid in the brain (Aschoff et al., 1999; hydrocephalus | Definition of hydrocephalus in English by Oxford Dictionaries; Rekate, 2008). The International Working Group Hydrocephalus defines hydrocephalus as a neurological
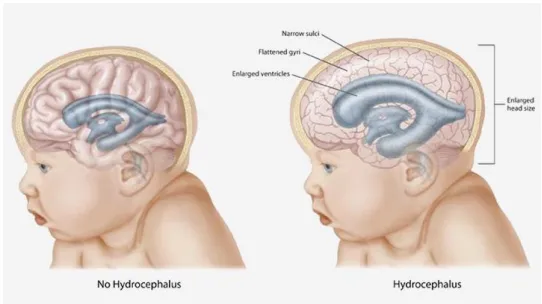
condition which involves the progressive distension of the brain’s ventricular system due to the over production or obstruction of the flow of the cerebrospinal fluid (CSF) between its site of production in the ventricular system and its point of absorption, in the subarachnoid space surrounding the brain (Hydrocephalus During Infancy | The Embryo Project Encyclopedia). Infantile Hydrocephalus is a form of hydrocephalus which develops in children within the first two years of life (Tully and Dobyns, 2014) (Figure 1). Hydrocephalus is the most common disease treated by pediatric neurosurgeons (Kahle et al., 2016).
Figure 1: A common feature of infantile hydrocephalus is a large head circumference
which can be accredited to an increase in intraventricular pressure leading to ventricular
dilatation (VD) and consequently an increase in head circumference (From:
CSF has multiple functions in maintaining the homeostasis of the brain and providing
mechanical protection to the brain by working as a fluid cushion (Cinalli et al., 2004; McAllister et al., 1991b) . There are four cerebral ventricles which consist of: the two lateral ventricles, third ventricle and fourth ventricle. A disruption in the flow of CSF (or an overproduction of CSF) can result in the accumulation of CSF in the ventricles, causing the ventricles to expand through ventricular dilatation and the development of hydrocephalus (Cinalli et al., 2004; Raybaud, 2017). The normal flow of CSF is illustrated in Figure 2.
Figure 2: Flow of CSF begins in the lateral ventricles then to the third ventricle via the
foramen of Monro, after which CSF passes through the cerebral aqueduct into the fourth
ventricle and leaving through the foramina of Luschka and Magendie (From:
Cerebrospinal fluid, 2019; Wright et al., 2016), where it enters the subarachnoid space,
circulating around brain and spinal cord until it finally reaches the arachnoid
granulations, into venous circulation (From: Cerebrospinal fluid, 2019).
The classification of infantile hydrocephalus depends site of CSF obstruction, the cause of the obstruction as well as the age of onset. In communicating hydrocephalus, there is no blockage in the flow of CSF in the ventricle system but rather CSF build-up arises from insufficient
an obstruction in the flow of CSF in the cerebral ventricles (Wright et al., 2016). Depending on the age of onset, infantile hydrocephalus can be defined as either being congenital or acquired. Congenital hydrocephalus is present at the time of birth, and may come as result of maternal infection, birth defects such as spina bifida, cerebral ventricle bleeding (intraventricular
hemorrhage), or due to genetic mutations (Dandy Walker cysts, X-linked hydrocephalus) (Tully and Dobyns, 2014; Wright et al., 2016). Acquired hydrocephalus occurs after birth, due to infections, tumors, or genetic disorders (Tully and Dobyns, 2014; Wright et al., 2016).
Intraventricular hemorrhage (IVH) is the most common cause of hydrocephalus for newborns (Tully and Dobyns, 2014). Note that intraventricular hemorrhage may be classified as both acquired and congenital. The greatest risk factors for neonatal IVH is prematurity coupled with a low birth weight of less than 1500 grams (Adams-Chapman et al., 2008). Prematurity is defined as infants who are born before 37 weeks. Most full-term infants are born with an approximate gestational age of 40 weeks and an average birth weight of 3500g (range of 2500 – 4500g) (Physical Growth in Newborns - Topic Overview). By classifying the type and underlying cause of infantile hydrocephalus, physicians can navigate the most appropriate treatment options to stabilize and manage patients.
1.2
Clinical Presentation and Symptoms
The severity of symptoms associate with infantile hydrocephalus can vary, mainly depending on the age of onset and the underlying cause of infantile hydrocephalus. Generally most of the signs and symptoms of hydrocephalus result from the increase in intracranial pressure (ICP) and ventricular dilatation (Wright et al., 2016). Neonates with hydrocephalus can present with the Cushing triad, a physiological response that consists of increased blood pressure, decreased heart rate and decrease respiration (Del Bigio, 1993; McAllister et al., 1991a; Wright et al., 2016). Older infants may display behavioural changes such as irritability, high pitch crying, and lethargy, as well as weight loss and vomiting (Hydrocephalus During Infancy | The Embryo Project Encyclopedia).
bones in the skull, that are replaced with soft membranous gaps known as fontanelle (Del Bigio, 1993; Kahle et al., 2016; Tully and Dobyns, 2014; Wright et al., 2016). ICP causes the fontanelle to push outwards, increasing head circumference of the infant and thus developing
macrocephaly. As the head circumference increases, the infant’s fontanelle may bulge forward
causing them to appear to be constantly looking downwards, developing “sunset eyes” (Bigio, 2010; Del Bigio, 1993). The veins of scalp veins dilate and become more prominent as head size increase. Continual head measurements are required in order to monitor further head growth and treat hydrocephalus.
1.3
Monitoring
Physicians and healthcare providers may use multiple neuroimaging techniques to non-invasively monitor the neuroanatomical changes associated with infantile hydrocephalus. At present, the most common imaging techniques being used are cranial ultrasound (US),
Figure 3: (A) The cranial US of an infant with hydrocephalus. Note the dilatation of lateral
ventricles’ frontal horns, indicated by the yellow arrow, and temporal horn, indicated by
the white arrow(From: Hydrocephalus, 2019). (B) The US of a premature infant with
marked periventricular cysts, circled in red (From: Pediatric Radiology).
CT scans are an efficient method of imaging that can display ventricle dilatation, lesions, tumors, and hemorrhage (Raybaud, 2017; Wright et al., 2016). Moreover, CT scans can be used to identify ICP by observing neuroanatomical changes such as: edema and decrease subarachnoid
space (Raybaud, 2017; Wright et al., 2016). However, due to radiation exposure that is associated with CT scans, it is generally recommended in emergency situations only (Wright et
al., 2016). There is an increasing shift towards using MRI (
Figure 4) for monitoring hydrocephalus. Primarily due to the fact that MRI scans are free of
radiation exposure and provide greater anatomical precision over CT scans, making MRI a far more useful method of imaging that enable more accurate diagnosis and better management for treating hydrocephalus. MRI scans uses magnetic fields to scan the brain and create an
anatomical image (Principles of magnetic resonance imaging - 1, 2015). Different techniques of MRI have emerged such as phase-contrast cine MRI and fast-sequence MRI. Phase-contrast cine MRI can be used to examine CSF flow and point of obstruction (Battal et al., 2011).
sequence MRI requires no patient sedation and is extremely efficient in acquiring images (Patel et al., 2014)
Figure 4: T2-weighted MRI image of a two-year-old male hydrocephalus patient with
Dandy-Walker syndrome. (DWS) (From: Gaillard)
1.4
Treatment
The goals of treating infantile hydrocephalus is to reduce intracranial pressure and the extent of ventricular dilatation by draining excess CSF in order to diminish the risk of obtaining further damage of surrounding brain areas. Very young preterm infants often undergo temporizing treatments methods that require frequent surgical intervention and medical observations at the neonatal intensive care unit (NICU). Before proceeding to more permanent forms of treatment, such as shunts, various criteria must be met. For instance, the infant must weigh at least 1000 g and have a CSF protein level of around 1000 mg/dl (Fulmer et al., 2000). Common temporizing treatments include ventricular taps, Ommaya reservoirs, and ventriculosubgaleal shunts.
Older infants with continual head growth and worsened symptoms, permanent forms of
treatment should be considered. Permanent treatments for hydrocephalus most often involve CSF diversion which allows for the continual drainage of CSF by diverting its flow to another area in the body via an alternative route (McAllister et al., 1991a; Pan, 2018; Wright et al., 2016). The most common form of CSF diversion is the ventriculoperitoneal (VP) shunt and endoscopic third ventriculostomy (ETV) (Agarwal et al., 2017; Rubin et al., 2008; Wright et al., 2016). VP shunts can be inserted into one of the cerebral ventricles, usually the lateral ventricles. The VP shunt can then extract CSF and divert it, via a long catheter, to the peritoneal space of the stomach, where CSF can be drained, Figure 5 (Tully and Dobyns, 2014; Wright et al., 2016).
Figure 5: The ventriculoperitoneal (VP) shunt, shown in the above figure (From: About
Your Ventriculoperitoneal (VP) Shunt Surgery for Pediatric Patients), is the most common
form of ventricular shunts for infantile hydrocephalus treatment (From: Wright et al.,
2016).
The endoscopic third ventriculostomy (ETV) can be used to treat non-communicating
has come as a result of the development of neuroendoscopy (endoscopy) (Cavalheiro et al., 2017; Di Rocco et al., 2006; Rekate, 2008; Wright et al., 2016; Yadav et al., 2012). During
neuroendoscopy, a small camera is inserted into the third ventricle allowing neurosurgeons to view the ventricular system while performing the ventriculostomy.
1.5
Neuroanatomical Changes in the Posterior Cortex
Medical imaging tools such as fast sequence MRI, and treatment methods such as the VP shunt and ETV have significantly improved the prognosis of infantile hydrocephalus (Bigio, 2010). Despite these advancements infantile hydrocephalus is not free from complications.
Neuroimaging studies involving the pathogenesis of hydrocephalus have observed progressive pathological changes in neuroanatomy due to increased intracranial pressure and ventricle dilatation. The extent of injury to surrounding brain areas primarily depends on the patient’s age
at the time of onset. The age of the patient is especially important when considering the stage of neuroanatomical development. Furthermore the rate of progression ventricle expansion, and how close the cortical lobe is to the ventricles is also important (Bigio, 2010; Dennis et al., 1981a; Dorner et al., 2018; Holwerda et al., 2016). The neurodevelopmental deficits in which patients with hydrocephalus may experience primarily depend upon which brain areas are affected during the pathogenesis of the condition. Studies investigating the neuroanatomical changes associated with infantile hydrocephalus using diffusion tension imaging (DTI), a neuroimaging technique used to measure white matter integrity; have found regional network abnormalities in cortical areas such as: the superior parietal, cingulate gyrus, medial frontal gyrus, and medial occipital gyrus (Kulkarni et al., 2015; Yuan et al., 2015, 2016). Brain abnormalities such as these have been associated to a range of developmental disabilities in: visuospatial skills, motor processing, memory, and executive function (Bigio, 2010; Brouwer et al., 2012; Del Bigio, 1993; Dennis et al., 1981a; Fletcher et al., 1992; Kulkarni et al., 2011; Lindquist et al., 2008; Mataró et al., 2001; Yeates et al., 2003; Yuan et al., 2016). Furthermore, hydrocephalic children were also recorded to have lower IQ scores and poor academic performance when compared to healthy controls (Mataró et al., 2001; Zahl et al., 2019).
to undergo proportionally greater damage than anterior brain areas (Brouwer et al., 2010, 2016; Dorner et al., 2018; Fletcher et al., 1996b; Gammal et al., 1987; McAllister et al., 1991a). Neuropathological changes of the posterior cortex can be accredited to a multitude of factors. Such as, the direction of ventricular dilatation, which progresses posterior to anterior, causing the posterior cortex to undergo prolonged compression, increased inflammation, pronounced cortical thinning and higher CSF volumes (Dorner et al., 2018; Fletcher et al., 1992, 1996b; Khan et al., 2006; McAllister et al., 1991a). Animal hydrocephalus models were recorded to have up to 50 % compression of size in the parietal and occipital lobes (McAllister et al., 1991). The parietal and occipital cortex both myelinate approximately 4 to 6 months after birth (Deoni et al., 2011), thus if unmyelinated at the time of onset, for infants under that age, the parietal and occipital cortex may experience direct compression with little to no protection from the expanding ventricles (Dalen et al., 2006; Dennis et al., 1981a; DeSilva and Lesnik, 2008; Gammal et al., 1987). Furthermore, US studies following ventricular dilation have recorded greater expansion of the posterior occipital horns of the lateral ventricles than the anterior frontal horns (Brouwer et al., 2010). The parietal cortex’s close proximity to the occipital horns will further increase its susceptibility to injury.
Damage of the posterior cortex during ventricle dilatation can cause pathologic changes to its neuroanatomical functional development. Since the posterior cortex has been associated with non-verbal learning (visuospatial skills and numeracy) (Andersen, 2011; Dehaene et al., 2003; Klingberg et al., 2002; Matejko and Ansari, 2019; Sahan et al., 2018), one should expect to see a decrease deficits in these cognitive domains if the posterior cortex is damaged (McAllister et al., 1991a). Visuospatial skills are defined as one’s ability to identify, perceive, and integrate visual and spatial patterns in more than one dimension (De Vega et al., 1996; Klingberg et al., 2002). This includes skills such as shape recognition, abstract design or map tracing. Numeracy is a
However, to our knowledge, non-verbal deficits caused by infantile hydrocephalus have not been related to changes in functional brain activity using task-based functional MRI (fMRI). Task-based fMRI can measure the activation of localized brain areas possibly affected, through the presentation of a specific task during the fMRI scan. Brain activation can be quantified by monitoring changes in blood oxygen levels in the brain, known as the blood-oxygen-level-dependent (BOLD) signal. The current case study will investigate how damage caused by
ventricular dilatation in the posterior cortex may lead to changes in brain functional development and consequently non-verbal deficits. This will be achieved by localizing posterior cortex
activity during an fMRI number comparison task as well through various behavioural assessments within the non-verbal cognitive domain.
1.6
Current Study
1.6.1 Hypothesis
OBJECTIVE: To study the behavioural outcomes and changes in functional neuroanatomical development in school-aged children with treated infantile hydrocephalus.
HYPOTHESIS: Reorganization of the posterior cortex in patients with treated infantile hydrocephalus is associated with non-verbal deficits in childhood.
RESEARCH AIMS:
1. Assessment of learning outcomes: To compare non-verbal learning (visuospatial and numeracy) outcomes in children who have experience hydrocephalus during infancy and healthy controls.
1.7
Study Objective
The objective of this study is to investigate the long-term neurodevelopmental outcomes of shunted patients with treated infantile hydrocephalus. We will examine the behavioural outcomes of these patients and determine whether they will have disability discrepancies in non-verbal and verbal learning. Furthermore, we will compare their blood-oxygen-level-dependent (BOLD) signal intensity in the parietal cortex during an fMRI task to healthy control children. The following study will be presented through a series of cases of individual patients with previous infantile hydrocephalus as a case study. Our current patient sample size (n=3) is primarily due to difficulties in recruiting stable hydrocephalus patients who fit the exclusion criteria of the study which included: not having a programmable (magnetic) shunt and their ability to complete all of the behavioural assessment as well as the fMRI task. Patient recruitment in longitudinal clinical studies can be especially challenging task once patients have been discharged from hospital, this is particularly true for pediatric patient populations (Boklan, 2006; Comerford et al., 2017; Denhoff et al., 2015; Ferrari et al., 2008; Glickman et al., 2008; Kadam et al., 2016; Michelson et al., 2018). Our current case study will consider the clinical history of individual patients with treated infantile hydrocephalus alongside their behavioural profiles and posterior brain activity during an fMRI number comparison task.
1.7.1
fMRI Case Study
Throughout the course of medical research history, neurological case studies have consistently shown promise in helping researchers and physicians to gain a better understanding of structure and function relationships in the brain (Danckert and Mirsattarri, 2012). Early cognitive
Due to issues such as image acquisition, signal to noise ratio, and large amounts of inter-subject variability, fMRI studies face major concerns in replicability, statistical power, validity and reliability (Arbabshirani et al., 2017; Dubois and Adolphs, 2016). As a result, fMRI data requires complex statistical analyses with large sample sizes in order to draw definitive
conclusions (Turner et al., 2018; Woo et al., 2014a) thus, making sample size a crucial caveat in fMRI research. However, despite these restrictions, the use of fMRI in clinical case studies still shows promise when considering its potential in providing insights into neuronal mechanisms changes, cognitive deficits and treatment for the long-term care of patients with certain
conditions. In recent years there has been a significant increase in publications targeting fMRI as a case study method to better understand patient populations (Arbabshirani et al., 2017; Basagni et al., 2019; de Bertoldi et al., 2015; Edes et al., 2017; Iyengar, 2016; Korsnes et al., 2009; Nemmi et al., 2015; Pizoli et al., 2011; Radman et al., 2016; Roland et al., 2017).
Chapter 2
2
Methods
2.1
Participants
2.1.1 Socioeconomic Status
In the following sub-sections, we will provide details with regards to the participants who were
recruited for the current study, including the clinical history of the individual patients along with
a list of the control participants. We will also provide information about the socioeconomic
status (SES) of the parents for each participant using the Hollingshead Four Factor Scale, which
measures SES through variables such as parental education and occupation (Cirino et al., 2002).
The SES score can range from 8 to 66, with low SES being scores between 8 to 20 and average
SES being scores between 21 to 66. Parental education was also measured using a score system
of 1 to 7, described in Table 1 (Cirino et al., 2002; Yale Journal of Sociology | Sociology).
Parental SES is an established variable that is often measured when studying the
neurodevelopment, particularly the cognitive outcomes in pediatric patients. SES includes, but is
not limited to, maternal education, single parent families, occupation, familial support, and social
environment (Benavente-Fernández et al., 2019; Brookshire et al., 1995; Chin-Lun Hung et al.,
2015; Lodha et al., 2018; Ritzema et al., 2018). Low SES, as well as low maternal education, and
single parent families, have all been associated to adverse neurodevelopmental outcomes and
cognitive impairments for preterm as well as full-term infants (Benavente-Fernández et al., 2019;
Level of School Completed Score
Less than the seventh grade 1
Junior high school (9th grade) 2
Partial high school (10th or 11th grade) 3
High school graduate 4
Partial college (at least one year) or specialized training 5 Standard college or university graduation 6 Graduate professional training (graduate degree) 7
Table 1: The parental educational score of the Hollingshead system for SES. Ranging 1 to
7, with 1 equal to a seventh-grade education level, and 7 for graduate level degree or above.
2.1.2 Hydrocephalus Patients
The following descriptions contain the individual patient history of each of the hydrocephalus patients who were recruited in our study. A list of individual patients is described in Table 2.
Participant Sex Age Maternal
Education
Paternal Education
Single vs Two
Parent Family SES score
1A M 5 years 6 months 5 6 Two 25
2A M 9 years 11 months 6 6 Two 48
3A M 5 years 4 months 5 3 Single 29.5
4A M 6 years 3 months 5 6 Two 36.5
5A M 8 years 11 months 4 3 Single 29
Table 2: The list of participant ID, sex, age at time of participation, parental education,
single vs two parent family, and SES score of patients who were diagnosed and treated for
hydrocephalus during infancy. All of the patients were male, their age was measured at
time of participation. Patients 1A and 3A were excluded from further analysis as they were
Patient 1A was born premature with a gestational age of 25 weeks and had an extremely low birth weight of 800 grams. Patient 1A was diagnosed with bilateral IVH associated with
prematurity at the time of birth. Patient 1A was serially tapped at the neonatal intensive care unit (NICU) for two months. At three months patient 1A’s IVH had progressed to global ventricular
dilatation and hydrocephalus they were subsequently treated with a right VP shunt. Patient 1A was aged 5.50 years (5 years 6 months) when they were recruited and had no revisions of the shunt since its initial insertion. Patient 1A was unable to complete the experimental protocol due to fear of the MRI scanner they were removed from further analysis.
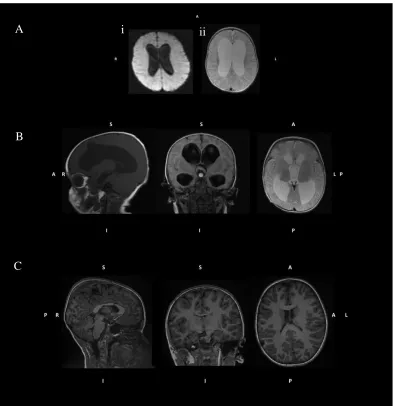
Figure 6: The structural MRI images of patient 2A, just before their VP shunt insertion (A,
B) and years after surgery (C). Figure 6A shows the progression of patient 2A from
moderate to severe ventricular dilatation. The T1 weighted image on the left (i) shows
patients 2A at 2 months with moderate ventricular dilatation. As their condition
progressed, patient 2A developed severe ventricular dilatation at 4 months, shown in the
T2 weighted image on the right (ii). Patient 2A’s MRI structural images, just prior to their
VP shunt insertion (B), years after surgery (C) at 9 years of age. At the time of
participation, patient 2A ventricles had substantially reduced in size, through continual
CSF drainage provided by the VP shunt. The directions of the MRI images are indicated
as superior (S), anterior (A), posterior (P), right (R), left (L), inferior (I), and posterior (P).
A
B
C
Patient 3A was born premature at age 27 weeks’ gestation, with a very low birth weight of 1080
g and was diagnosed with hydrocephalus secondary to severe IVH (grade III) due to prematurity. Patient 3A received multiple ventricular taps, followed by the insertion of a right parietal VP shunt at 5 months in age. Patient 3A was 5.33 years old (5 years 4 months) at the time of participation they were unable to complete the experimental protocol due to fear of the MRI scanner.
Figure 7: The preoperative coronal head US of patient 4A at 1 month (A) showing the
frontal horn of the lateral ventricles. Patient 4A had severe ventricular dilatation, however
due to their immediate shunt insertion, they did not have large volumes of CSF for a long
period of time. The structural MRI images of patient 4A (B) show reduction of ventricle
size, years following surgery, at age 6. Note, the partial formation of patient 4A’s
cerebellum, as well as their enlarged posterior fossa, a consequence of Dandy Walker
Malformation. The directions of the MRI images are indicated as superior (S), anterior (A),
posterior (P), right (R), left (L), inferior (I), and posterior (P).
A
Patient 5A was born premature at 26 weeks of gestation with an extremely low birth weight of 818 grams. They were diagnosed with hydrocephalus secondary to IVH as well as meningitis at the time of birth. Meningitis is the inflammation of the membranes (meninges) that surround the brain, due to usually a bacterial infection. Prior studies, have shown meningitis to have a
Figure 8: The preoperative sagittal head US of patient 5A at 1 month (A) showing the
moderate dilatation of the frontal horns. Periventricular cysts, indicated by the green
arrow, were found around the ventricles at the site of hemorrhage (B). The structural MRI
images of patient 5A years following surgery, at age 8 is shown in Figure 8C. At the time of
participation, patient 5A ventricles had substantially reduced in size, due to the continual
CSF drainage provided by the VP shunt. The directions of the MRI images are indicated as
superior (S), anterior (A), posterior (P), right (R), left (L), inferior (I), and posterior (P).
A B
2.1.3 Control Group
Controls were recruited through the Western University’s Department of Psychology Child
Developmental Participant Pool. Parents of the children in the developmental pool were added during their post-natal stay in hospital after the birth of their child. They were recruited and provided with general information about the study through either email or over phone. The control group consisted of healthy children aged 4-13 years with no prior history of neurological disease. A total of 12 control participants were recruited, their mean age was 9.318 years (9 years and 4 months) with a sex ratio of 1:1. A list of the control group is displayed in Table 3.
Participant Sex Age Maternal
Education
Paternal Education
Single vs Two
Parent Family SES score
1B M 11 years 0 months 6 6 Two 45.5
2B F 13 years 1 month 6 6 Two 45.5
3B M 10 years 7 months 7 6 Two 49.5
4B M 8 years 10 months 7 6 Two 49.5
5B M 6 years 9 months 7 6 Two 49.5
6B M 12 years 6 months 6 6 Two 50.5
7B F 7 years 6 months 7 7 Two 66
8B F 8 years 10 months 7 6 Two 52
9B F 4 years 11 months 7 7 Two 66
10B F 10 years 6 months 6 4 Single 58
11B M 12 years 10 months 6 6 Two 60.5
12B F 10 years 6 months 7 6 Two 57
Table 3: The control group: participant ID, sex, age at the time of participation (in years
and months), parental education, single vs two parent family, and SES score of each
2.2
Experimental Protocol
Participants underwent an initial training session, using a mock MRI scanner, in order to become comfortable with the MRI environment and practice the fMRI task before entering the scanner. The mock scanner was used to ensure that the participant would be accustomed to the MRI sounds and the closed space of the scanner. To have a better understanding of the MRI scanner and its functions, participants under the age of 7 were read an MRI storybook before going into the Mock scanner, Figure 9. Two stories, titled the Magical Tower and the Hidden Lighthouse both involved a giraffe character who was being scanned and addressed essential instructions of the MRI protocol such as remaining still and how to respond to the fMRI task. By presenting the information regarding the MRI protocol through storytelling made the MRI mock scan session accessible and enjoyable for young children.
Figure 9: MRI storybook, for young children. The Hidden Lighthouse (A) and the Magical
Tower (B) were created for younger participants during MRI mock scan.
After the mock scan session, which usually lasted about an hour, participants would proceed to the behavioural assessments. All of the scores of behavioural assessments were standardized to allow for across aged comparisons. All participants were assessed in the following order, subtests of the individual assessments were also listed in the order in which they were administered in. The duration of the tasks is also listed:
1) Beery Visual Motor Integration (Beery VMI) i. Beery VMI – 10 minutes
ii. Visual Perception (VP) – 3 minutes iii. Motor Coordination (MC) – 5 minutes 2) Number Sense Screener (NSS) – 20 minutes
• NSS was only administered to children under 7 years. i. Counting Skills
ii. Number Recognition iii. Nonverbal Calculation iv. Story Problems
v. Number Combination
3) Wechsler Preschool and Primary Scale of Intelligence (WPPSI) or Wechsler Intelligence Scale for Children (WISC) – 30 minutes
• WPPSI was administered to children under the age of 7, and WISC was administered to children aged 7 and above.
i. Block Design ii. Information iii. Vocabulary
iv. Arithmetic (WISC only)
v. Object Assembly (WPPSI only)
surrounding the individual behavioural tests and MRI protocol parameters will be discussed in subsequent sections.
2.3
Behavioural Assessments
In order to have an understanding of the neurodevelopmental outcomes in children with previous infantile hydrocephalus, we conducted an assortment of behavioural tests which assessed for multiple non-verbal cognitive domains such as motor, numeracy, and visual perception skills, as well as verbal learning. All behavioural test had standard scores for across age comparison. To measure the performance of the hydrocephalus patients, they will be compared to the control group and the mean standard for the normed scores. The following assessments were included in the current case study: Beery VMI, WPPSI, WISC, NSS.
2.3.1 Beery Visual Motor Integration
The Beery-Buktenica Developmental Test of Visual Motor Integration (Beery VMI) is a behavioural assessment which measures how visual processing coordinates with fine motor movements, in a process known as visual-motor integration (Beery et al., 2010; Bolk et al., 2018). Beery VMI can be used for children ages 2 and above and consists of three subtests: visual motor integration (VMI), visual perception and motor coordination (Beery et al., 2010). In the VMI subtest, participants were asked to copy a series of 30 images from a simple line to complex geometric shapes (Beery et al., 2010). A short form of the VMI subtest with 21 images was administered to participants under 7 years of age (Beery et al., 2010). In the visual
perception subtest, participants were again given a sequence of shapes with increasing complexity. They were asked to match each shape’s identical match from a group of three
of matched year and month. Standard scores, summarized in Table 4, were used to measure performance.
Standard Scores Performance % of Age Group
>129 Very High 2
120-129 High 7
110-119 Above Average 16
90-109 Average 50
80-89 Below Average 16
70-79 Low 7
<70 Very Low 2
Table 4: Standard scores of VMI, visual perception and motor coordination. The mean
standard score was 100 with a standard deviation of 15. Relative performance (high,
average, low) was assessed by the converted standard scores. The “% of age group” is the
percentage of individuals who achieved a particular standard score range (Beery et al.,
2010).
2.3.2 Wechsler Preschool and Primary Scale of Intelligence and
Wechsler Intelligence Scale for Children
Depending on the participant’s age at the time of testing they were either administered the
Wechsler Preschool and Primary Scale of Intelligence (WPPSI) or Wechsler Intelligence Scale for Children (WISC). Participants under the age of 7 were administered WPPSI, and participants aged 7 or older were administered WISC (Syeda and Climie, 2014; WISC-V; WPPSI-IV). Both
batteries are designed to determine a child’ s general intelligence and whether developmental deficits may be present. The WPPSI and WISC contain multiple subtests that address different cognitive domains such as verbal fluency or non-verbal ability, that can provide researchers with
time, we selected a short list of subtest or subtests, listed in Table 5, from both WISC and WPPSI.
Block Design Information Vocabulary Arithmetic Object Assembly
WISC ✓ ✓ ✓ ✓
WPPSI ✓ ✓ ✓ ✓
Table 5: Administered subtests of the WISC and WPPSI. Note the check marks indicate
which subtest was a part of the respective battery.
During the block design subtest, participants were asked to reproduce an image using plastic coloured blocks. The block design subtest measures nonverbal concept formation such as abstract design, visuospatial processing, and motor coordination (Syeda and Climie, 2014; WISC-V; WPPSI-IV). For the information subtest, participants were asked a series of general knowledge questions in subjects such as science, history and geography (WISC-V; WPPSI-IV), in order to examine long-term memory and acquired knowledge. The vocabulary subtest
participants were asked to define terms to measure their verbal fluency, word knowledge, word usage, and concept formation. The object assembly subtest, available only in WPPSI, was used to measure abstract design, spatial processing, and visual perception (WPPSI-IV). Here,
Scaled Score Number of SDs from the Mean Percentile Rank Equivalent
19 +3 99.9
18 +2 2
3 99.6
17 +2 1
3 99
16 +2 98
15 +1 2
3 95
14 +11
3 91
13 +1 84
12 +2 3 75 11 +1 3 63
10 0 (Mean) 50
9 −1 3 37 8 −2 3 25
7 -1 16
6 -11
3 9
5 -12
3 5
4 -2 2
3 -21
3 1
2 -22
3 0.4
1 -3 0.1
Table 6: Scaled scores of WPPSI and WISC subtests. The mean standard score was 10 with
a standard deviation of 3. The number of standard deviations (SD) from the mean scaled
2.3.3 Number Sense Screener
The Number Sense Screener (NSS) was used to evaluate numerical ability in younger
participants under the age of 7 who were not administered the arithmetic subtest of the WISC (Brookes Publishing: Number Sense ScreenerTM (NSSTM) Set, K–1, Research Edition). NSS can be divided into the following categories: numbers, relations, and operations. Each category contained a number of subtests that participants were asked to complete, listed below:
o Numbers
▪ Counting
▪ Number recognition o Relations
▪ Number comparisons o Operations
▪ Nonverbal calculations
▪ Story problems
▪ Number combinations
The counting subtests involved participants counting black stars. For the number recognition
task, participants were asked to identify symbolic numbers such as the 37. During the nonverbal
calculations, non-symbolic number representations in the form of black tokens, were provided.
Here participants were asked to either subtract or add black tokens being removed or inserted
into a box. The participant would answer by selecting one of four images of the black tokens. In
the story problem subtest, participants were asked to answer word problems such as “Jill has two
pennies. Jim gives her 1 more penny. How many pennies does Jill have now?” (Brookes
Publishing: Number Sense ScreenerTM (NSSTM) Set, K–1, Research Edition). The story problems
involved both addition and subtraction. Lastly, in the number combination subtest, participants
were asked addition and subtraction questions such as “How much is 7 take away 3?” (Brookes
Publishing: Number Sense ScreenerTM (NSSTM) Set, K–1, Research Edition). Participants were
provided with aids (pencil and paper, number list – series of 10 black dots) to assess them in
answering questions during the story problem and number combination subtests. Raw scores
were converted to standard scores using the respective grade of the participant (junior
2.4
Neuroimaging
2.4.1 Functional Magnetic Resonance Imaging
As mentioned in chapter 1, fMRI, can be used to measure brain activity through changes in blood oxygen levels in the brain, by acquiring the respective BOLD signal (Ulmer, 2013). The
association of BOLD signal with brain activation is drawn on the assumption that activation of neurons in the brain is associated with changes in blood flow, in a hemodynamic response, as seen in Figure 10 (Magnetism; Ulmer, 2013). When studying brain activation using fMRI one
can consider either use resting state or tasked based fMRI (Zhang et al., 2016). In a resting state fMRI, measurements of brain activation are taken at “rest” where there is no task given to participants. Here, researchers wish to assess global connectivity of resting state networks or distal brain areas (Lv et al., 2018; Pizoli et al., 2011; Roland et al., 2017; Smyser et al., 2013; Thompson, 2018). For task fMRI, participants are given a specific task to do during the actual scan, in order to study specific brain regions associated with that task. For example an fMRI motor task could be designed to measure activation and localize the motor cortex (Zhang et al., 2016).
2.4.2 MRI parameters
Functional and anatomical brain images were acquired using a Siemens MAGNETOM Prisma whole-body 3 Tesla MRI scanner with a 32-channel head coil at the Robarts Research Institute’s
Centre of Functional and Metabolic Mapping (CFMM). High resolution anatomical T1 contrast images were measured through magnetization prepared rapid gradient echo (MP-RAGE) pulse sequence, with the following parameters: repetition time (TR) = 2300.0 ms, echo time (TE) = 2.93 ms, flip angle = 9 °, field of view (FOV) = 256 mm, sagittal interleaved slices with a voxel thickness of 1.0 mm × 1.0 mm × 1.0 mm. Functional images were acquired through an echo planar (ep) image pulse sequence with the following parameters: TR = 1000.0 ms, TE = 30.00 ms, flip angle = 40 °, FOV = 208 mm, SNR 1.00, sagittal interleaved slices with a voxel thickness of 2.50 mm x 2.50 mm x 2.50 mm. Please refer to Appendix A for more information about the MRI protocol (Appendix A – MRI CFMM Protocol).
2.4.3 Task Paradigm
The fMRI task used was adopted from a 2012 study conducted by Jessica Cantlon and colleagues
at Rochester University (Emerson and Cantlon, 2012). Cantlon et al., hypothesized that functional connectivity between brain regions recruited during numerical matching and is a predictor of mathematical performance. We modified the task to make it more accessible for young children. During the fMRI comparison task, participants were presented different items
(numbers, faces, or shapes) and were asked to identify whether they were the same or different.
The two images were presented left and right of the monitor and had a central cross between
them. Participants were given two buttons while in the scanner and were instructed to press
either right button for same items or left button for different items. E-Prime 2.0 Standard was
used to create the task (E-Prime 2.0).
The task was created in order to localize number-related BOLD signal response in brain areas
associated with non-verbal learning specifically numeracy. Number items were presented using
both non-symbolic representation (dots, items, etc. – using amounts to represent numbers) and
symbolic representation (Arabic numeral – using symbols to represent numbers such as 2, 7, etc.)
(Mussolin et al., 2010). During the number condition, participants were asked to determine
For the face condition, participants were presented with grey-scale pictures of various smiling
children wearing caps (Dalrymple, K.A., et al.). The faces were presented with front and side
view. All face pictures were provided by Dartmouth Database of Children's Faces (Dalrymple,
K.A., et al.). Pairs of black shapes that were either identical or different was also presented. The
number and shape stimuli were used to localize non-verbal related activation in posterior brain
regions, particularly the parietal cortex. The faces stimuli were used as a control. Participants
were given either 3 or 6 seconds to respond to each pair. With 25 seconds of rest in between each
block of 7 pairs, in which they were presented with a cross. The task ran for approximately 10
minutes. The individual stimuli used is summarize in Figure 11.
Figure 11: Example the stimuli given during the fMRI comparison task numbers (A), faces
(B), and shapes (C). Images of the child faces were provided by Dartmouth Database of
Children's Faces (Dalrymple, K.A., et al.).
+
+ A
B
2.5
Data Analysis of fMRI data
2.5.1 Preprocessing
The fMRI data was analyzed using FMRIB Software Library (FSL) (Smith et al., 2001). Data files collected from the scanner were initially sorted and converted from their initial Digital Imaging and Communications in Medicine (DICOM) format into Neuroimaging Informatics Technology Initiative (NIfTI) using the Brain Imaging Data Structure’s (BIDS) dcm2bids application (Gorgolewski et al., 2016). Timing files relating to stimuli presentation were created depending on number of volumes acquired. All of the structural and functional images
underwent standard computational preprocessing steps to reduce variability in the data not related to the experimental design or research question, and also increase the signal-to-noise (SNR) ratio (Huettel et al., 2014). Preprocessed data underwent the following steps: skull
stripping of structural data files through FSL’s Brain Extraction Tool (BET) (Smith, 2002; Smith et al., 2001). Thereafter the 3D functional images were concatenated to 4D using fslmerge. Through FMRIB’s Easy Analysis Tool (FEAT) (Smith et al., 2001; Woolrich et al., 2001, 2004), data files completed the remaining preprocessing steps by undergoing high pass filtering of 100 Hz (an interval of 0.01 seconds), rigid-body motion correction, slice time correction, spatial smoothing using 5 mm – full-width at half maximum (FWHM) Gaussian kernel, and