c
�Owned by the authors, published by EDP Sciences, 2017
Recent CMS B physics results
Sergey Polikarpov on behalf of the CMS Collaboration1,a
1National Research Nuclear University “Moscow Engineering Physics Institute” (MEPhI), Moscow, Russia
Abstract.Various recent CMS B physics results are reported, including measurement of B hadron lifetimes; observation ofΥ(1S) pair production; angular analysis of the rare decay B0 →K∗0µ+µ−; search for X(5568) state. All analyses are performed using data
collected by the CMS experiment at the LHC in pp collisions at √s = 8 TeV, which corresponds to an integrated luminosity of about 20 fb−1.
1 Introduction
The CMS experiment [1] continues contributing to the Heavy Flavour physics sector. In this report, several recent CMS results on B hadron and quarkonium production and properties are discussed, including:
• Precise measurements of B0, B0s, B+c andΛ0b lifetimes in the decay channels with J/ψ→ µ+µ−, in particular: B0
→ J/ψK∗0 (K∗0
→ K+π−), B0
→ J/ψK0
S (K
0
S → π+π−), B
0
s → J/ψφ(φ → K+K−), B0
s →J/ψπ+π−, B+c →J/ψπ+andΛ0b →J/ψΛ 0(
Λ0→pπ−).
• First observation ofΥ(1S) pair production in proton-proton collisions and measurement of its cross section.
• Measurement of the P1and P′5angular parameters of the decay B0→K∗0µ+µ−.
• Search for X(5568) state decaying into B0 sπ±.
2 Precise measurements of B hadron lifetimes
Models inspired by Quantum Chromodynamics (QCD) provide precise predictions for b-hadron life-times. Accurate experimental measurements are essential to test those predictions.
B hadron decays are reconstructed using the decay J/ψ → µ+µ−, which also triggers the event
readout. The J/ψcandidate is combined with a track (for B+
c → J/ψπ+case) or with two tracks of opposite charge (for B0
→J/ψK∗0, B0
s →J/ψπ+π−and B0s →J/ψφ) to form a vertex, which is required to be significantly displaced from the primary vertex (PV). ForΛ0
b→J/ψΛ 0and B0
→J/ψK0
S decays, the long-lived hadrons are reconstructed from two-prong displaced vertices (in case ofΛ0
→pπ−, the
track with higher momentum of the two is selected as a proton candidate). Thresholds on the track transverse momentum, track and vertex fits quality and masses of the intermediate states are applied to reduce the background.
ct [cm]
0.02 0.04 0.06 0.08 0.1
(t)ε
R(t)/R
-3
10
-2
10 CMSPreliminary (8 TeV)
-1
19.7 fb
Figure 1. Ratio of efficiency-correctedctdistributions for B+
c and B+signals [2]. The line shows the fit result
with an exponential function.
The lifetimes are extracted with a fit to the 3-dimensional distribution of the reconstructed invariant mass of B hadron candidate,ctand per-eventctuncertainty. Heretis the measured proper decay time of a B hadron candidate, calculated using the expression
t=Lxy
M pT ,
whereLxy(pT) is the candidate transverse decay length (transverse momentum) andMis the world-average mass of B hadron. The fit function includes the signal component, the background component and, in case of the B0s → J/ψπ+π−channel, the contribution from other partially reconstructed or misidentified B hadron decays. The reconstruction efficiency dependence onctis taken into account in the fits.
For the B+c lifetime, a different approach is used to reduce systematic uncertainties. The yields of B+c → J/ψπ+and B+ → J/ψK+decays are obtained in intervals ofctand their ratio is fit with an exponential function, as shown in Fig. 1. The B+
c lifetime is obtained using the known lifetime of the B+meson and the fit result. The same method was used by LHCb collaboration to measure the B+ c lifetime in the same decay mode [3].
Dominant systematic uncertainties come from the finite size of the simulation sample, algorithm of PV selection and possible detector misalignment.
The measured lifetimes are [2]:
cτB0 =453.0±1.6 (stat)±1.5 (syst)µm (in J/ψK∗0),
cτB0 =457.8±2.7 (stat)±2.7 (syst)µm (in J/ψK0S),
cτB0
s =502.7±10.2 (stat)±3.2 (syst)µm (in J/ψπ
+π−),
cτB0
s =443.9±2.0 (stat)±1.2 (syst)µm (in J/ψφ), cτΛ0
b =442.9±8.2 (stat)±2.7 (syst)µm, cτB+
c =162.3±8.2 (stat)±4.7 (syst)±0.1(τB+)µm,
ct [cm]
0.02 0.04 0.06 0.08 0.1
(t)ε
R(t)/R
-3
10
-2
10 CMSPreliminary (8 TeV)
-1
19.7 fb
Figure 1. Ratio of efficiency-correctedctdistributions for B+
c and B+signals [2]. The line shows the fit result
with an exponential function.
The lifetimes are extracted with a fit to the 3-dimensional distribution of the reconstructed invariant mass of B hadron candidate,ctand per-eventctuncertainty. Heretis the measured proper decay time of a B hadron candidate, calculated using the expression
t=Lxy
M pT ,
whereLxy(pT) is the candidate transverse decay length (transverse momentum) andMis the world-average mass of B hadron. The fit function includes the signal component, the background component and, in case of the B0s → J/ψπ+π− channel, the contribution from other partially reconstructed or misidentified B hadron decays. The reconstruction efficiency dependence onctis taken into account in the fits.
For the B+c lifetime, a different approach is used to reduce systematic uncertainties. The yields of B+c → J/ψπ+and B+ → J/ψK+decays are obtained in intervals ofctand their ratio is fit with an exponential function, as shown in Fig. 1. The B+
c lifetime is obtained using the known lifetime of the B+meson and the fit result. The same method was used by LHCb collaboration to measure the B+ c lifetime in the same decay mode [3].
Dominant systematic uncertainties come from the finite size of the simulation sample, algorithm of PV selection and possible detector misalignment.
The measured lifetimes are [2]:
cτB0 =453.0±1.6 (stat)±1.5 (syst)µm (in J/ψK∗0),
cτB0 =457.8±2.7 (stat)±2.7 (syst)µm (in J/ψK0S),
cτB0
s =502.7±10.2 (stat)±3.2 (syst)µm (in J/ψπ
+π−),
cτB0
s =443.9±2.0 (stat)±1.2 (syst)µm (in J/ψφ), cτΛ0
b =442.9±8.2 (stat)±2.7 (syst)µm, cτB+
c =162.3±8.2 (stat)±4.7 (syst)±0.1(τB+)µm,
where the first (second) uncertainty is statistical (systematic). Each result is consistent with the current world average value and the accuracy in each channel is at the level of or better than the previous results.
Candidates / 50 MeV
0 5 10 15 20 25 Data
All componenets (1S)
Υ
(1S)
Υ
(2S)
Υ
(1S)
Υ
(1S)-combinatoriral
Υ
(2S)-combinatoriral
Υ
Pure combinatorial
=8 TeV) s (
-1
L=20.7 fb
CMSPreliminary
[GeV] (1)
µ µ
M
8.6 8.8 9 9.2 9.4 9.6 9.8 10 10.2 10.4 10.6 10.8 -50
5
Candidates / 50 MeV
0 5 10 15 20 25
Data All componenets
(1S)
Υ
(1S)
Υ
(2S)
Υ
(1S)
Υ
(1S)-combinatoriral
Υ
(2S)-combinatoriral
Υ
Pure combinatorial
=8 TeV) s (
-1
L=20.7 fb
CMSPreliminary
[GeV] (2)
µ µ
M
8.6 8.8 9 9.2 9.4 9.6 9.8 10 10.2 10.4 10.6 10.8 -50
5
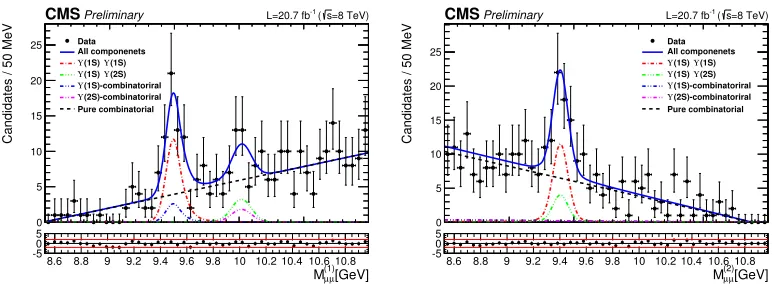
Figure 2. Projections of the 2D fit. Left: invariant mass distribution of heavier dimuon (M1
µ+µ−) and right:
invariant mass distribution of lighter dimuonM1 µ+µ−[4].
3 Observation of
Υ
(1S)
pair production
Quarkonium pair production cross section measurements are one of the key measurements in un-derstanding Single Parton Scattering (SPS) and Double Parton Scattering (DPS) contributions. The observation of simultaneous production of twoΥ(1S) mesons in pp collisions at √s =8 TeV is re-ported here. The dimuon decay is used to reconstructΥcandidates. Four muons are required to have a common vertex, and the rapidity of the reconstructedΥcandidates is required to be|y(Υ)|<2.0.
A two-dimensional unbinned fit to the invariant mass of reconstructed M1
µ+µ− and Mµ2+µ−
com-binations is used to extract the signal yield (whereMµ1+µ− > M
2
µ+µ−). Events containing more than
oneΥΥcandidates are discarded. No signs ofΥ(3S) and higher states are observed, therefore, their contributions are neglected. The fit includes pure combinatorial background component,Υ(1S)Υ(1S) andΥ(2S)Υ(1S) signal components and the contributions fromΥ(1S) orΥ(2S) and two unassociated muons. The fit result is presented in Fig. 2 and returns the number ofΥ(1S)Υ(1S) signal candidates
Nsig1=38±7 with a corresponding significance of 9.6σ(including systematic uncertainties) [4]. The cross sectionσTofΥ(1S) pair production is found to beσT=68.8±12.7(stat)±7.4(syst)± 2.8(BR) pb [4] in the region|y(Υ)| <2.0, pT(Υ(1S)) <50 GeV, assuming an isotropic decay of the Υ(1S), where the uncertainties are statistical, systematic and from the branching fraction knowledge, respectively. Cross section ranges from -38% to+36% from the value above when differentΥ(1S) polarizations are assumed.
4 Measurement of
P
1and
P
′5angular parameters in the decay
B
0→
K
∗0µ
+µ
−Rare decays that proceed via flavor-changing neutral current (FCNC) provide a sensitive laboratory to study the effects of New Physics (NP), since these decays are suppressed in the Standard Model (SM). In particular, NP can modify the angular distributions of the B0
→ K∗0µ+µ−decay. Some tensions
w.r.t. SM was observed in P′
5parameter by Belle [5] and LHCb [6].
) (GeV) −
µ
+
µ
−
π
+
Κ
(
m
5 5.1 5.2 5.3 5.4 5.5
Events / ( 0.028 GeV )
0 10 20 30 40
50 Signal yield: 119 ± 14
CMS Preliminary 20.5 fb−1 (8 TeV)
2 6.00 GeV − : 4.30 2
q Data
Total fit Corr.tag sig. Mistag sig. Background
) l θ
cos( 0 0.1 0.2 0.3 0.4 0.5 0.6 0.7 0.8 0.9 1
Events / ( 0.05 )
0 10 20 30 40 50
CMS Preliminary 20.5 fb−1 (8 TeV)
2 6.00 GeV − : 4.30 2
q Data
Total fit Corr.tag sig. Mistag sig. Background
) Κ
θ
cos( -1 -0.8 -0.6 -0.4 -0.2 0 0.2 0.4 0.6 0.8 1
Events / ( 0.1 )
0 10 20 30 40 50
CMS Preliminary 20.5 fb−1 (8 TeV)
2 6.00 GeV − : 4.30 2
q Data
Total fit Corr.tag sig. Mistag sig. Background
φ
0 0.5 1 1.5 2 2.5 3
Events / ( 0.15708 )
0 10 20 30 40 50
CMS Preliminary 20.5 fb−1 (8 TeV)
2 6.00 GeV − : 4.30 2
q Data
Total fit Corr.tag sig. Mistag sig. Background
Figure 3. Distributions of K+π−µ+µ−mass and three angular variables in the third bin ofq2 (4.30 < q2 <
6.00 GeV2) from the decay B0→K∗0µ+µ−[7].
The B hadron reconstruction is similar to the procedure described in Sect. 2. Kaon and pion masses are assigned to the two tracks so that the combination with invariant mass closer to the known K∗0 mass is retained (mistag probability of this procedure is about 14%). After all selection requirements, 1397 events are remaining in the signal sample (contributions from J/ψ→ µ+µ−andψ(2S)→ µ+µ−
are removed).
The P1 and P′5 observables are studies in 7 bins of the square of dimuon invariant mass,q2. In eachq2bin an unbinned extended maximum-likelihood fit is performed to four variables: K+π−µ+µ−
invariant mass,θl(the angle betweenµ+momentum and the direction opposite to the B0in the dimuon rest frame),θK (the angle between K+momentum and the direction opposite to the B0 in the K+π− rest frame), andφ(the angle between the plane containing the two muons and the plane containing the kaon and pion in the B0 rest frame). The fit function consists of correctly tagged signal component, mistagged signal component and background component. The signal function includes S-wave K+π−
component, P-wave K∗0
→ K+π−component and their interference. The efficiency dependence on
the angular parameters is accounted in the fits, and the background shape is obtained from the B0 sideband. The fit function depends on 6 parameters of angular distributions:FL,FS,AS,A5S, P1and P′5, where the first three of them (FL,FS andAS) are fixed to the values measured in Ref. [8] to ensure the fit convergence given the limited number of candidates. The result of the fit in the thirdq2 bin (4.30 < q2 < 6.00 GeV2) is presented in Fig. 3.
) (GeV) − µ + µ − π + Κ ( m
5 5.1 5.2 5.3 5.4 5.5
Events / ( 0.028 GeV )
0 10 20 30 40
50 Signal yield: 119 ± 14
CMS Preliminary 20.5 fb−1 (8 TeV)
2 6.00 GeV − : 4.30 2 q Data Total fit Corr.tag sig. Mistag sig. Background ) l θ cos( 0 0.1 0.2 0.3 0.4 0.5 0.6 0.7 0.8 0.9 1
Events / ( 0.05 )
0 10 20 30 40 50
CMS Preliminary 20.5 fb−1 (8 TeV)
2 6.00 GeV − : 4.30 2 q Data Total fit Corr.tag sig. Mistag sig. Background ) Κ θ cos( -1 -0.8 -0.6 -0.4 -0.2 0 0.2 0.4 0.6 0.8 1
Events / ( 0.1 )
0 10 20 30 40 50
CMS Preliminary 20.5 fb−1 (8 TeV)
2 6.00 GeV − : 4.30 2 q Data Total fit Corr.tag sig. Mistag sig. Background φ
0 0.5 1 1.5 2 2.5 3
Events / ( 0.15708 )
0 10 20 30 40 50
CMS Preliminary 20.5 fb−1 (8 TeV)
2 6.00 GeV − : 4.30 2 q Data Total fit Corr.tag sig. Mistag sig. Background
Figure 3. Distributions of K+π−µ+µ−mass and three angular variables in the third bin ofq2 (4.30 < q2 <
6.00 GeV2) from the decay B0→K∗0µ+µ−[7].
The B hadron reconstruction is similar to the procedure described in Sect. 2. Kaon and pion masses are assigned to the two tracks so that the combination with invariant mass closer to the known K∗0 mass is retained (mistag probability of this procedure is about 14%). After all selection requirements, 1397 events are remaining in the signal sample (contributions from J/ψ→µ+µ−andψ(2S)→ µ+µ−
are removed).
The P1and P′5 observables are studies in 7 bins of the square of dimuon invariant mass,q2. In eachq2bin an unbinned extended maximum-likelihood fit is performed to four variables: K+π−µ+µ−
invariant mass,θl(the angle betweenµ+momentum and the direction opposite to the B0in the dimuon rest frame),θK (the angle between K+momentum and the direction opposite to the B0 in the K+π− rest frame), andφ(the angle between the plane containing the two muons and the plane containing the kaon and pion in the B0 rest frame). The fit function consists of correctly tagged signal component, mistagged signal component and background component. The signal function includes S-wave K+π−
component, P-wave K∗0
→ K+π−component and their interference. The efficiency dependence on
the angular parameters is accounted in the fits, and the background shape is obtained from the B0 sideband. The fit function depends on 6 parameters of angular distributions: FL,FS,AS,A5S, P1and P′5, where the first three of them (FL,FS andAS) are fixed to the values measured in Ref. [8] to ensure the fit convergence given the limited number of candidates. The result of the fit in the thirdq2bin (4.30 < q2 < 6.00 GeV2) is presented in Fig. 3.
The dominant sources of systematic uncertainties are the fit bias (evaluated with fits to the simu-lated data), the uncertainties onFL,FS andAS, the finite size of the simulated data sample, and the K+π−mistagging (estimated using control channel B0 →J/ψK∗0).
)
2
(GeV
2 q
0 2 4 6 8 10 12 14 16 18 20
1 P -1.5 -1 -0.5 0 0.5 1 1.5 2 2.5
3 〈 SM-DHMV 〉
〉
SM-HEPfit
〈
CMS LHCb CMSPreliminary 20.5 fb−1 (8 TeV)
)
2
(GeV
2 q
0 2 4 6 8 10 12 14 16 18 20
5 P' -1.5 -1 -0.5 0 0.5 1 1.5 〉 SM-DHMV 〈 〉 SM-HEPfit 〈 CMS LHCb Belle-preliminary CMSPreliminary 20.5 fb−1 (8 TeV)
Figure 4.Measured values of P1and P′5as a function ofq
2from the B0
→K∗0µ+µ−decay [7], compared with
LHCb [6] and Belle [5] results. The vertical shaded regions correspond to the J/ψandψ(2S) regions.
The resulting values of P1and P′5in bins ofq2are presented in Fig. 4 along with the results from Belle [5] and LHCb [6]. The SM theoretical predictions available for comparison are predictions from SM-DHMV and SM-HEPfit. The CMS measurements are in agreement with both theoretical predictions.
5 Search for X(5568)
The claim for the observation of the X(5568) state decaying into B0
sπ±by the D0 Collaboration [9] raised many controversial discussions in the exotic hadron community. The new state was reported to have a mass and natural width of 5567.8±2.9(stat)+−01..99(syst) MeV and 21.9±6.4(stat)+
5.0
−2.5(syst) MeV, respectively. The relative production of X(5568) w.r.t. B0s meson, multiplied byB(X(5568)→B0sπ±), was measured to beρX=(8.6±1.9±1.4)% for pT(B0s)>10 GeV in proton-antiproton collisions at
√
s=1.96 TeV [9]. The LHCb Collaboration did not find any evidence for X(5568) in pp collisions at √s=8 TeV and set an upper limit onρX:ρX<2.4%@ 95% CL forpT(B0s)>10 GeV [10].
We report a negative search result for X(5568) at the CMS experiment. The B0
s candidates are reconstructed using the decay channel B0
s → J/ψφ, where J/ψ→ µ+µ− andφ → K+K− decays are used. The same trigger used in the B hadrons lifetime measurement (Sect. 2) is used in this analysis.
About 50,000 B0
s →J/ψφsignal candidates [11] are found in the reconstructed J/ψφinvariant mass distribution. The pions coming from the B0
s production PV and satisfying pT >0.5 GeV requirement are combined with B0
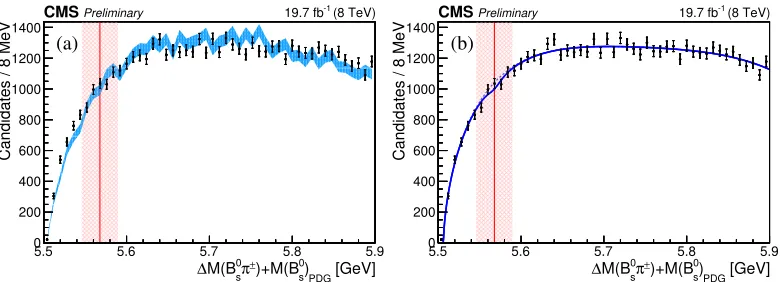
s candidates to form B0sπ± candidates. The B0sπ± invariant mass distribution is shown in Fig. 5 (a), compared between the B0
s signal region and the B0s sideband regions. No significant structures are visible near 5568 MeV nor in the whole mass region 5.5−5.9 GeV. The distribution from the B0
s signal region is close to that of B0s sidebands. The fit to the distribution in the B0
s signal region with a smooth background function and a signal component (Relativistic Breit-Wigner with mass and width fixed to the values measured by the D0, convolved with resolution) is presented in Fig. 5 (b) and returns a yield of X(5568) signal candidates consistent with zero: NX =
−175±134 [11]. Some variations of selection criteria are made, in particular, different requirements on B0s, π±, B
0
[GeV]
PDG
)
s 0
)+M(B
±
π s 0
M(B
∆
5.5 5.6 5.7 5.8 5.9
Candidates / 8 MeV
0 200 400 600 800 1000 1200 1400
(8 TeV) -1 19.7 fb CMSPreliminary
(a)
[GeV]
PDG
)
s 0
)+M(B
±
π s 0
M(B
∆
5.5 5.6 5.7 5.8 5.9
Candidates / 8 MeV
0 200 400 600 800 1000 1200 1400
(a)
(8 TeV) -1 19.7 fb CMSPreliminary
(b)
Figure 5. (a): B0
sπ±invariant mass distribution for the B0s signal region and B0s sidebands. (b): fit to the B0sπ±
invariant mass distribution in the B0
ssignal region [11].
requirements on K+K−mass, which allows the B0
→J/ψK+π−decay to contribute to the reconstructed
B0
s →J/ψK+K−sample. Consequently, the decays of excited B meson states B (∗)+ 1,2 →B
(∗)0π+produce
clear excess in the reconstructed B0sπ±invariant mass distribution [11].
An upper limit onρXis obtained: ρX < 3.9%@ 95% CL for pT(B0s) > 10 GeV [11]. The main source of systematic uncertainty is the knowledge of the efficiency ratioǫX/ǫB0
s from the simulation.
6 Summary and acknowledgments
In summary, CMS presents recent Heavy Flavour physics results. The measured lifetimes of B hadrons are among the most precise to date. First observation ofΥ(1S) pair production in proton proton collisions is made and the corresponding cross section is measured. The P1 and P′5angular parameters of the rare decay B0
→ K∗0µ+µ−are measured with precision at the level of the best
pre-vious measurements, and they are found to be in agreement with the Standard Model predictions and previous results from LHCb and Belle collaborations, thus no evidence for physics beyond the SM is obtained. The search for X(5568) is presented, and an upper limit is set on the relative production in agreement with the LHCb collaboration.
The author’s work was supported by the Russian Ministry of Education and Science contracts 3.2989.2017 and 14.A12.31.0006. The author would like to thank the CMS Collaboration for the content of the presentation and the ICNFP 2017 conference organizers for opportunity to present these results and warm hospitality.
References
[1] The CMS Collaboration, JINST3, S08004 (2008).
[2] The CMS Collaboration, CMS-PAS-BPH-13-008, arXiv:1710.08949 (Submitted to Eur. Phys. J. C.).
[3] LHCb Collaboration, Phys. Lett. B742, 29-37 (2015). [4] The CMS Collaboration, JHEP05, 013 (2017).
[GeV]
PDG
)
s 0
)+M(B
±
π s 0
M(B
∆
5.5 5.6 5.7 5.8 5.9
Candidates / 8 MeV
0 200 400 600 800 1000 1200 1400
(8 TeV) -1 19.7 fb CMSPreliminary
(a)
[GeV]
PDG
)
s 0
)+M(B
±
π s 0
M(B
∆
5.5 5.6 5.7 5.8 5.9
Candidates / 8 MeV
0 200 400 600 800 1000 1200 1400
(a)
(8 TeV) -1 19.7 fb CMSPreliminary
(b)
Figure 5. (a): B0
sπ±invariant mass distribution for the B0s signal region and B0s sidebands. (b): fit to the B0sπ±
invariant mass distribution in the B0
s signal region [11].
requirements on K+K−mass, which allows the B0
→J/ψK+π−decay to contribute to the reconstructed
B0
s →J/ψK+K−sample. Consequently, the decays of excited B meson states B (∗)+ 1,2 →B
(∗)0π+produce
clear excess in the reconstructed B0sπ±invariant mass distribution [11].
An upper limit onρXis obtained: ρX < 3.9%@ 95% CL for pT(B0s) > 10 GeV [11]. The main source of systematic uncertainty is the knowledge of the efficiency ratioǫX/ǫB0
s from the simulation.
6 Summary and acknowledgments
In summary, CMS presents recent Heavy Flavour physics results. The measured lifetimes of B hadrons are among the most precise to date. First observation ofΥ(1S) pair production in proton proton collisions is made and the corresponding cross section is measured. The P1 and P′5 angular parameters of the rare decay B0
→K∗0µ+µ−are measured with precision at the level of the best
pre-vious measurements, and they are found to be in agreement with the Standard Model predictions and previous results from LHCb and Belle collaborations, thus no evidence for physics beyond the SM is obtained. The search for X(5568) is presented, and an upper limit is set on the relative production in agreement with the LHCb collaboration.
The author’s work was supported by the Russian Ministry of Education and Science contracts 3.2989.2017 and 14.A12.31.0006. The author would like to thank the CMS Collaboration for the content of the presentation and the ICNFP 2017 conference organizers for opportunity to present these results and warm hospitality.
References
[1] The CMS Collaboration, JINST3, S08004 (2008).
[2] The CMS Collaboration, CMS-PAS-BPH-13-008, arXiv:1710.08949 (Submitted to Eur. Phys. J. C.).
[3] LHCb Collaboration, Phys. Lett. B742, 29-37 (2015). [4] The CMS Collaboration, JHEP05, 013 (2017).
[5] LHCb Collaboration, Phys.Rev.Lett.118no. 11, 111801 (2017).
[6] LHCb Collaboration, JHEP02, 104 (2016).
[7] The CMS Collaboration, CMS-PAS-BPH-15-008, arXiv:1710.02846 (Submitted to Phys. Lett. B).
![Figure 1. Ratio of efficiency-corrected ct distributions for B+c and B+ signals [2]. The line shows the fit resultwith an exponential function.](https://thumb-us.123doks.com/thumbv2/123dok_us/8042890.1339298/2.482.145.324.88.207/figure-eciency-corrected-distributions-signals-resultwith-exponential-function.webp)
![Figure 3. Distributions of K+π−µ+µ− mass and three angular variables in the third bin of q2 (4.30 < q2 <6.00 GeV2) from the decay B0 → K∗0µ+µ− [7].](https://thumb-us.123doks.com/thumbv2/123dok_us/8042890.1339298/4.482.47.433.89.314/figure-distributions-mass-angular-variables-bin-gev-decay.webp)
![Figure 4. Measured values of P1 and P′5 as a function of q2 from the B0 → K∗0µ+µ− decay [7], compared withLHCb [6] and Belle [5] results](https://thumb-us.123doks.com/thumbv2/123dok_us/8042890.1339298/5.482.55.439.81.226/figure-measured-values-function-compared-withlhcb-belle-results.webp)