Influence
of Brush Control on White-tailed
Deer Diets in North-Central Texas
DEE A. QUINTON, RONALD G. HOREJSI AND JERRAN T. FLINDERS Abstract
Botanical composition of white-tailed deer fecal pellets from untreated and brush-controlled areas of the Texas Rolling Plains was studied by microscopic analysis. Deer showed a marked preference for 11 of 54 plant species selected as food from a total of 250 identified on the study area. The bulk of the diet was comprised of mistletoe on non-brush control areas and of prickly- pear on brush-controlled areas. Similarity indices relating habitat across diets as well as diets across a habitat indicated that several habitats had preferred foods removed. These habitats also had low populations of deer. Brush control involving limited removal of noxious species affected dietary selection of deer but did not appear to affect overall deer usage of the habitats studied.
Ever-increasing costs and low returns to the ranching industry in Texas has made the noxious brush problem an item of major concern. With more than 50% of Texas rangeland covered with brush too dense for optimal livestock production and an additional 23% moderately infested (Smith and Rechenthin 1964), brush control has become a common practice. This control has been used mainly for increasing grass and livestock production, with little effort expended to document the effects of brush control on wildlife populations.
species in the diet of white-tailed deer (Odoco&us virginianus), to ascertain deer diets in various brush control habitats of
The value of wildlife resources becomes increasingly impor- tant to land managers when leased trespass rights for hunting compare favorably with economic returns from livestock pro- duction (Ramsey 1965). Since habitat management is of para- mount importance for sustained optimal production of game animals, land managers should carefully scrutinize brush con- trol practices that will affect wildlife populations. The objec- tives ot this research were to determine the importance of brush
level areas. Soils are deep on level areas and shallow with limestone outcroppings along drainage channels. Precipitation averages 69 cm per year (Korschgen 1967).
Vegetational communities in the area included 250 different species of plants. Valley bottom habitat had large honey mesquite (Prosopis
glundulosa), pecan (Carya illinoensis), and soapberry (Sapindus saponaria) as the most prevalent trees. Pricklypear cactus (Opuntia macrorhiza) and tasajillo (Opuntia leptocaulis) were prevalent in the midstory. Numerous grasses and forbs made up the understory. Upland vegetation differed in that honey mesquite was dominant in the overstory.
Texas wintergrass (Stipa feucatricha), buffalograss (Buchloe ducty- foides), sand dropseed (Sporobofus cryptundrus), slim tridens (Tri-
dens muticus), vine mesquite (Panicum obtusum), sideoats grama
(Bouteloua curtipendula), and threeawns (Aristidu spp) were common grases. Common torbs mcludeci pelotazo (Abutilon incanum), western ragweed (Ambrosia psilostachya), wine cup (Callirhoe involucrata),
spectacle pod (Dithyrea wislizensii), spreading sida (Sidujilicaulis),
and silverleaf nightshade (Solanum elaeagnijolium). More prevalent browse species included ironwood (Bumelia lanuginosa), mistletoe
(Phorodendron viflosum), polecat bush (Rhus aromatica), and little- leaf sumac (R. microphylla).
Brush control on the study area ranged from no treatment to an attempt at total removal of brush and trees. Habitats studied included an untreated upland; an upland from which all trees and brush had been removed with a crawler bulldozer in 1972; an upland treated with 2,4,5-T and chained in 1957, resprayed in 1972; an upland treated with 2,4,5-T in 1964; an untreated valley bottom area; and a valley bottom area where mesquite and cacti had been selectively bulldozed in 1964.
The smallest habitat was 1,200 ha in size, an area which could accommodate 4.7 separate home ranges of white-tailed deer.
Methods north-central Texas, and to compare the similarity of deer diets
to available forage in deer habitats.
Study Area
The study was conducted on 17,000 ha of native grassland located near the juncture of Haskell, Shackleford, and Throckmorton counties in the Rolling Plains of north-central Texas. The area, traversed by the Clear Fork of the Brazos River, is typified by varying topography, ranging from nearly flat plains to rough broken terrain along the river. Differences in elevation (152 m) between valley bottom areas and adjacent ridges limit mechanical brush control practices to the more
The authors are research scientist, Agriculture Canada Research Station, Kamloops, Brnish Columbia, V2B 8A9; biologist, Arizona Game and Fish Department, Research Division, 2?‘2 West Greenway Road, Phoenix, Arizona 85023; and associate professor, Department of Botany and Range Science, Brigham Young University, Provo, Utah 84hO3.
This report is a contribution of the College of Agricultural Sciences, Texas Tech Untversity. Publications Number T-9-180.
Manuscript received January I, 1978.
Percent cover and frequency of vegetation was taken along two randomly located 250-m line transects in each habitat. Four 8 x 15 m intensive sampling units, located 35 m apart, along each line were subdivided into four 2 x 15-m belts to obtain cover and frequencies of
trees and shrubs. Data for grasses, forbs, succulents and small shrubs were obtained from three 30 X 30-cm quadrats in each belt.
A microhistological examination of deer feces was used to deter- mine diets of deer, We collected 10 pellet groups of fresh feces from the center of each habitat during July, October, December ( 197 1 ), and April (1972). Duplicate slides were prepared according to methods outlined by Sparks and Malechek (1968), Ward (1970), Flinders and Hansen (1972), Baumgartner and Martin (1939), and Baker and Wharton (1952). Ten fields per slide were examined at 100 magni- fication to obtain an estimate of the relative frequency of food items in deer diets (Free et al. 197 1; Hansen and Reed 1975). We converted relative frequencies to particle densities (Fracker and Brischle 1944), and thence to relative percent dry weight of each food item identified in deer feces (Sparks and Malechek 1968). Individual food items were
identified by comparing histological features identified in fecal fragments to a reference slide collection prepared from plants collected on the study area (Davies 1959; Brusven and Mulkem 1960; Starr
1961).
Kulczynski’s mathematical expression of similarity (Oosting 1956) was used to relate similarities among habitats and diets.
Population estimates of the deer herd were obtained using a spotlight from a moving vehicle after dark.
Results and Discussion
Habitats
Table 1 shows the degree of similarity among habitat overstory and understory vegetation. The bulldozed valley and untreated unpland were most similar in overstory to the untreated valley bottoms, whereas the understory of the sprayed upland and untreated valley bottoms most closely resembled that of the untreated upland habitat. The generally low similarities indicate the uniqueness and diversities of the habitat communities involved.
Honey mesquite was the most prevalent species of tree on the untreated river bottoms (55% relative frequency, 50% cover). Iron- wood and hackberry (Celtis occidentalis) had relative frequencies of 22% and 16% respectively. Pecan, soapberry, walnut (Juglans sp), and buckeye (Unganadia speciosa) were scattered throughout the area. Tasajillo and mistletoe, which was parasitic to mesquite, were common with relative frequencies of 71% and 16%, respectively. Grasses accounted for 56% of the relative frequency and 70% of the cover of the understory.
Bulldozed valley bottoms had a more park-like appareance than untreated valley bottoms. Ironwood predominated in the overstory (44% relative frequency, 5% cover), mesquite was reduced to 32% relative frequency, and soapberry had increased to 16% relative frequency. Lotebush (Ziziphus obtusifolia) at 32% relative frequency had replaced tasajillo as the predominant shrub. Mistletoe had been reduced in prevalence in direct proportion to the reduction in Mes- quite. Grass had a relative frequency of 60%, making up 56% of the ground cover in the understory.
The overstory of the untreated upland was primarily mesquite, hackberry and ironwood with relative frequencies of 41%, 18%, and 13% respectively. Elbowbush (Forestieru pubescens) and mesquite- parasitic mistletoe were prevalent browse species (relative frequencies of 7% and 31% respectively). Grasses and forbs were equally distributed. Pricklypear accounted for 5% of the total ground cover. The bulldozed upland habitat was an open grassland, with grasses making up 55% of the relative frequency and 60% of the cover of the understory. Mesquite seedlings were the principal woody species present, with 28% frequency and Cl% cover. Pricklypear and mistletoe were reduced to 1% of the total ground cover.
Mesquite was reinvading the sprayed upland site, having a relative frequency of 38% but accounting for only 3% of the ground cover. lronwood catclaw (Acacia sp), elbowbush, hackberry, buckeye and lotebush all had relative frequencies about 5% and mistletoe had a
relative frequency of 19%. Grasses, with a relative frequency of 58%, were twice as prevalent as forbs. Pricklypear was the predominant midstory vegetation, making up 8% of the total cover.
Grasses were most prevalent on the sprayed-chained-resprayed site, accounting for 60% relative frequency and 87% of the ground cover.
Mesquite and lotebush were common, with relative frequencies of 34% and 28%, respectively. However, these shrubs were young plants, as each contributed only 1% of the total cover.
Diets
Fifty-four (Table 2) of the 250 species of plants identified on the study area were ingested by white-tailed deer. Of the 54, 11 made up the bulk of their diet (Table 3).
Mistletoe was the single most important food, accounting for 35% of the over-all diet. Mistletoe was the prevalent dietary item on untreated habitats. Its prevalence in diets of deer decreased in relation to its decreased occurrence in the habitat. Mistletoe made up 80-90% of the relative dry weight (RDW) of winter and spring diets respectively, on untreated valley bot- tom, as well as 70% RDW of the winter diet on bulldozed valley bottom habitat. Mistletoe in spring diets in bulldozed valley bottoms declined to 19% RDW when ironwood browse in- creased in prevalence in the diet. Mistletoe usage was only 9% to 17% RDW, respectively, of the summer and fall diets of deer on treated valley bottom habitats and 1% to 6% RDW, respect- ively, of the summer and fall diets in untreated valley bottom habitats. It was also prevalent in the winter and spring diets on upland habitats. Ingestion of mistletoe was greatest on the sprayed upland site, where its frequency in the habitat was only about one-half that of the untreated upland site. High incidence
of mistletoe in diets was also noted in the sprayed-chained-re- sprayed and the bulldozed upland habitats. This prevalence in the diet from habitats having a low frequency of hot plants (honey mesquite) can partially be explained by canopy structure of the plant community. The overstory in treated upland habitats consisted of short regrowth and new plants with the foliage readily accessible to deer. Mistletoe in this canopy was thus easily accessible to browsing deer.
Pricklypear was the second most important food item, accounting for 18% RDW of the total diet. Consumption of pricklypear was greatest on areas which had experienced more intense efforts at brush control (bulldozing and sprayed-chain- ed-resprayed). Pricklypear was most prevalent in diets in bulldozed valley bottom habitats during summer and fall, when it made up 18% and 60% RDW, respectively, of the diet. With the exception of the fall diet (20% RDW) pricklypear was relatively unimportant in untreated valley bottom habitats. Pricklypear on bulldozed upland and sprayed upland sites made up 32% and 26% RDW, respectively, of fall diets; 27% and 18% RDW, respectively, of summer diets; and small amounts of spring and winter deer diets. In the absence of other available
Table 1. Symmetrical matrices of similarity indices (9’0) and Standard Errors of plant communities in various habitat types in north-central Texas.
Treatment Untreated
Dozed valley bottom valley bottom
Untreated upland
S-C-S’ upland
Sprayed upland
Dozed upland
Untreated valley bottom Bulldozed valley bottom Untreated upland S-C-S upland Sprayed upland Bulldozed upland
’ Sprayed-chained-resprayed
13.420.7 13.6-r-1.4
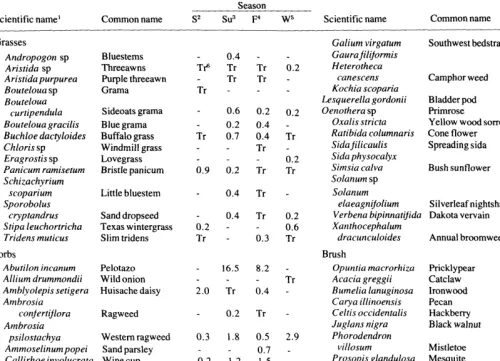
Table 2. Percent relative dry weight of food items in the diet of white-tailed deer in the Rolling Plains of north-central Texas.
Scientific name’ Common name
Season
S2 Su3 F4 W5 Scientific name Common name
Season
S2 Su3 F4 W5
Grasses
Andropogon sp Bluestems A ristida sp Threeawns
Aristidapurpurea Purple threeawn
Bouteloua sp Grama
Bouteloua
curtipendula Sideoats grama
Bouteloua gracilis Blue grama
Buchloe dactyloides Buffalo grass
Chloris sp Windmill grass
Eragrostis sp Lovegrass
Panicum ramisetum Bristle panicum
Schizachyrium
scoparium Little bluestem
Sporobolus
cryptandrus Sand dropseed
Stipa leuchortricha Texas wintergrass
Tridens muticus Slim tridens Forbs
Abutilon incanum Pelotazo
Allium drummondii Wild onion
Amblyolepis setigera Huisache daisy
Ambrosia
conjertijlora Ragweed
Ambrosia
psilostachya Western ragweed
Ammoselinumpopei Sand parsley
Callirhoe involucrara Wine cup
Calyophys serrulatus Yellow evening primrose
Chamaesaracha
conoides False nightshade
Cirsium ochrocentrum Yellow spine thistle
Desmanthus velutinus
Dithyrea wislizenii Spectacle pod
0.4 -
T$ Tr Tr Tr Tr
Tr - -
0.6 0.2 0.2 0.4 Tr 0.7 0.4 Tr
0.9 0.2 Tr
0.4 Tr
0.4 Tr 0.2
0.2 - - 0.6
Tr - 0.3 Tr
16.5 8.2
2.0 Tr 0.4
0.2 Tr
0.3 1.8 0.5
0.7 0.2 1.2 1.5
1.0 1.6 Tr Tr
Tr 0.2 0.5
Tr - -
Tr - -
Tr - 0.2 0.2 Tr 0.2 Tr Tr 2.9 0.3 Galium virgatum Gaura jilijormis Heterotheca canescens Kochia scoparia Lesquerella gordonii Oenothera sp
Oxalis stricta Ratibida columnaris Sida jilicaulis Sida physocalyx Simsia calva Solanum sp
Solanum elaeagnijolium
Southwest bedstraw
Camphor weed
Bladder pod Primrose
Yellow wood sorrel Cone flower Spreading sida
Bush sunflower
Silverleaf nightshade 4.8 2.9 1.9 3.0
0.3 0.5 Tr
Verbena bipinnatuida Dakota vet-vain
Xanthocephalum
dracunculoides Annual broomweed
Brush
Opuntia macrorhiza Pricklypear
Acacia greggii Catclaw
Bumelia lanuginosa Ironwood
Carya illinoensis Pecan
Celtis occidentalis Hackberry
Juglans nigra Black walnut
Phorodendron
villosum Mistletoe
Prosopis glandulosa Mesquite
Rhus aromatica Polecat bush
Rhus microphylla Little-leaf sumac
Sapindus saponaria Soapbeny
Ungnadia speciosa Mexican buckeye
Ziziphus obtusijolia Lotebush Unknown
1.1 Tr - -
0.7 1.4 1.0 -
7.5 0.7 - 0.5
Tr - - -
0.5 0.5 - -
0.3 - - -
Tr 0.5 - 0.2 - - 3.5 16.1 Tr
Tr - Tr
1.5 3.7 1.0
Tr - - Tr
0.3 0.5
6.5 21.5 30.0 14.5 Tr 11.9 16.4 2.2 4.5
0.7 0.2 0.5 0.4 0.2 - -
0.2 -
51.3 5.4 17.0 65.0 5.8 1.7 2.0 5.1 15.8 1.9 0.5 2.0 0.7 -
Tr Tr 0.6 0.2 0.7 0.4
0.2 - 3.1 0.6 6.2 -
’ Summer=July
’ Fall =October ’ Winter = December
” Tr= trace, 0. I% or less in diet
browse, pricklypear was the staple food of deer in the sprayed- slight, ranging from a low of 0.4% RDW of the fall diet to 4% chained-resprayed habitat. This is readily apparent when 94%) RDW of the spring diet.
75%, 82% and 28% RDW’s of the fall, winter spring and summer diets respectively, consisted solely of pricklypear fruits
Ironwood (9% RDW of total diet) was extensively browsed in
and pads. Usage of this forage in untreated upland habitats was
all habitats during the summer, and during the winter and spring on habitats where brush had been treated. It was the most
Table 3. Relative percent dry weights of major food items in yearly diets of white-tailed deer in various habitats in north-central Texas.
Untreated Bulldozed valley bottom valley bottom
Untreated upland
Sprayed upland
S-C-S’ Bulldozed
upland upland
Mistletoe Pelotazo Pricklypear Ironwood Polecat bush Mesquite Spreading sida Camphor weed Silverleaf nightshade Western ragweed Bush sunflower Other 50.9 9.3 5.9 6.6 5.4 1.7 2.3 3.3 1.3 2.0 11.1
23.2 33.9 44.6
0.4 4.0 17.2
20.8 2.1 12.1
20.4 8.4 4.2
7.5 6.5 2.5
2.5 8.8 2.8
3.0 10.4 3.0
0.6 6.9 1.0
1.5 3.0 0.9
2.6 0.3 0.6
0.3 3.0 1.6
17.1 12.7 9.5
7.6 69.8 3.8 Tr’ 1.1 Tr Tr 8.3 0.4 9.4 16.8 4.3 29.7 8.6 3.8 0.7 8.9 1.3 7.0 1.9 17.0
’ S-C-S = Sprayed-chained-resprayed
’ Tr=trace, items occurring as 0.1% or less.
prevalent dietary item in spring (48% RDW) and summer (20% RDW) samples from the treated valley bottom habitat. It was second in importance (13% RDW) for the winter diet and was not identified in fall diets in bulldozed valley bottom areas. Ironwood in untreated valley bottom sites made up 21% and 5%, respectively, of the summer and winter diets but was unimportant as a deer food during the fall and spring. The use of ironwood by deer did not follow any general pattern in upland habitats. Ironwood made up 27% and 15% RDW respectively of the summer diet in the untreaed and bulldozed upland habitats, and 5% and 2% RDW of the fall diets of deer for the same areas. In addition it constituted 5% RDW of the winter diet in the sprayed upland, and 15% and 5% RDW, respectively, of the spring diet of deer in the sprayed-chained-resprayed and spray- ed upland habitats.
Polecat bush was a major food only in the summer diets of deer, when it accounted for 28%, 20%, 21%, 5% and lo%, respectively, of the RDW ingested in the bulldozed valley, untreated upland, untreated valley, bulldozed upland, and sprayed upland sites. With the exception of the untreated upland habitats, 5% RDW of the diet, polecat bush was only slightly browsed in fall and was not identified in spring or winter diets. Forbs were important in diets of deer during the seasons of availability. Pelotazo w&s an important food in the sprayed upland habitat during the summer (44% RDW) and fall (25% RDW). It was also ingested in moderate quantities in the untreated upland habitat (13% RDW of diet), bulldozed upland
(15% RDW of diet), and in untreated valley’bottom (2 1% RDW of diet) habitat during summer. In addition, pelotazo made up
17% RDW of the fall diet in untreated valley bottoms. Spread- ing sida was ingested in fall while camphor weed (Heterotheca cunescens) was a spring food in upland habitats. Silverleaf nightshade was ingested in all seasons, with the greatest use during summer, fall, and winter in untreated habitats and during spring in treated habitats. Bush sunflower (Simsia calva) was identified in fall diets, while western ragweed, with the ex- ception of the dozed upland, was a winter food.
Honey mesquite twigs and pods were more frequent in the diet during winter and spring. However, mesquite pods were in short supply during these seasons, and were scarce on the study area. Deer season of use data does, however, agree with Krausman (1978), who reported mesquite in deer diets in Big Bend National Park during the periods May-June and August- October, and with Anderson et al. (1965), who reported diets from the Guadalupe mountains in southeastern New Mexico. The prevalence of this food in the diet when it was not abundant in the habitat indicates that deer were actively seeking mesquite. Mesquite is additionally important to deer because it is the host plant of mistletoe, the major food item of white-tailed-deer in this locality.
Diet Comparisons
The greatest similarity between deer diets on a particular habitat and the forage available in the habitat was 8.9% for the sprayed upland. Similarity indices (S.I.) between diets and habitats were generally in the range of 4% to 6.5% similarities. The highest values were comparisons among valley habitats to all diets from all habitats with the exception of the sprayed- chained-resprayed habitat. The sprayed-chained-resprayed habitat compared to all diets, as well as the sprayed-chained- resprayed diet to all habitats, consistently produced the lowest values of similarity (<3%). The dozed upland habitat compared to dozed upland diet also had a S .I. of little more than 3%. These low S .I. indicate the severity of treatment to the habitat as
explained below.
The low similarity indices between diets and associated forage available on the habitats and between diets across habitats indicate the degree of selectivity exhibited by deer. In perusing the similarity indices for diets with habitat it was noticed that low values were associated with brush control treatments which had heavily reduced preferred foods in the habitat. We further noticed that decreases in this S.I. were paralleled by deer population that would be found in an area (Table 4). Areas of low similarity between diet and habitat generally had the lowest populations of deer.
Table 4. Density estimates of white-tailed central Texas.
deer in various habitats in north-
Treatments Deer/ 100 ha
Untreated valley bottom 7.3
Untreated upland 7.0
Bulldozed valley bottom 6.5
Sprayed upland 4.0
Sprayed-chained-resprayed upland 3.0
Bulldozed upland 2.0
Similarity indices among diets from different habitat types indicated that with the exception of the sprayed-chained-re- sprayed population, diets were generally about 65 to 69% similar. Diet comparisons between the sprayed-chained-re- sprayed population and other populations ranged from 29% to 45% similar, indicating that the forage complex on this habitat had been affected to the extent that white-tailed deer had been forced to markedly alter their diets (Table 3).
Discussion
Diets of white-tailed deer have been extensively studied at various seasons in numerous localities. Studies in Texas indi- cate that deer in south Texas are primarily grazers (Chamrad and Box 1968; Drawe 1968) while other studies indicate they are primarily browsers (Davis and Winkler 1968). Everitt and Drawe (1974) reported diets of deer varied in constituents and major composition in relation to individual comrpunity types on the same ranch. Our data support the findings of these later researchers.
Examination of fecal constituents showed that deer diets in the Texas Rolling Plains land resource area varied in relation to habitat manipulation. Mistletoe was predominant in deer diets on areas where trees infected with this parasite had been retained in the habitat. Pricklypear was the main food on areas which had experienced brush control measures aimed at elimination of brush species and hence elimination of mistletoe. In untreated habitat, browse was more prevalent in the diet, whereas cacti and forbs constituted the bulk of the diet in treated habitats.
Literature Cited
Anderson, A.E., W.A. Snyder, and G.W. Brown. 1965, Stomach content analysis related to condition in mule deer, Guadalupe Mountains, New Mexico. J. Wildl. Manage. 29:352-366.
Baker, E.W., and G.W. Wharton. 1952. An Introduction to Acarology. MacMillan and Co., New York. 465 p.
Baumgartner, L.L., and A.C. Martin. 1939. Plant histology as an aid in squirrel food-habit studies. J. Wild]. Manage. 3:266-268.
Brusven, M.A., and B.M. Mulkern. 1960. The use of epidermal character- istics for the identification of plants recovered in fragmentary condition from crops of grasshoppers. North Dakota Agr. Exp. Sta. Res. Rep. 3. 11 p. Chamrad, A.D., and T.W. Box. 1968. Food habits of white-tailed deer in
south Texas. J. Range Manage. 2 1: 158-163.
Correll, D.S., and M.D. Johnston. 1970. Manual of the Vascular Plants of Texas. Texas Res. Found. Remner, Texas. 1881 p.
Davis, I. 1959. The use of epidermal characteristics for the identification of grasses in the leafy stage. Brit. Grassl. Sot. J. 14: 7-16.
Davis, R.B., and C.K. Winkler. 1968. Brush vs. cleared range as deer habitat in southern Texas. J. Wildl. Manage. 32: 321-329.
Drawe, D.L. 1968. Mid-summer diet of deer on the Welder Wildlife Refuge. J. Range Manage. 21: 164-166.
Everitt, J.H., and D.L. Drawe. 1974. Spring food habits of white-tailed deer in the south Texas plains. J. Range Manage. 27:15-20.
Flinders, J.T., and R.M. Hansen. 1972. Diets and habitats of jackrabbits in northeastern Colorado. Range Science Dep. Sci. Ser. No. 12. Colorado State Univ., Fort Collins. 29 p.
Fracker, S.B., and J.A. Drischle. 1944. Measuring the local distribution of Ribes. Ecology 25:283-303.
Free, J.C., P.L. Sims, and R.M. Hansen. 1971. Methods of estimating dry- weight composition in diets of steers. J. Animal Sci. 32:1003-1007. Korschgen, L.J. 1967. Feeding habits and foods. pp. 137-198. In: B.H.
Hewitt (ed.) The Wild Turkey and Its Managment. The Wildl. Sot., Washington, D.C. 589 p.
Krausman, Paul R. 1978. Forage relationships between two deer species in the Big Bend National Park, Texas. J. Wildl. Manage. 42:101-107.
Oosting, H. J. 1956. The Study of Plant Communities. W.H. Freeman andCo., San Francisco. 440 p.
Ramsey, C.W. 1965. Potential economic return from deer as compared with livestock in the Edwards Plateau Region of Texas. .I. Range Manage. 18:247- 250.
Smith, H.N., and C.A. Rechenthin. 1964. Grassland restoration-the Texas brush problem. U.S. Dep. Agr. Soil Conserv. Serv. Temple, Texas. Sparks, D.R., and J.C. Malechek. 1968. Estimating percentages dry weight
in diets using a microscopic technique. J. Range Manage. 21:264-265. Storr, G.M. 1961. Microscopic analysis of feces, a technique for ascertaining
the diet of herbivorous mammals. Aust. J. Bio. Sci. 14:157-164.
THINK
BAUSCH 6 LOMB.. .
FOR
GRAPHICAL
DATA TRANSFER WORK
With a Bausch & Lomb ZOOM TRANSFER SCOPE* instrument, you can quickly update a data base or prepare a special purpose thematic map without expensive data transfer, projection or darkroom equipment. These instruments work on the camera lucida principle that optically mix aerial
photographs and data base without projection. Compare these performance features with what you are now using.
l Built-in scale and stretch correction systems compensate for photographic distortions.
l Compact, lightweight design offers total portability. Can be used in a lighted office on any flat surface.
l Zoom control instantly matches photograph to data base scale.
l Accommodates all photographic formats including transparencies and prints (black and white or color). Stereo model (illustrated) helps you examine topographical and structural features.
l Two models feature a photographic mode for permanent documentation.
CALL US AT 716 338-6000
BAUSCH
6 LOMB
Scientific
Optical Products
Division
And let a Bausch & Lomb representative recommend the instrument that best meets your needs. Or, send
coupon for illustrated literature. ROCHESTER, NEW YORK 14602 USA
*ZOdM TRANSFER SCOPE and Z.T.S. are trademarks of Bausch & Lomb Incorporated for graphlcal data transfer instruments.
716-338-6000. TWX 510-253-6189 TELEX 978231, CABLE: BAUSCH (1, LOMB
!
iIn Canada: Bausch & Lomb Canada, Ltd. Scientific Optical Products Division, 2001 Leslie Street, Don Mills, Ontario, Canada M3B 2MS