DOI: 10.1534/genetics.111.128025
The Relationship Between Relative Solvent Accessibility and Evolutionary
Rate in Protein Evolution
Duncan C. Ramsey,* Michael P. Scherrer,* Tong Zhou,
†and Claus O. Wilke*
,1*Center for Computational Biology and Bioinformatics, Institute for Cellular and Molecular Biology and Section of Integrative Biology, University of Texas, Austin, Texas 78712 and†Section of Pulmonary, Critical Care, Sleep and Allergy, Department of Medicine and Institute
for Personalized Respiratory Medicine, University of Illinois, Chicago, Illinois 60612 Manuscript received February 21, 2011
Accepted for publication March 16, 2011
ABSTRACT
Recent work withSaccharomyces cerevisiaeshows a linear relationship between the evolutionary rate of sites and the relative solvent accessibility (RSA) of the corresponding residues in the folded protein. Here, we aim to develop a mathematical model that can reproduce this linear relationship. Wefirst demonstrate that two models that both seem reasonable choices (a simple model in which selection strength correlates with RSA and a more complex model based on RSA-dependent amino acid distributions) fail to reproduce the observed relationship. We then develop a model on the basis of observed site-specific amino acid distribu-tions and show that this model behaves appropriately. We conclude that evolutionary rates are directly linked to the distribution of amino acids at individual sites. Because of this link, any future insight into the biophysical mechanisms that determine amino acid distributions will improve our understanding of evo-lutionary rates.
T
HE requirement for successful and efficient proteinfolding imposes significant biophysical constraints on coding sequences. These constraints shape how se-quences evolve. Mutations that interfere with correct folding will generally be removed by purifying selection. Likewise, mutations that do not interfere with folding are often neutral, or nearly so, and accumulate over time. As a consequence of this interaction between pro-tein biophysics and molecular evolution, signatures of protein structure can be found in the divergence pat-terns of coding sequences (Franzosa and Xia 2008;Lobkovskyet al.2009; Wilkeand Drummond2010).
Mutagenesis experiments have shown that different positions in proteins have widely differing tolerances to amino acid substitutions (Reidhaar-Olsonand Sauer
1988; Bowieet al.1990; Lauand Dill1990; Guoet al.
2004; Campbell-Valoiset al.2005; Smith and Raines
2006). On average, however, mutations introduced at solvent-exposed sites are less likely to disrupt protein structure and function than mutations introduced at buried sites. The latter tend to destabilize proteins, through steric hindrance and introduction of strained conformations (Chothiaand Finkelstein 1990).
The higher tolerance of solvent-exposed sites to amino acid substitutions results in a correlation between the rate at which individual sites in coding sequences
accumulate mutations over evolutionary time and the solvent exposure that these sites have in the expressed protein. Studies that have linked evolutionary rate with solvent exposure have consistently found that buried sites are more conserved and evolve slower than exposed sites (Overington et al. 1992; Goldman et al. 1998;
Mirny and Shakhnovich 1999; Bustamante et al.
2000; Bloom et al. 2006; Conant and Stadler 2009;
Franzosa and Xia 2009). At the same time, however,
proteins with a larger core (more buried residues) evolve faster than proteins with a smaller core (Bloom et al.
2006; Ferrada and Wagner 2008; Zhou et al. 2008;
Franzosa and Xia 2009). This apparent paradox can
be resolved by observing that a larger core allows surface residues to vary more (Shakhnovichet al.2005; Bloom
et al.2006; Franzosaand Xia2009).
Recently, Franzosa and Xia (2009) developed
a novel approach to analyze the relationship between evolutionary rate and solvent accessibility. They first mapped a large fraction of the genome of the yeast Saccharomyces cerevisiae onto homologous crystal struc-tures from the Protein Data Bank (PDB). On the basis of this mapping, Franzosaand Xia(2009) determined
relative solvent accessibility (RSA) for300,000 sites in the yeast genome. They then grouped these sites into bins of similar RSA value and calculated for each bin the average evolutionary rate dN/dS in a phylogeny of four yeast species. They found a strikingly linear rela-tionship between evolutionary rate and RSA. Every 1% increase in RSA was associated with an increase in dN/dSof 0.001 (Franzosa and Xia 2009). Why the
Supporting information is available online athttp://www.genetics.org/ cgi/content/full/genetics.111.128025/DC1.
1Corresponding author: Integrative Biology, 1 University Station–C0930,
University of Texas, Austin, TX 78712. E-mail: [email protected]
relationship between evolutionary rate and RSA is lin-ear remains unknown.
Here, we employ mathematical modeling and bio-informatics analysis to explore what mechanism could be responsible for the linear relationship. Wefirst show that a two-allele model in which selection strength correlates with RSA fails to reproduce this relationship. We then develop a more sophisticated model on the basis of amino acid frequencies and show that this model fails as well. The second model fails because amino acid frequencies averaged over many sites with comparable RSA differ dramatically from the distribu-tions of allowed amino acids at individual sites. By building a model on the basis of the latter distributions, we can reproduce an approximately linear relationship between evolutionary rate and RSA.
METHODS
Evolutionary rate as a function of RSA:To verify the linear relationship between evolutionary rate and RSA at the amino acid level, we reproducedFranzosaandXia’s
(2009) results using amino acid distance instead ofdN/dS. First, we obtained orthologs between S. bayanus and S. cerevisiae from the Saccharomyces Genome Database as in Zhou et al. (2008) and aligned sequences with
MUSCLE (Edgar 2004). We mapped the S. cerevisiae
sequences to structures using three iterations of PSI-BLAST against the PDB, requiring a minimum of 80% sequence identity for a match. We ended up with 525 matching structures. For these matched structures we used the program DSSP (Kabsch and Sander 1983) to calculate
solvent accessibility at each site. To obtain RSA, we normal-ized the solvent accessibilities calculated by DSSP with re-spect to an extended Gly-X-Gly peptide (Creighton
1992). We binned sites by RSA and then calculated evolu-tionary rate K with the PAML package codeml (Yang
2007), using the Whelan and Goldman (WAG) model for amino acid distance (Whelanand Goldman2001).
Amino acid distribution over many yeast proteins:To calculate amino acid distributions, we used the same set of S. cerevisiae ORFs mapped to protein structures. We binned all sites by RSA as above. (A few residues had RSA.1 and we treated them as if they had RSA¼ 1.) We then calculated the relative frequency of each amino acid in each RSA bin. For visualization, we ordered amino acids by hydrophobicity using the Fauchere–Pliska octanol scale (Fauchereand Pliska
1983).
Coordination number and RSA correlation: We computed the correlation between normalized coordi-nation number and RSA using the same set ofS. cerevi-siae proteins as above. The coordination number of a site is the number of sites it is in contact with, and we considered two sites to be in contact if any two heavy atoms are within 4.5 Å of each other (excluding se-quence neighbors). We used the BioPython module
Bio.PDB (Hamelryck and Manderick 2003) to
com-pute coordination numbers, which for each site we nor-malized by the average over the entire protein.
Variation at individual sites over structural homologs: To compute distributions at individual sites across structurally similar proteins, we employed a PSI-BLAST search of the NCBI nonredundant database (NR) to construct alignments from various seed proteins. As seed proteins, we used the proteins obtained by mapping the yeast genome to the PDB (as described above). We then filtered the alignment given by PSI-BLAST such that the remaining sequences all had between 40% and 80% pairwise sequence similarity with all other sequences in the alignment. Thisfiltering procedure excluded redundant sequences while still ensuring structural similarity (Chothiaand Lesk1986;
Holmet al.1992). We retained onlyfiltered alignments
that contained at least 50 sequences. Ourfinal data set consisted of 162 distinct alignments. In the filtered alignments, we classified each site by RSA of the seed protein at this site and placed sites into bins of similar RSA. We then calculated the alignment-wide amino acid distribution for every site. At each site, we ranked residues by declining frequency at that site. We then averaged the frequency-sorted amino acid distributions over all sites within each bin.
To characterize these averaged distributions with a single parameter, we fitted the one-parameter expo-nential function e2lk to the average amino acid fre-quency as a function of the amino acid rankk.
Analysis scripts and data to reproduce this analysis are provided insupporting information,File S1.
Parameter choices: To study numerically the behav-ior of our mathematical models of protein evolution, we had to choose suitable values for the parameters Ne (effective population size) and m (mutation rate). We chose values that are approximately correct for yeast, namelyNe¼5 · 106individuals and m ¼3.3 · 10210 mutations per site per generation (Lynch et al. 2008;
Lancaster et al.2010).
RESULTS
Franzosaand Xia (2009) found a strong linear
re-lationship between dN/dS and RSA. While their result was likely driven by selection on the amino acid level, their use ofdN/dSdoes not allow us to draw this conclu-siona priori. Their result could be confounded by vary-ing levels of selection on synonymous sites; synonymous codon usage is not uniform across genes and covaries with protein structure (Akashi 1994; Drummond and
Wilke2008; Zhouet al.2009; Leeet al.2010).
Therefore, to verify that Franzosa and Xia (2009)
bins of similar RSA values. We then concatenated all sites within each bin and calculated the amino acid distance Kbetween theS. cerevisiae and the S. bayanus sequence in each bin. Amino acid distance is a measure of evolutionary rate on the amino acid level (Whelan
and Goldman2001).
We found a near-perfect linear relationship between evolutionary rate Kand RSA (Figure 1). We interpret this result as a signal of purifying selection acting on the amino acid sequence. On average, buried sites experi-ence stronger purifying selection than exposed sites and thus evolve slower. The increased selective con-straints on buried amino acids presumably reflect the requirement for proteins to fold and function properly. That buried sites are more constrained than exposed sites is well known. Much existing theory, experiments, and sequence data support the notion that substitu-tions in the core of a protein are more likely to be dis-ruptive than substitutions in solvent-exposed regions. Yet the perfectly linear relationship between evolution-ary rate and RSA is surprising and deserves an expla-nation. We thus proceeded to explore what kind of evolutionary models could potentially reproduce this observation.
A simple two-allele model: The simplest model we can consider is a multiplicative multisite, two-allele model; in this model, an organism’s genome consists of afinite number of sites, each of which can exist in two alleles. All sites contribute multiplicatively to the overall fitness of the organism. At each site i, one of the two alleles is preferred, and we assume it hasfitness 1. The second allele is selected against and hasfitness 12si. We assume that all sites mutate with the same ratem. In such a model, in equilibrium, sites with larger siwill evolve slower than sites with smaller si. For suffi-ciently smallsi, sites will evolve neutrally at ratem.
Here and throughout, we consider haploid, asexual organisms and assume that the product of mutation rate and effective population sizeNeis small,mNe≪1. In this case, and because we consider a multiplicative model, the evolutionary rate of a genome of length L is the average of the evolutionary rates of L single-site models with identical selection coefficients. Therefore, in what follows, we consider only the evolutionary rate at a single site and ask how it changes with selection coefficients. For simplicity, we drop the site index i.
We refer to the two alleles at a site asAanda. AlleleA hasfitness 1 and alleleahasfitness 1–s. The probabil-ity that alleleagoes tofixation in a background of allele A is given by Kimura(1962):
pA/a5
12e2s
12e2Nes: (1)
Likewise, the probability that alleleAgoes tofixation in a background of allelea is given by
pa/A5
12e22s
12e22Nes: (2)
In equilibrium, and averaged over long periods of time, both alleles will be present at the site some fraction of time. We denote these fractions as F(A) andF(a), withF(A)1 F(a)¼1. We have
FðAÞ5 pa/A pa/A1pA/a
; FðaÞ5 pA/a
pa/A1pA/a
: (3)
Evolutionary rate K is the rate with which mutations originate and go to fixation. Thus,Kis given by
K5mNe½FðAÞpA/a1FðaÞpa/A: (4)
The evolutionary rate Kis of course a function ofs. Thus, we can now ask how K changes as s changes. Assuming s ≪ Ne and using standard approximations for thefixation probabilities, we obtain
KðsÞ 4smNe
e2Nes2e22Nes: (5)
For s &1/Ne, evolution is neutral, and K(s) m. For larger s, the evolutionary rate declines exponentially ins,KðsÞ 4smNee22Nes.
We now assume that the selection coefficient s is a function of RSA. We denote RSA byrin mathematical expressions. An increase inKasrincreases corresponds to a greater tolerance to mutation; hence, the selection coefficient s(r) should be a decreasing function of r. We assume thatrcan take on any value in the interval [0, 1]. The function s(r) maps this interval into some
Figure1.—Evolutionary rateKas a function of RSA, for
interval ofsvalues. Thus, we have to ask: Is there a rea-sonable mapping from r to s(r) such that K(s(r)) is approximately a linear, increasing function in r? We found that generally, such a mapping does not exist. BecauseKdecreases exponentially withs, any function s(r) that might result in approximately linear behavior ofKwill necessarily have an exponentially small range of possiblesvalues. To illustrate this result, we defined three functions with parameters that give similar ranges in [0, 1]: a linearly decaying function whose image is [0, 1.5·1025], an exponential function with image [7.3· 1026, 2 · 1025], and a logarithmic function spanning
[0, 1.8·1025]. For all three definitions ofs(r), Equa-tion 4 still produces exponentially fast growth of K as a function ofr(Figure 2). More generally, we can show that even if the difference in s corresponding to fully buried (r¼0) and fully exposed (r¼1) sites is only on the order of 1/Ne, the deviation from linearity is larger than the magnitude of the evolutionary rateKitself (see
APPENDIX). We conclude that the two-allele model
does not seem to be an appropriate model to describe the effect of relative solvent accessibility on evolutionary rate.
A model based on amino acid frequencies: We believe that the main reason why the two-allele model gives unsatisfactory results is that it replaces 20 different amino acids by only two different states, preferred and unpreferred. In real proteins, it may well be that at one site 3 amino acids are preferred and 17 unpreferred, while at a different site 5 are preferred and 15 unpreferred. All else being equal, the second site will
evolve faster than thefirst. This reasoning suggested to us that we should aim to develop a model on the basis of amino acid frequencies. The sites with the broadest distributions of amino acids should evolve the fastest, and the sites with the narrowest distributions the slowest.
Amino acid distributions in proteins have been studied extensively. The general consensus is that amino acid frequencies follow a Boltzmann distribution. The in-dividual frequencies at sites can be calculated either from stability effects [DDG values (Dokholyan and
Shakhnovich 2001; Dokholyan et al. 2002; Godoy
-Ruizet al.2004; Bloomand Glassman 2009; Schmidt am Busch et al. 2010] or from the protein’s
connec-tivity matrix (Porto et al. 2004; Bastolla et al. 2005;
Pokarowski et al. 2005; Wolff et al. 2008; Bastolla
et al.2008). In particular, Portoet al.(2004) showed that
the frequency of amino acidais proportional toe2bh(a), wherebmeasures properties of the site under consider-ation andh(a) measures properties of the amino acid. The quantity b can be derived from the protein struc-ture’s contact matrix. It varies almost linearly with the site’s coordination number normalized by the protein’s average. The quantity h(a) is the interactivity of amino acida, a quantity highly correlated with hydrophobicity (Bastollaet al.2005).
Because solvent occlusion happens through interre-sidue contacts, we hypothesized that the normalized coordination number should correlate strongly with RSA and that the theory of Portoet al.(2004) should
provide at least a qualitatively correct description of the amino acid distribution in different RSA bins. We found both to be the case in yeast. The normal-ized coordination number correlated well with RSA (Pearson’s r ¼ 0.66, P , 2.2 · 10216). Amino acid distributions were strongly skewed toward hydropho-bic residues at low RSA and toward hydrophilic residues at high RSA. For intermediate RSA, corresponding to b¼0, both hydrophobic and hydrophilic residues had comparable frequencies (Figure S1). Having found this correspondence, we proceeded to obtain the evo-lutionary rates predicted by the theory of Portoet al.
(2004).
The amino acid distribution at a site, combined with effective population sizeNeand mutation rate m, fully specifies the evolutionary rate at the site, under the assumption that sites evolve independently. The link between amino acid distribution and evolutionary rate is established by Sella–Hirsh theory (Sellaand Hirsh
2005). This theory demonstrates that equilibrium fre-quencies of alleles follow a Boltzmann distribution just like the one found by Portoet al.(2004). Thus, from
the equilibrium frequencies of alleles we can infer the relativefitness of alleles and theirfixation probabilities in various backgrounds.
According to Portoet al.(2004), the distribution of
amino acids is given by
Figure 2.—Evolutionary rates K vs. RSA in a two-allele
FðaÞ5Pexp½2bhðaÞ bexp½2bhðbÞ
; (6)
whereais a specific amino acid as before and the sum in the denominator runs over all 20 amino acids. Fixa-tion probabilities follow as
pa/b5
12½FðaÞ=FðbÞ1=ðNe21Þ
12½FðaÞ=FðbÞNe=ðNe21Þ (7)
(Sellaand Hirsh2005). (Thesefixation probabilities
are equivalent to the Kimura probabilities used in the previous subsection; see Sella and Hirsh 2005 for
details.) We can now express evolutionary rate in terms of amino acid distribution andfixation probabil-ities as
K5mNe
X
a
h
FðaÞX
b6¼a
pa/b
i
: (8)
Remember thatK is a function of b, andb is an ap-proximate measure of solvent accessibility. Highly buried sites will have a large negative b, highly ex-posed sites will have a large positive b, and interme-diate sites will have a b close to zero. Thus, to be consistent with data (e.g., Figure 1), Equation 8 should be an increasing function of b. Instead, however, we found that Equation 8 predictsKto be maximal atb¼ 0 (Figure 3A) and to decline in both directions as the absolute value of bincreases. This result makes intu-itive sense, as the distribution defined by Equation 6 is the broadest forb ¼0. However, we have to conclude that the theory of Portoet al.(2004) cannot be used to
explain the linear relationship between evolutionary rate and RSA.
We emphasize that the failure of Equation 8 does not imply that the amino acid distributions calculated by Porto et al. (2004) and given by Equation 6 are
incorrect. In fact, we used Equations 7 and 8 to pre-dict evolutionary rates from the observed amino acid frequencies in yeast and found similarly that the pre-dicted evolutionary rate peaked at intermediate RSA (Figure 3B).
An alternative model based on amino acid frequen-cies:The failure of the previous model implies that the model missed some important aspect of protein evolution. We hypothesized that the model failed because Equation 6 was valid only for the entire class of sites with similarb, but not for any individual site in this class. It is entirely possible that the distribution of amino acids at a specific site, when observed over evo-lutionarily long periods of time, does not agree with Equation 6, even though the average distribution of all sites with similarbor RSA does. Both previously
pub-lished tests of Equation 6 (Portoet al.2004) and our
amino acid distributions as a function of RSA (Figure S1) were obtained by averaging over many sites and thus would not reveal any deviation from Equation 6 at individual sites.
To determine the distribution of amino acids at individual sites, we built large alignments of structurally similar proteins (seemethods). We found that the
dis-tributions at individual sites were highly variable and looked nothing like Equation 6. In general, at any given site, only a small number of different amino acids were actually present, and there was often no obvious rela-tionship between which amino acids were present and what their hydrophobicity was. However, when averag-ing over many sites with similar RSA, we could recover distributions comparable to Equation 6.
Even though the specific amino acids preferred at individual sites were highly variable, we found that the frequency distributions at different sites were similar. When we ordered amino acids by their relative fre-quency at each site, we found that the frequencies were proportional to an exponential, exp(2lk), where k counts amino acids in descending order of frequency, k¼0, 1,. . ., 19. We averaged the reordered amino acid distributions over all sites within bins of similar RSA (Figure 4A) andfitted exp(2lk) to these averaged dis-tributions. We thus obtainedlas a function of RSA and found that l decayed approximately linearly with RSA (Figure 4B andFigure S2).
We carried out this analysis on 162 yeast proteins and found that generally (i)lwas approximately a lin-ear function of RSA and (ii)ldecayed with increasing RSA (Figure 5). For each protein, we fitted a linear function l(r) ¼ c1 1 c2r to the data and generally found a negative slope c2 and a good model fit. The few cases with an apparent positive slope c2 could be traced back to a single outlying l-value at the highest RSA bin (seeFigure S3for an example). This bin gen-erally encompassed the fewest number of sites (see also discussion) and thus its l-value was not always
reliable.
On the basis of these findings, we can model the evolutionary process at individual sites such that it produces steady-state amino acid frequencies
FðaÞ5Pexp½2la bexp½2lb
; (9)
where a and b index amino acids, in the appropriate order, and run from 0 to 19. The parameterldeclines with RSA.
As in the previous subsection, we can use the Sella
and Hirsh (2005) method to map these steady-state
wðaÞ5exp
2l a
2ðNe21Þ
12 la 2Ne:
(10)
It might seem disconcerting that we measure fitness here in units of the effective population sizeNe. After all, thefitness contribution of a particular amino acid in a particular protein of an organism should not depend on the size of the population of that organism. How-ever, this scaling by population size is merely a mathe-matical convenience to keep the actually observable quantities (amino acid distributions, evolutionary rates) free of any explicit dependency onNe. For real organ-isms, we expect thatw(a) is independent ofNebut that l,F(a), and evolutionary rateKall depend onNe.
Fixation probabilities follow from Equation 7. Making the approximationNe21Ne, wefind
pa/b5
12exp½2lða2bÞ=Ne
12exp½2lða2bÞ : (11)
We obtain the average evolutionary rate for this model by substituting Equations 9 and 11 into Equation 8. We find
K5mNe
X
a
" e2la
Z X
b6¼a
12e2lða2bÞ=Ne 12e2lða2bÞ
#
; (12)
whereZ 5 Pbe2lb is the partition function.
Figure3.—Evolutionary rates predicted from amino acid distributions. (A) The amino acid distribution used is the one given by
Porto et al. (2004). The parameter b correlates strongly with RSA. (B) The amino acid distribution used is the observed
distribution in yeast; seeFigure S1.
Figure4.—Variation from primary residue increases with RSA for sequences homologous to thioredoxin peroxidase (PDB
For large Ne, we can approximate e2lða2bÞ=Ne 12lða2bÞ=Ne;so that
K mX
a
e2la
Z X
b6¼a
lða2bÞ 12e2lða2bÞ
: (13)
The absence ofNefrom this equation shows that if we scalew(a) withNe, as in (10), thenKis approximately independent ofNe.
To obtain evolutionary rate as a function of RSA, we substitutel¼c11c2rinto Equation 13. Figure 6 shows resulting evolutionary rates for three representative proteins. The curves K(r) are roughly linear and K is approximately of the correct order of magnitude. How-ever, K(r) is not perfectly linear; there is some clear upward curvature. The curvature tends to increase with the absolute magnitude ofc2. We comment on this issue in the discussion. Also, note that the units for K are
not the same in Figure 1 as they are in the otherfigures. In Figure 1, Kis estimated as the number of substitu-tions per site per unit time. The time unit is the total divergence time between the species that are being compared. By contrast, our mathematical models pre-dictKin units of substitutions per site per generation. We estimate that1011generations separateS. cerevisiae andS. bayanus, 40 million yr·4000 generations/yr.
DISCUSSION
We have shown that the linear relationship between evolutionary rate and RSA reflects a selection pressure on the amino acid level. Further, we have demonstrated
that a simple two-allele model and a more elaborate model based on observed mean amino acid frequencies for sites with similar RSA cannot reproduce this linear relationship. The first model fails because it is too simplistic; individual sites in proteins can, at least in principle, assume 1 of 20 different states. The second model fails because amino acid frequencies averaged over many sites are not representative of amino acid frequencies at individual sites. We have found that the latter frequencies follow a Boltzmann distribution that becomes increasingly broad as RSA increases. Finally, we have shown that a mathematical model based on this observation can reproduce the linear relationship be-tween evolutionary rate and relative solvent accessibility. Our analysis highlights how important it is to distin-guish between amino acid frequencies averaged over a large class of sites with similar property (such as RSA) and amino acid frequencies at individual sites. In both cases, frequencies are Boltzmann distributed, and thus it is easy to mistake one for the other. However, the properties of these two distributions are very different. For example, in yeast, at sites with RSA close to 0.2 nearly all amino acids occur at comparable frequencies. Yet at any given site, only a small number of amino acids are actually permissible. Evolutionary rate, which meas-ures the rate at which mutations at individual sites arise and go to fixation, is governed by the amino acid distribution of individual sites, not the average distribu-tion over a broad class of sites.
However, averaging distributions of similarly exposed sites from many proteins seems to agree qualitatively with distributions predicted by Portoet al.(2004). This
agreement suggests that any future theory attempting to predict site-specific distributions should also be able to predict average distributions of sites with similar b(or RSA). These average distributions should reduce
Figure 5.—Intercept c1 and slope c2 of l as a function
of RSA r, l(r) ¼c11 c2r, when fitted to 162 yeast proteins. The highlighted proteins are used as examples in Figures 4 and 6 andFigure S2andFigure S3.
Figure6.—Evolutionary rates predicted from Equation 13
to something similar to the theory of Portoet al.(2004)
and the data shown inFigure S1.
Our model describes the variation in steady-state distribution at sites using the exponential parameterl, which we defined above as a linear function of RSA: l(r) ¼c1 1 c2r. In this wayl(r) describes the level of variation in the distribution function (Equation 9) for a given RSA. The intercept ofl(r), the largest value it takes, corresponds to the strongest selective pressure and the minimal level of variation for the most buried sites, atr¼ 0. This maximal selective pressure in turn determines the value of the minimal evolutionary rate. Likewise, the slope of l(r) determines the rate of in-crease ofK(r): a steeper slope (more negativec2) signi-fies a greater tolerance of alternative residues as r increases compared to a shallower slope (less negative c2), and greater tolerance of alternative residues implies a greater increase inKasrgrows.
We emphasize that different RSA bins contain diffe-rent numbers of sites (see also Figure 2 from Franzosa
and Xia 2009). Bins below RSA values of 0.1 tend to
contain more than twice as many sites as bins for RSA values between 0.1 and 0.6. Bins for higher RSA values are even less occupied. In our data set of all yeast genes, we have 69,521 sites in the lowest-RSA bin but only 1452 sites in the highest-RSA bin. Because of the comparative scarcity of high-RSA sites, our estimates for amino acid distributions at these sites are not always reliable, as exemplified inFigure S3. In our experience, the amino acid distributions at high RSA are reliable when a linear model produces a negative slope forl(r) and they are unreliable otherwise.
In our analysis of amino acid distributions at indi-vidual sites in indiindi-vidual proteins, we generally observed only a few (on the order of 5) different amino acids at each site. This outcome was expected for Boltzmann-distributed amino acid frequencies. For the proteins we investigated, we found that l typically fell somewhere between 0.3 and 1.2. Even for the smallest l in this range, l ¼ 0.3, the expected frequency of the 10th most abundant amino acid under a Boltzmann distri-bution is only0.02, and the expected frequency of the 20th most abundant amino acid is 0.001. For largerl, the expected frequencies are much smaller. In our alignments, which mostly ranged from 50 sequences to200 sequences, with a few cases going up to 360 sequences, we could not properly sample amino acids that have such low expected abundances. In fact, in our distributions, the least abundant amino acid generally has absolute frequencies in low single digits, and thus we cannot expect to see any other amino acids that should, according to theory and the overall pattern we see, arise at less than single-digit frequencies.
By measuring fitness in units of Nefor ease of anal-ysis, we have implicitly made lðrÞ5NeˆlðrÞ; where
l
ˆðrÞ5cˆ11cˆ2r: What we have then is a relation linking
the original l(r) to Ne and the parameters cˆ1 and cˆ2.
Note that the original l(r) is a statistically measurable function describing variation at sites by RSA. If we could obtain estimates of cˆ1 and cˆ2 independently of K, say
from an ab initio model of protein folding, and then the relationships were formally attached to biophysical quantities that proved reliably measurable, this relation-ship lðrÞ5NeˆlðrÞ could provide a novel method by
which to estimate effective population size.
While our final model produces an approximately linear relationship between evolutionary rate and RSA, the model predictions are not perfectly linear. In particular for proteins with larger absolute c2 values, we see a clear upward curvature in evolutionary rate as a function of RSA (Figure 6). In our modeling ap-proach, we made several approximating assumptions, and each of them could potentially be the source of the curvature. First, we assumed that amino acid distri-butions are Boltzmann distributed. This assumption may not be entirely correct. In fact, if amino acid dis-tributions were perfectly Boltzmann distributed, then the data in Figure 4A should be perfectly linear. In-stead, they seem to display a moderate amount of cur-vature. Second,lmay not be a linear function of RSA. We did see a fair amount of noise inlfor some proteins (e.g., Figure S2D), but we did not see any systematic deviation from the linear trend. Third, when modeling how amino acid distributions relate to evolutionary rate, we completely neglected any interactions among sites. While models without interactions have been successful in related studies,e.g., in predicting the effect of multi-ple mutations on protein stability (Bloom et al. 2005)
and in linking mutation frequencies to stability effects (DDGvalues) (Godoy-Ruizet al.2004; Zeldovichet al.
2007; Bloom and Glassman 2009), epistatic
interac-tions among sites in proteins are well documented and may be important for precise prediction of evolu-tionary rates.
We thank Markus Porto and Eugene Shakhnovich for helpful comments on this work. This work was supported by National Institutes of Health grant R01 GM088344 and by the National Science Foundation under Cooperative Agreement DBI-0939454.
LITERATURE CITED
Akashi, H., 1994 Synonymous codon usage inDrosophila melanogaster: natural selection and translational accuracy. Genetics 136:
927–935.
Bastolla, U., M. Porto, H. E. Roman and M. Vendruscolo, 2005 Principal eigenvector of contact matrices and hydropho-bicity profiles in proteins. Proteins58:22–30.
Bastolla, U., A. R. Ortíz, M. Porto and F. Teichert, 2008 Effective connectivity profile: a structural representation that evidences the relationship between protein structures and sequences. Proteins73:872–888.
Bloom, J., D. A. Drummond, F. H. Arnold and C. O. Wilke, 2006 Structural determinants of the rate of protein evolution in yeast. Mol. Biol. Evol.23:1751–1761.
Bloom, J. D., J. J.Silberg, C. O.Wilke, D. A.Drummond, C.Adami
et al., 2005 Thermodynamic prediction of protein neutrality. Proc. Natl. Acad. Sci. USA102:606–611.
Bowie, J. U., J. F.Reidhaar-Olson, W. A.Lim and R. T.Sauer, 1990 Deciphering the message in protein sequences: tolerance to amino acid substitutions. Science247:1306–1310.
Bustamante, C. D., J. P.Townsendand D. L.Hartl, 2000 Solvent accessibility and purifying selection within proteins of Escherichia coli and Salmonella enterica. Mol. Biol. Evol.17:301–308. Campbell-Valois, F. X., K. Tarassov and S. W. Michnick,
2005 Massive sequence perturbation of a small protein. Proc. Natl. Acad. Sci. USA102:14988–14993.
Chothia, C., and A. V.Finkelstein, 1990 The classification and origins of protein folding patterns. Annu. Rev. Biochem. 59:
1007–1039.
Chothia, C., and A. M.Lesk, 1986 The relation between the di-vergence of sequence and structure in proteins. EMBO J. 5:
823–826.
Conant, G. C., and P. F.Stadler, 2009 Solvent exposure imparts similar selective pressures across a range of yeast proteins. Mol. Biol. Evol.26:1155–1161.
Creighton, T. E., 1992 Proteins: Structures and Molecular Properties. W. H. Freeman, New York
Dokholyan, N. V., and E.Shakhnovich, 2001 Understanding hi-erarchical protein evolution fromfirst principles. J. Mol. Biol.
312:289–307.
Dokholyan, N. V., L. A.Mirnyand E.Shakhnovich, 2002 Under-standing conserved amino acids in proteins. Physica A 314:
600–606.
Drummond, D. A., and C. O.Wilke, 2008 Mistranslation-induced protein misfolding as a dominant constraint on coding-sequence evolution. Cell134:341–352.
Edgar, R., 2004 Muscle: multiple sequence alignment with high accuracy and high throughput. Nucleic Acids Res.32:1792–1797. Fauchere, J. L., and V.Pliska, 1983 Hydrophobic parameters pi of amino acid side chains from the partitioning of N-acetyl-amino-acid amides. Eur. J. Med. Chem.18:369–375.
Ferrada, E., and A.Wagner, 2008 Protein robustness promotes evolutionary innovations on large evolutionary time-scales. Proc. R. Soc. B275:1595–1602.
Franzosa, E., and Y.Xia, 2008 Structural perspectives on protein evolution. Ann. Rep. Comp. Chem.4:3–21.
Franzosa, E. A., and Y.Xia, 2009 Structural determinants of protein evolution are context-sensitive at the residue level. Mol. Biol. Evol.26:2387–2395.
Godoy-Ruiz, R., R. Perez-Jimenez, B. Ibarra-Molero and J. M. Sanchez-Ruiz, 2004 Relation between protein stability, evolu-tion and structure, as probed by carboxylic acid mutaevolu-tions. J. Mol. Biol.336:313–318.
Goldman, N., J. L. Thorneand D. T. Jones, 1998 Assessing the impact of secondary structure and solvent accessibility on protein evolution. Genetics149:445–458.
Guo, H., J.Choeand L.Loeb, 2004 Protein tolerance to random amino acid change. Proc. Natl. Acad. Sci. USA101:9205–9210. Hamelryck, T., and B.Manderick, 2003 PDB parser and structure
class implemented in python. Bioinformatics19:2308–2310. Holm, L., C. Ouzounis, C.Sander, G. Tuparevand G. Vriend,
1992 A database of protein structure families with common folding motifs. Protein Sci.1:1691–1698.
Kabsch, W., and C.Sander, 1983 Dictionary of protein secondary structure: pattern recognition of hydrogen-bonded and geomet-rical features. Biopolymers22:2577–2637.
Kimura, M., 1962 On the probability offixation of mutant genes in a population. Genetics47:713–719.
Lancaster, A. K., J. P.Bardill, H. L.Trueand J.Masel, 2010 The spontaneous appearance rate of the yeast prion [psi1] and its
implications for the evolution of the evolvability properties of the [psi1] system. Genetics184:393–400.
Lau, K., and K.Dill, 1990 Theory for protein mutability and bio-genesis. Proc. Nati. Acad. Sci. USA87:638–642.
Lee, Y., T. Zhou, G. G. Tartaglia, M. Vendruscolo and C. O. Wilke, 2010 Translationally optimal codons associate with aggregation-prone sites in proteins. Proteomics10:4163–4171. Lobkovsky, A., Y.Wolfand E.Koonin, 2009 Universal distribution
of protein evolution rates as a consequence of protein folding physics. Proc. Natl. Acad. Sci. USA107:2983–2988.
Lynch, M., W. Sung, K. Morris, N. Coffey and C. R. Landry, 2008 A genome-wide view of the spectrum of spontaneous mu-tations in yeast. Proc. Natl. Acad. Sci. USA105:9272–9277. Mirny, L. A., and E. I.Shakhnovich, 1999 Universally conserved
positions in protein folds: reading evolutionary signals about sta-bility, folding kinetics and function. J. Mol. Biol.291:177–196. Overington, J., D. Donnelly, M. S. Johnson, A.Saliand T. L.
Blundell, 1992 Environment-specific amino acid substitution tables: tertiary templates and prediction of protein folds. Protein Sci.1:216–226.
Pokarowski, P., A. Kloczkowski, R. Jernigan, N. Kothari, M. Podarowskiet al., 2005 Inferring ideal amino acid interaction forms from statistical protein contact potentials. Proteins 59:
49–57.
Porto, M., H. E. Roman, M. Vendruscolo and U. Bastolla, 2004 Prediction of site-specific amino acid distributions and limits of divergent evolutionary changes in protein sequences. Mol. Biol. Evol.22:630–638.
Reidhaar-Olson, J. F., and R. T.Sauer, 1988 Combinatorial cas-sette mutagenesis as a probe of the informational content of pro-tein sequences. Science241:53–57.
Schmidt am Busch, M., S.Sedanoand T.Simonson, 2010 Com-putational protein design: validation and possible relevance as a tool for homology searching and fold recognition. PLoS One
5:e10410.
Sella, G., and A.Hirsh, 2005 The application of statistical physics to evolutionary biology. Proc. Natl. Acad. Sci. USA 102:9541–
9546.
Shakhnovich, B. E., E. Deeds, C. Delisi and E. Shakhnovich, 2005 Protein structure and evolutionary history determine se-quence space topology. Genome Res.15:385–392.
Smith, B., and R.Raines, 2006 Genetic selection for critical residues in ribonucleases. J. Mol. Biol.362:459–478.
Whelan, S., and N.Goldman, 2001 A general empirical model of protein evolution derived from multiple protein families using a maximum-likelihood approach. Mol. Biol. Evol.18:691–699.
Wilke, C. O., and D. A. Drummond, 2010 Signatures of protein biophysics in coding sequence evolution. Cur. Opin. Struct. Biol.
20:385–389.
Wolff, K., M.Vendruscoloand M.Porto, 2008 Stochastic recon-struction of protein structures from effective connectivity profiles. PMC Biophys.1:5.
Yang, Z., 2007 PAML 4: phylogenetic analysis by maximum likeli-hood. Mol. Biol. Evol.24:1586–1591.
Zeldovich, K. B., P.Chenand E. I.Shakhnovich, 2007 Protein stability imposes limits on organism complexity and speed of molecular evolution. Proc. Natl. Acad. Sci. USA 104: 16152–
16157.
Zhou, T., D. A.Drummondand C. O.Wilke, 2008 Contact density affects protein evolutionary rate from bacteria to animals. J. Mol. Evol.66:395–404.
Zhou, T., M.Weemsand C. O.Wilke, 2009 Translationally optimal codons associate with structurally sensitive sites in proteins. Mol. Biol. Evol.26:1571–1580.
APPENDIX
In the main body of this article, we have shown that in the two-allele model the evolutionary rate declines exponentially insfors.1/Ne. We may ask whether it is possible fors(r) to maprto a sufficiently small range [s1,s2] [0, 1] so thatK(r) is approximately linear over that range. To this end, takes1,s2with 1/Ne, s1, s2.
We judge linearity in the range [s1,x] by the magnitude of the function
DðxÞ5LðxÞ2KðxÞ; (A1)
whereL(x)¼K9(s1)(x2s1)1K(s1) is the line tangent toKats1. We examine the behavior ofD(s2) for afixed distance
e¼s22s1. SubstitutingKðsÞ 4smNee22Nes;K9ðsÞ 4mNeð122NesÞe22Nes;ands2¼s11e, wefind for Equation A1,
Dðs2Þ5K9ðs1Þe1Kðs1Þ2Kðs2Þ (A2)
4mNee22Nes1
s1
112Nee2e22Nee
2e11e22Nee: (A3)
This function decreases with botheands1. Settings2¼s11 1/Negives us
Dðs2Þ54mNee22Nes1
s1
32e22 1 1
Neð11e22Þ
(A4)
.4mNes1e22Nes15Kðs1Þ: (A5)
GENETICS
Supporting Information
http://www.genetics.org/cgi/content/full/genetics.111.128025/DC1
The Relationship Between Relative Solvent Accessibility and Evolutionary
Rate in Protein Evolution
Duncan C. Ramsey, Michael P. Scherrer, Tong Zhou and Claus O. Wilke
D. C. Ramsey et al. 2 SI
FILE S1
Supporting Data
File S1 is available for download as a compressed folder at http://www.genetics.org/cgi/content/full/genetics.111.128025/DC1.
D. C. Ramsey et al. 3 SI
FIGURE S1.—Relative frequencies of amino acids across 525 yeast proteins, binned by RSA and ordered by decreasing
hydrophobicity. Cysteine and methionine are omitted. Due to their specialized function, their average frequencies across all bins were 1.5% and 0.6%, respectively.
Amino Acid
0
5
10
15
RSA
0.0
0.2
0.4
0.6
0.8
Relativ
e Freqency
D. C. Ramsey et al. 4 SI
FIGURE S2.—The exponential parameter as a function of RSA, for four different protein structures.
RSA
A
0.0 0.2 0.4 0.6 0.8 1.0
0.2
0
.5
0.8
1
.1
1JG8A
=0.9, P<0.001
RSA
B
0.0 0.2 0.4 0.6 0.8 1.0
0.2
0
.5
0.8
1
.1
1W85B =0.8, P<0.01
RSA
C
0.0 0.2 0.4 0.6 0.8 1.0
0.2
0
.55
0
.9
1.25
1.6 1QMVA
=0.9, P<0.001
RSA
D
0.0 0.2 0.4 0.6 0.8 1.0
0.2
0
.55
0
.9
1.25
1.6 2C78A
D. C. Ramsey et al. 5 SI
FIGURE S3.—The protein manganese superoxide dismutase (PDF identifier 1GV3, chain A) shows a clear linear decrease of with RSA, except for the highest RSA bin. Even though a non-parametric correlation analysis shows a strong negative
correlation, a linear model (dashed line) infers a positive slope because of the one outlying data point.
RSA
0.0 0.1 0.2 0.3 0.4 0.5 0.6 0.7 0.8 0.9 1.0
01234
1GV3A
D. C. Ramsey et al. 6 SI
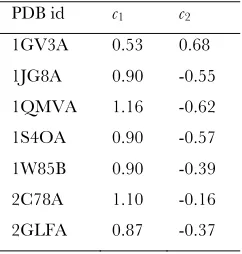
TABLE S1
Fitted constants c1 and c2 for protein structures highlighted in Figure 5.
PDB id c1 c2
1GV3A 0.53 0.68
1JG8A 0.90 -0.55
1QMVA 1.16 -0.62
1S4OA 0.90 -0.57
1W85B 0.90 -0.39
2C78A 1.10 -0.16