DSC Analyses of Rubber Granules used in
Artificial Turf Systems
Kreshnik Hakrama
1, Genti Guxho
2General Directory of Metrology, Kashar, Albania1
Faculty of Mechanical Engineering, Dr. Professor, Dept. of Textile and Fashion, Polytechnic University of Tirana,
Albania
ABSTRACT: The recycled rubber materials presented as granules are rapidly used as infill material for different type of fields. One of the most important issues, especially in Albania is proving that these materials are recycled. In this paper it is presented the DSC methods analyses. That will provide info regarding the combining material in rubber granules
KEYWORDS: Recycled rubber, Differential Scanning Calorimetry (DSC), Synthetic a artificial grass, heating and cooling
I. INDTODUCTION
The granulated rubbers used as infill material for artificial turf are recycled mostly from the tires of cars and trucks [1]. These tires are supposed to be abrasion resistance, aging resistance, temperature resistance, resistance to oxygen and chemicals therefore are added fillers like carbon black during vulcanization with sulfur [2].
As such it is very important to know what kind of additives they have. Rubber can be produced both naturally, through the latex found in certain plants; and synthetically, through a process that uses unsaturated hydrocarbons. In addition, rubber is a polymeric material widely used in the automotive industry [3]. Flexibility and stability are the most characteristic features of this material. Chemical construction and physical state of rubber depends on carbon bond which can be coiled or complex.
Rubber can be recycled using one of three basic methods: by reusing (retreading old tires produces functional refurbished tires). By burning; tires produces energy used for different purposes [6].
By chopping down and forming an entirely new product, such as playground surfacing or using them directly as infill material especially in artificial turf. This group of recycled rubbers will be the focus of our study [4].
The high elasticity of rubber depends on the ability of these connections to organize and pull. Due to the extreme prevalence of rubber products the tires are discarded and rubber recycling has become more common [5].
II.RELATEDWORK
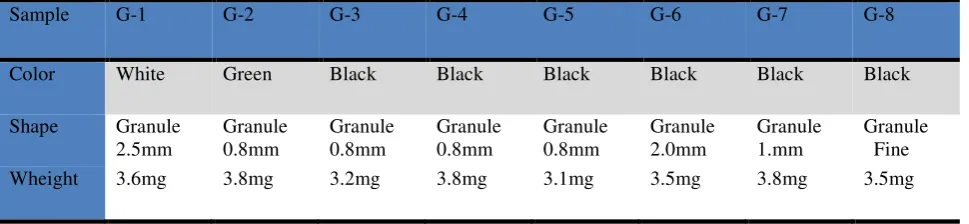
The present investigation involved eight granulated rubbers from different football fields being used as fillers in artificial grass football fields, received by Albanian and foreign market. Information about color, shape and size of the samples are reposted in Table 1.
Table 1 Studying rubber sample
Sample G-1 G-2 G-3 G-4 G-5 G-6 G-7 G-8
Color White Green Black Black Black Black Black Black
Shape Granule 2.5mm Granule 0.8mm Granule 0.8mm Granule 0.8mm Granule 0.8mm Granule 2.0mm Granule 1.mm Granule Fine Wheight 3.6mg 3.8mg 3.2mg 3.8mg 3.1mg 3.5mg 3.8mg 3.5mg
III.DSCANALYSIS
In order to determine the thermal properties, are used Differential Scanning Calorimetry (DSC). The chosen temperature range for testing the rubber is from -80 0C to +200 0C with cool\heat step of of 10 C/min. The equipment used is DSC 200 F3Maia (costumer laboratory) rate of 10 C/min in a nitrogen environment.
The sample mass is between 3.5 and 4.5 mg, which is low enough to avoid problems caused by heat and material transfer. Samples are heated from 40 to 200ºC at a heating rate of 10 K/min–1 using azoth as purging gas at a flow rate of 40 ml/min. The experiments are carried out in air atmosphere. Two pans are heated in the measurement chamber. The sample pan contains the material being investigated. A second pan, which is typically empty, is used as a reference. The computer is used to monitor the temperature and regulate the rate at which the temperature of the pans changes. The same temperature interval was covered during cooling at the same rate. The melted crystallization enthalpy values were calculated using the software.
DSC measures the heat flow into or from a sample as it is heated, cooled and/or held isothermally. The technique provides valuable information on softening temperatures (or Tg), melting temperatures, heats of melting, percent crystallinities, and re-crystallization (temperatures and heats) [8, 10, 11].
IV.EXPERIMENTALRESULTS
The DSC results generated from the test are displayed in the following figures (see figure 1 to 8). Plots, for all the samples show almost the same shape.
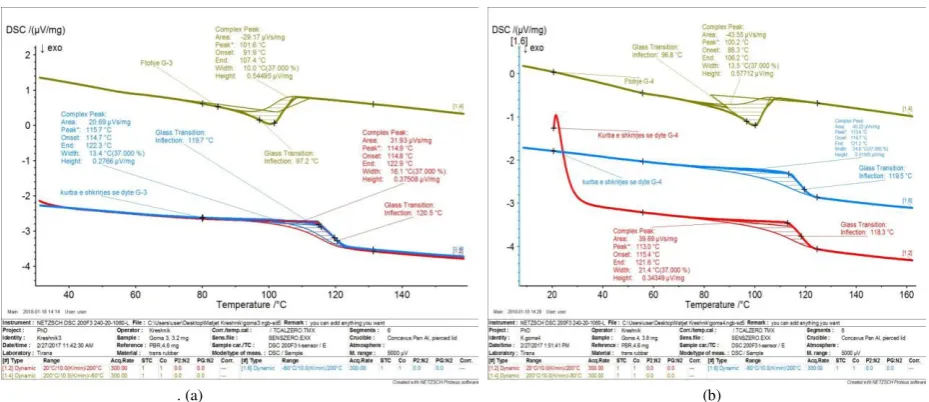
. (a) (b)
Fig 1: DSC curves of first, second heating and cooling down, for sample G-1. (a), DSC curves of first, second heating and cooling down, for sample G-2
As can be seen from the figure 1 and 2, (for sample G-1 and G-2), the graph show a slight difference in the shape of the curves ,between first and second heating, respectively for sample G-1 and G-2. Thus by influencing also on the heat capacity, but not influencing the melting temperatures, which show almost the same value.
. (a) (b)
Fig 2: DSC curves of first, second heating and cooling down, for sample G-3. (a), DSC curves of first, second heating and cooling down, for sample G-4
. (a) (b)
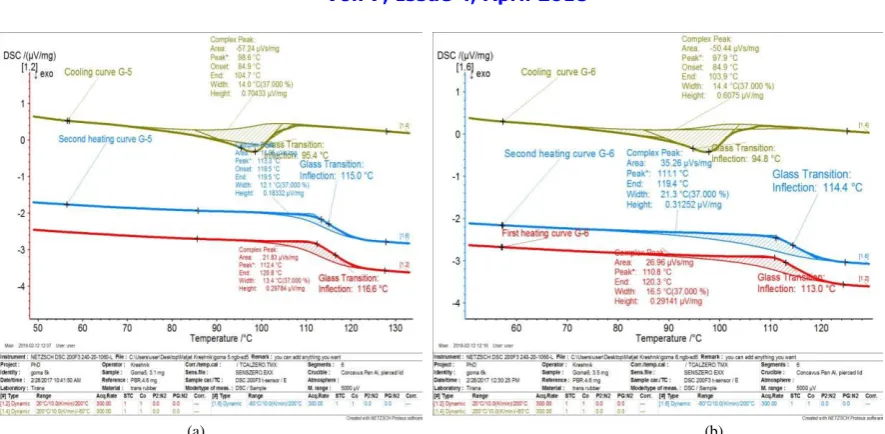
Fig 3: DSC curves of first, second heating and cooling down, for sample G-5. (a), DSC curves of first, second heating and cooling down, for sample G-6
After the first heating samples were cooled back to -40 °C and then reheated for the second melting. During the reheat, from the plots is possible to find melting temperature and heat capacity (see table 2).
The different types of recycled rubber will have different properties regarding the specific heat capacity and melting temperatures and this reflects the differences due to thermal history. The specific heat of data could be used for studying and predicting the polymerization [7, 8, 9].
. (a) (b)
Fig 4: DSC curves of first, second heating and cooling down, for sample G-7. (a), DSC curves of first, second heating and cooling down, for sample G-8
The melting characteristics of the tested rubbers, for the first and the second heat, show different values, as expected. However, for sample G-4 the heat capacity is almost at the same value (see tab 2 and fig 5).
Interesting is the fact that same samples show higher values of second melting heat, this could be interpreted as a result of re-crystallization of the product.
Table 2. DSC characteristics of the tested samples.
Rubbe r
First heating Second heating Cooling
Area(µVs/m g) Tpeak(° C) Tg(°C ) Area(µVs/m g) Tpeak(° C) Tg(°C ) Area(µVs/m g) Tpeak(° C) Tg(°C ) G-1 39.07 118.4 122.5 20.22 119.7 121.6 -40.67 105.8 100.8 G-2 19.47 117.3 121.8 11.2 118.4 120.8 -40.8 103.9 89.8 G-3 31.9 114.9 120.5 20.69 115.7 120.5 -29.17 101.6 97.2
G-4 39.69 130 118.3 40.2 113.4 119.5 -43.5 100.2 96.8 G-5 21.83 112.4 116.6 11.95 113.3 115 -57.24 98.6 95.4 G-6 26.96 110.8 113 35.26 111.1 114 -50.44 97.9 94.8
G-7 43.55 109.9 113.8 45 110 114.7 -45.32 97 93.6
G-8 38.36 112.7 118.7 40.4 112.5 115.9 -51.3 99.3 96.1
From the segment analyses, of the first heating, it is possible to find glass transition, melting temperature and to calculate the total heat flow of melting. For a better view the results are summarized in table 2.
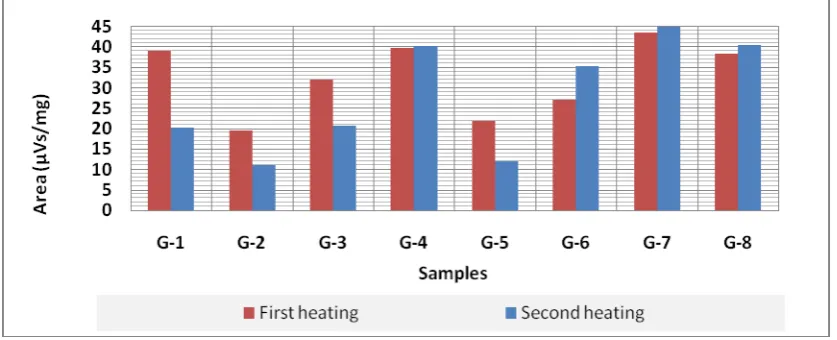
Fig 5. Graphically presented the comparison of the heat capacity of all the tested samples, in first and second heating.
From the spectrum it is noted that the second heating values are higher than the first heat value. this may be related to the restructuring / recrystallization of tire components.
V.CONCLUSION
REFERENCES
[1]Luz Claudio March 2008 Environmental Health Perspectives • VOLUME 116 | NUMBER 3.
[2]Alessandria L, Scozia D, Bono R, Gilli G. 2013. Artificial turf football fields: environmental and mutagenicity assessment. Arch Environ Contam Toxicol, 64:1–11.
[3]Niyogi UK. 2007. Introduction to fiber science and rubber technology b. Rubber technology natural and synthetic rubber. [4]David R,cBrow Sc.D 2007 Artificial Turf Environment & Human Health, Inc(downloaded from the internet date:10.03.2016). [5]Adamiak M. 2012. Abrasion resistance of materials. 150. ISBN 978-953-51-0300-4.
[6]Turer A. 2012. Recycling of scrap tires. Material recycling – trends and perspectives, 8: 196. Edited by Dimitris S. Achilias. ISBN 978-953-51-0327-1.
[7]Changwoon Nah, Je Hwan Park, Choon Taxk Cho, Young-Wook Chang Specific Heats of Rubber Compounds Journal of Applied Polymer Science Vol. 72, 1513-1522 (1999).
[8]Joseph D. Menczel, R. Bruce Prime; Thermal Analysis of Polymers: Fundamentals and Applications, Copyright © 2009 John Wiley & Sons, Inc ISBN: 9780471769170.
[9]Phywe System GMBH & CO. Kg Laboratory experiments. D-37070 Gottingen, Heat insulation / Heat conduction,(2008), LEP 3.6.03-00 . [10]Valerio Causin (2015), Polymers on the Crime Scene Forensic Analysis of Polymeric Trace Evidence ISBN 978-3-319-15494-7 (page 3001 – 320).