ISSN(Online): 2319-8753 ISSN (Print) : 2347-6710
I
nternational
J
ournal of
I
nnovative
R
esearch in
S
cience,
E
ngineering and
T
echnology
(A High Impact Factor, Monthly, Peer Reviewed Journal)
Visit: www.ijirset.com
Vol. 8, Issue 3, March 2019
Implement A Monte Carlo Simulation For
Traffic Load Effect Based On Weigh In
Motion Recordings
R.R.Nidhisha1 , Prof.C.Gayathri2
PG Student, Department of Civil Engineering, Arunachala College of Engineering for Women, Nagercoil,
Tamilnadu, India1
Professor, Department of Civil Engineering, Arunachala College of Engineering for Women, Nagercoil,
Tamilnadu, India2
ABSTRACT: In developing country like India, transportation play a vital role in its development since there is a need to analyse traffic volume and develop alternative to minimize its intensity. In this project, traffic flow in Nagercoil city is analysed and suggestion of fly over throughout the respective town and connecting that with the proposed four lane network. Thus, this project will be helpful in making decisions for the improvement of road transport in achieving its standard equal to a metropolitan city. Monte Carlo simulation is a technique used to simulate the random sampling to obtain numerical results considering the future flaws using MATLAB software. When the traffic size increases to infinity this method helps in improving the distribution of traffic so that the statistical interaction between the vehicles vanishes.
This project enables the use of various prediction techniques including the fluctuations and helps in making decision to the improvement of highways considering various constraints in its applicability. This also ensures the use of proposed four lane network with the new alternative for its effectiveness. Use of sensors or video cameras minimizes the human errors in data collection by manual method. This act as an advancement of similar research done in Bangladesh and also as an evidence for the need for construction of Flyover Bridge in considering the welfare of future generation. It also helps in reducing the delay of many construction projects due to late delivery of resources. Through the effectiveness of this project future delay of about four times more than the current delay can be reduced to some extent.
I. INTRODUCTION
1.1 GENERAL
ISSN(Online): 2319-8753 ISSN (Print) : 2347-6710
I
nternational
J
ournal of
I
nnovative
R
esearch in
S
cience,
E
ngineering and
T
echnology
(A High Impact Factor, Monthly, Peer Reviewed Journal)
Visit: www.ijirset.com
Vol. 8, Issue 3, March 2019
operation phase of the extended network of road. This paperaddresses the sustainable development of highway facility with the increase of demand and to benefit the users throughout its service life of the highway.
1.2 SCOPE OF THE PROJECT
The study is related to National Highway Department since it involves NH 47, NH 44, and NH7. This study helps in identifying the possibilities to remove future traffic volume.
It removes the delay in construction project due to late delivery of resources.
II. REVIEW OF LITERATURE
In accordance with the topic there are limited studies and the related literatures were studied to gain information useful for the development of this topic. Some of those relevant literatures are as follows;
2.1Traffic volume study Bangladesh.
This work emphasis on traffic volume and the analysis was carried out through primary traffic flow surveys at AUST-Flyover junction to Shatrasta Junction in Dhaka city.The current work studies traffic characteristics in the city of Dhaka at one selected priority junction. Traffic flow is studied by manual methods. Also the present status of traffic flow at the junction, traffic survey is conductedThe results from the present study are helpful in controlling the traffic at the intersection and also in suggesting some of the remedial measures such as changing 4-lane to 6-lane or by providing more public transport can be recommended based on the outcomes of the work.
2.2 Estimating Annual Average Daily Traffic Using Daily Adjustment Factor
This study dealt with estimating AADT which serves the important basic data in transportation sector. AADT estimation is fundamental to the analysis of transportation data sets and the management of transportation systems.This model uses monthly or weekly adjustment factors to estimate AADT. So this study used daily factor to estimate AADT and compared with advanced research. Daily factor is produced 365 factors on one permanent traffic count. It predicts the future service level of the road based on the planned traffic volume and determines the geometry of new roads.
2.3 Real Traffic data based Evaluation of Vehicular Traffic Environment and State-of-the-art with Future Issues in Location Centric Data Dissemination for VANETs
This study has been carried out with three main objectives: (i) to analyze the impact of dynamic traffic environment on the design of data dissemination techniques. (ii) To characterize location centric data dissemination in terms of functional and qualitative behavior of protocols, properties, and strengths and weaknesses, and (iii) to find some future research directions in information dissemination based on location..
2.4 Traffic Data Collection and Analysis
This paper facilitate the assessment of present and future traffic demands, for the development of need-based infrastructure accurate information and continuous monitoring of traffic by appropriate method. planning, design, construction and maintenance of roads in Botswana that take full account of local conditions.
2.5Traffic Forecasting Model for a Road Section
In this paper traffic forecasting model for a road section based on a computer model of the transportation system of a traffic gravity section has been analyzed. This approach allows the structure of the road network.
III. DATA COLLECTION
Based on the sequence of steps the project is carried out; i. Selection of junction to collect traffic data to be used
ISSN(Online): 2319-8753 ISSN (Print) : 2347-6710
I
nternational
J
ournal of
I
nnovative
R
esearch in
S
cience,
E
ngineering and
T
echnology
(A High Impact Factor, Monthly, Peer Reviewed Journal)
Visit: www.ijirset.com
Vol. 8, Issue 3, March 2019
iii. From the obtained data, distribution of future data prediction is done considering the flaws and fluctuations by implementing Monte Carlo simulation
iv. Analyzing the current system of network for the calculated future traffic volume and the delays. v. According to the results obtained suitable solution for the prototype is formulated.
vi. Suggestions were given for the improvement of existing national highways based on the result
vii. Conclude the result and discuss its advantages and applicability in real time practices considering the delay.
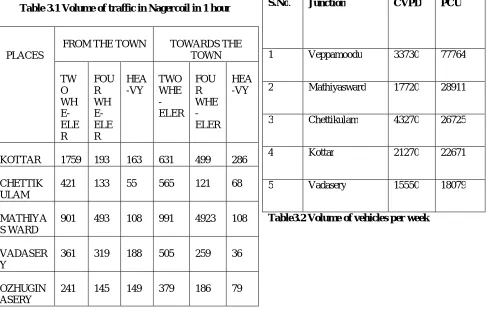
S.No. Junction CVPD PCU
1 Veppamoodu 33730 77764
2 Mathiyasward 17720 28911
3 Chettikulam 43270 26725
4 Kottar 21270 22671
5 Vadasery 15550 18079
Table3.2 Volume of vehicles per week
3.1Delay Time Calculation
Delay in travel time defined as time difference between actual time travelled and the free time during travel. It is the additional time travelled by a driver or a passenger during their travel.
Dz = L [(1/Vz) – (1/Vf)] where
Dz = Delay
L = Length of traffic congested area Vz = Speed in the traffic congested area Vf = Freeway speed
Site 1: L = 0.7, Vz = 1, Vf = 40, Therefore, Dz = 40.95 Site 2: L = 0.6, Vz = 1, Vf = 35, Therefore, Dz = 34.971 Site 3: L = 0.5, Vz = 1, Vf = 45, Therefore, Dz = 29.33 Site 4: L = 0.3, Vz = 1, Vf = 30, Therefore, Dz = 17.4 Site 5: L = 0.4, Vz = 1, Vf = 35, Therefore, Dz = 23.314
Average delay time = (40.95 + 34.971 + 29.33 + 17.4 + 23.314)/5 = 29.53 minutes PLACES
FROM THE TOWN TOWARDS THE TOWN TW O WH E-ELE R FOU R WH E-ELE R HEA -VY TWO WHE - ELER FOU R WHE - ELER HEA -VY
KOTTAR 1759 193 163 631 499 286
CHETTIK ULAM
421 133 55 565 121 68
MATHIYA S WARD
901 493 108 991 4923 108
VADASER Y
361 319 188 505 259 36
OZHUGIN ASERY
ISSN(Online): 2319-8753 ISSN (Print) : 2347-6710
I
nternational
J
ournal of
I
nnovative
R
esearch in
S
cience,
E
ngineering and
T
echnology
(A High Impact Factor, Monthly, Peer Reviewed Journal)
Visit: www.ijirset.com
Vol. 8, Issue 3, March 2019
IV. FUTURE DATA PREDICTION
ISSN(Online): 2319-8753 ISSN (Print) : 2347-6710
I
nternational
J
ournal of
I
nnovative
R
esearch in
S
cience,
E
ngineering and
T
echnology
(A High Impact Factor, Monthly, Peer Reviewed Journal)
Visit: www.ijirset.com
Vol. 8, Issue 3, March 2019
Average of present traffic volume = 13770
Average number of future traffic volume = 68850
Delay time in material delivery with respect to present traffic volume = 29.53 min
Therefore delay time in material delivery with respect to future traffic volume = (29.53/13770) X 68850
=145.900 minutes
V. ALTERNATIVE SUGGESTION
ISSN(Online): 2319-8753 ISSN (Print) : 2347-6710
I
nternational
J
ournal of
I
nnovative
R
esearch in
S
cience,
E
ngineering and
T
echnology
(A High Impact Factor, Monthly, Peer Reviewed Journal)
Visit: www.ijirset.com
Vol. 8, Issue 3, March 2019
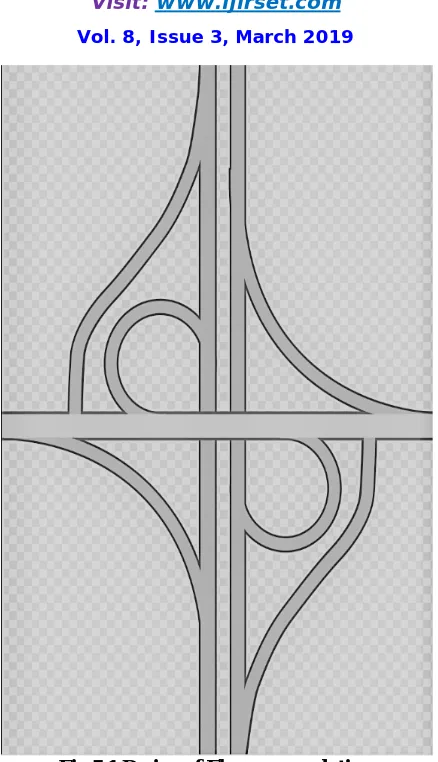
Fig 5.1 Design of Fly over as solution
5.1 Advantages of alternative
This reduces the delay time upto five times the predicted delay.
It also improves the traffic flow and congestion in the upcoming years after its implementation.
VI. CONCLUSION
In this project proper collection of data includes the peak hour and normal hour is distributed for the future.The collection of data includes two wheelers, LCV, Public transports, and Heavy load vehicles. It is collected for continuous weekday and weekends. This calculated data helps in identifying and suggesting a proper alternative to the highway construction. Based on this suitable alternative is also suggested for its application. A new construction increases the efficiencyof the road traffic and reduces delay upto 5 times the existence.To determine if a community is employingappropriate transportation options, monetary costs, comfort, safety, and Environmental impacts should be assessed as future study, an extension of the project.
ACKNOWLEDGEMENT
ISSN(Online): 2319-8753 ISSN (Print) : 2347-6710
I
nternational
J
ournal of
I
nnovative
R
esearch in
S
cience,
E
ngineering and
T
echnology
(A High Impact Factor, Monthly, Peer Reviewed Journal)
Visit: www.ijirset.com
Vol. 8, Issue 3, March 2019
Copyright to IJIRSET DOI:10.15680/IJIRSET.2019.0803165 2740
(Ph.D)., Project GuideProf.C.Gayatrhri M.E.and Publishing Guide Prof. Brightson M.E., (Ph.D)., for their valuable ideas, instantaneous help, effective support for the completion of this project.
REFERENCES
1. AlexandrChubukov 1a and ValeriyKapitanov, (2016), ‘Calculation of Traffic Capacity of Signaled Intersections’, Transportation Research Procedia 20 pp. 125 – 131.
2. AnzhelikaDombalyan B. (2016),‘Traffic Forecasting Model for a Road Section’, Transportation Research Procedia pp. 159 – 165.
3. Attila M. Nagya and VilmosSimona, (2018),’Survey on Traffic Prediction in Smart Cities’, International Journal of Civil Engineering, Vol. 10 pp.10-16.
4. Bernard Enright and Eugene J. O Brien. (2012), Monte Carlo Simulation of extreme traffic loading on short and medium span bridges, ISSN1267-1282, doi:10.1080/15732479.2012.688753, Ireland.
5. CathalLeahya (2016),‘The effect of traffic growth on characteristic bridge load effect’, Transportation Research Procedia of Ireland, pp 3990 – 3999.
6. Jung-Ah Ha and Jun-Sam Oh, (2014)’ Estimating Annual Average Daily Traffic Using Daily Adjustment Factor’, Journal of Emerging Trends in Computing and Information Sciences, Vol.5, pp. 455-480.
7. JunshiXu (2016), ‘Contrasting the direct use of data from traffic radars and video cameras with traffic simulation in the estimation of road emissions and PM hotspot analysis’, Transportation Research Part D vol.9 pp.90-101.
8. 8. TomasSilupas 92006), ‘Annual Average Daily Traffic Forecasting Using.Different Techniques’, Journal of Lithuania pp.1648-3480