Transactions, SMiRT-22
San Francisco, California, USA - August 18-23, 2013 Division IX
Improving the State of the Art in Finite Element Method Analysis of Prestressed Concrete Containment Vessels to Beyond Design Accident Loads through an International Round
Robin Exercise
Lili Akin1, Madhumita Sircar2, Herman Graves3, Robert Dameron4, and Christopher Jones5
1Principal Member of Technical Staff, Sandia National Laboratories, Albuquerque, NM ([email protected]) 2Technical Lead and Program Manager, US Nuclear Regulatory Commission, Rockville, MD
3Senior Structural Engineer, US Nuclear Regulatory Commission, Rockville, MD 4Director of Structures, Moffatt & Nichol, San Diego, CA
5Senior Member of Technical Staff, Sandia National Laboratories, Albuquerque, NM
ABSTRACT
A multi participant international round robin exercise, the Standard Problem Exercise # 3 (SPE#3) has been conducted with the intent of advancing the state of the art in concrete containment modeling. Four distinct models based on the United States Nuclear Regulatory Commission (USNRC)/Nuclear Power Engineering Corporation (NUPEC) 1:4-Scale Prestressed Concrete Containment Vessel (PCCV) model tests performed at Sandia National Laboratories were created and analyzed by the various participants. The comparison of the results of these modeling efforts proved beneficial for all of the member organizations and the collaboration served to grow the knowledge base and advance the state of the art.
INTRODUCTION
As part of the Indo-U.S. civilian Nuclear Agreement, the USNRC and the Atomic Energy Regulatory Board (AERB) of India are working together to organize and participate in the SPE#3 round robin analysis. The SPE#3 builds on previous round robin analyses [1] of the NRC/NUPEC 1:4-Scale Prestressed Concrete Containment Vessel model tests performed at Sandia National Laboratories (SNL) [2]. Seven international organizations participated in this exercise:
Atomic Energy Regulatory Board of India (AERB),
Electricite de France (EDF)
FORTUM (Finland)
Gesellscaft fur Anlagenund Reaktorsicherheit (GRS), (German Agency for Reactor Safety)
Nuclear Power Corporation of India Limited (NPCIL)
US Nuclear Regulatory Commission (NRC)
SCANSCOT (Sweden)
PROBLEM DESCRIPTION
SPE#3 was the further examination of local effects deemed significant, including: the effects of containment dilation on prestressing force, slippage of prestressing cables, steel-concrete interface, failure mechanisms, and the use of nominal versus in-situ conditions in the previous round robin analyses.
For phase two, the two major topics of investigation were the inclusion of temperature effects and leakage prediction. Any reactor accident capable of pressurizing the containment building would certainly involve an increase in temperature, and this could affect the material properties of the containment. Modeling both the temperature effects on material properties and simple thermal dilation gives a more realistic prediction of containment behavior during an actual accident. The prediction of leakage attempts to answer the central question surrounding containment performance, namely the ability to contain dangerous radionuclides in a severe accident.
FINITE ELEMENT MODELS
Over the course of the round robin, participants were asked to create four finite element models with each model attempting to address specific aspects of the SPE#3 goals. The first two models are local models that probe more fundamental phenomena while the latter two are large, three dimensional models that study the containment structure as a whole. As mentioned above, the models are all based on the NRC/NUPEC 1:4-Scale test in both geometry and materials. The level of detail and specific modeling approaches such as material models, element type, reinforcement, and failure were left up to the participants.
The first model consists of two hoop tendons from the NRC/NUPEC 1:4-Scale test and is shown in Figure 1. The location of tendons was selected to allow the assumption that the tendons are unaffected by penetration stiffness discontinuities in the wall. This model was used to investigate tendon forces as a function of containment dilation, and slippage of prestressing cables.
As with Model 1, Model 2 investigates several different aspects of steel-concrete interface using one local analysis model. The topics are: (1) ovalizations of concrete versus steel, with specific emphasis on displacement and the leakage this could cause, (2) slippage between the liner and the concrete, and the influence of this behavior on potential tearing and leakage, and (3) a study of rebar stress-strain specified versus stress-strain characteristics in the finite element model (because concrete can influence this representation). The geometry and boundary conditions for Model 2 are shown in Figure 2.
Figure 2: Model 2 includes the equipment hatch region with hoop and vertical tendons, rebar, and the liner.
Figure 3: The global model captured, in three dimensions, the Sandia/NRC/NUPEC 1:4 Scale PCCV Test [2] and details were left up to the participants.
RESULTS
For each finite element model created, participants were requested to provide standard output at various locations for the use of comparison. Among the requested outputs were liner strains, tendon stress and strain distributions, overall displacement, pressure levels at various milestones, and ovalization of penetrations. Results among all participants showed good agreement. A tremendous amount of data was generated for the SPE#3 exercise and, due to space constraints in this document, only a very small subset of representative results is presented.
Model 1
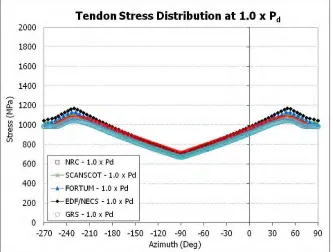
As mentioned previously, the SPE #3 was divided into two phases. Model 1 investigates the local effects of interest in Phase One, specifically, effects of containment dilation on prestressing force, and slippage of prestressing cables. The slippage of prestressing tendons and the friction associated with that slippage is of critical importance in predicting a number of containment behaviors. Figure 4 shows the participants’ results from Model 1 for the distribution of tendon stress as a function of azimuth around the circumference of the containment. The characteristic peak in the stress distribution approximately 30° from the anchorages (at 90° and 270°) are a function of the containment geometry and the friction between the tendons and the tendon ducts.
test. This figure highlights the relative certainty between state of the art predictions of elastic versus the non-linear regimes of structural response.
Figure 4: The tendon stress distribution at the design pressure
Model 2
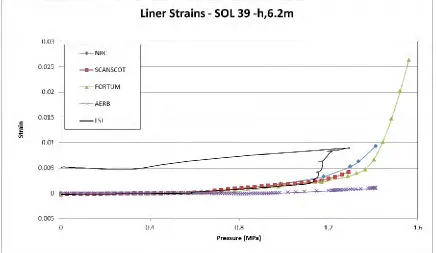
As noted previously, the participants were requested to create a local model of the equipment hatch (Figure 2). The participants were asked to represent the contact to the liner in three different methods: a) a fully tied case, b) connection only along the anchors, and c) a best representation approach to be left up to each participant to determine. The geometry of the model remained identical in all three sub-cases. The participants were required to provide strain magnitude values for several locations specified; the participants’ responses are plotted together for location as a function of internal pressure. As an example, the liner strain versus internal pressure results for Location 1 (hoop strain, elevation 4.65 M, 18° Azimuth, see Figure 2) from Model 2a are shown below in Figure 6. These results again indicate good agreement between participants, particularly up to approximately 1.3 MPa.
Figure 6: Participant's results for liner strain versus pressure
Model 3
As mentioned previously, Model 3 is a global analysis model aimed at incorporating lessons learned from Model exercises 1 and 2, and at providing PCCV response information at any and all locations of the structure. One of the major areas of interest in Model 3 is characterizing strain in the liner, to be used in comprehensive failure prediction, which will be key to the successful completion of Phase 2. As with Model 1 and Model 2, a large quantity of output results were requested from the participants.
pressurization phase of the test AND the depressurization (unloading). The analysis data only shows the pressurization.
Figure 7: The participant’s displacement versus pressure at SOL #13 (radial displacement at springline of buttress)
Model 4
As mentioned previously, Model 4 is identical to Model 3 but includes the effects of temperature in addition to internal pressure and also is used to predict leakage from the containment. Model 4 represents a “best estimate” of current modeling capability for containment capacity.
The participants from AERB provided a description of two models from literature to calculate the leakage rate through various materials. They focused on the Rizkalla et al. [3, 4] method, and the Vennerd & Street method [5]. The Rizkalla method was chosen for perceived applicability to the problem of gas flow through cracks while the Vennard and Street method was chosen for fundamental accuracy. The leakage rate formulas used by each participant to transition from crack width to leakage rate as a function of pressure are listed in Table 1.
Table 1: Several participants chose the Rizkalla method while SCANSCOT chose the Vennard and Street method.
Organization Leakage Rate Method
Used
AERB Rizkalla
FORTUM Rizkalla
NRC Rizkalla
SCANSCOT
Vennard & Street (frictionless gas flow through a convergent
nozzle)
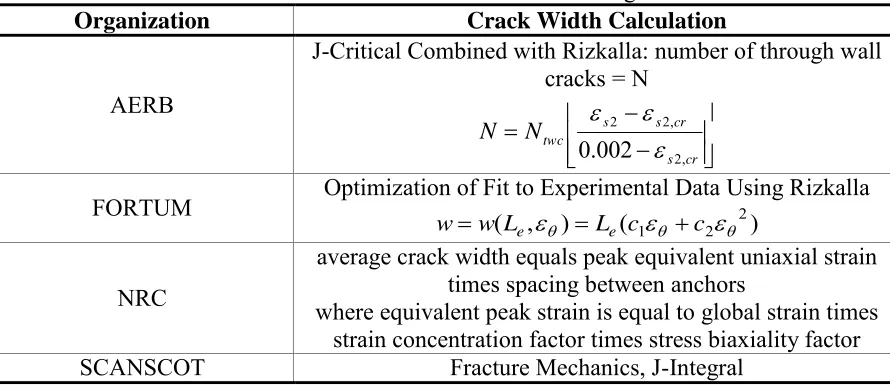
Each participant had the freedom to use any method desired to transition from FEM strains to subsequent crack widths. A list of the different methods used is provided in Table 2.
Table 2: Each participant chose a different method with which to estimate the crack width from the liner strains obtained from modeling.
Organization Crack Width Calculation
AERB
J-Critical Combined with Rizkalla: number of through wall cracks = N
cr s cr s s twc N N , 2 , 2 2 002 . 0
FORTUM Optimization of Fit to Experimental Data Using Rizkalla ( , ) ( 2) 2
1
L c c
L w
w e e
NRC
average crack width equals peak equivalent uniaxial strain times spacing between anchors
where equivalent peak strain is equal to global strain times strain concentration factor times stress biaxiality factor
CONCLUSIONS
Results among all participants showed good agreement. The biggest success of the effort was furthering the state of the art in modeling of prestressed concrete containment vessels (PCCV), especially the simulation of tendon friction, and of 3D global behavior. New approaches to failure models and subsequent leakage rates were explored. In addition to the advances in computational power and efficiency since the 1999 test, the modeling of friction and other localized details in the PCCVs has significantly improved, thus increasing the understanding of the response of PCCVs to beyond design pressure loading.
Some variability in modeling technique was observed between the participants, most notably in the method of modeling the rebar and the tendons. Additionally relatively minor differences were observed in the specific values used for the material properties. It is suspected that the variation in modeling approach and the minor differences in the input material properties likely account for the variations noted in the results from the participants.
The tendon stress profiles, tendon strain versus pressure plots, and radial displacement versus pressure plots indicate good agreement between the participants, particularly up to approximately 1.3 MPa or 3.0-3.3 x Pd. Beyond this point in the pressurization, the variance between the participants’ predictions increases; in general the model response predictions become increasingly unstable in this pressure regime as the residual stiffness to carrying increasing pressure becomes small. This conclusion is supported by test observations of the Limit State Test in the NUPEC/NRC 1:4 Scale PCCV Test at 3.3 x Pd due to rapid leakage and associated rapidly increasing radial displacements. Additionally, several participants studied and verified the phenomena where slipping of the tendons with internal pressure is a contributor to the observed flattening of the tendon force versus azimuth plots at high pressures . Previously, this flattening was only attributed to yielding of the tendons.
ACKNOWLEDGEMENTS
This report was prepared as an account of work sponsored by an agency of the U.S. Government. Neither the U.S. Government nor any agency thereof, nor any of their employees, makes any warranty, expressed or implied, or assumes any legal liability or responsibility for any third party’s use, or the results of such use, of any information, apparatus, product, or process disclosed in this report, or represents that its use by such third party would not infringe privately owned rights. The views expressed in this paper are not necessarily those of the U.S. Nuclear Regulatory Commission.
REFERENCES
1. Hessheimer, M.F. and E. Mathet, International Standard Problem No. 48, Containment
Capacity, NEA/CSNI/R(2005)5, OECD Nuclear Energy Agency, Paris, France, 2005.
2. Hessheimer, M.F., et al., Overpressurization Test of a 1:4-Scale Prestressed Concrete
Containment Vessel Model, NUREG/CR-6810, SAND2003-0840P, Sandia National
Laboratories, Albuquerque, NM, 2003.
3. Rizkalla, S.H., B.L. Lau, and S.H. Simmonds, Air leakage characteristics in reinforced
4. Tinkler, J., R. Del Frate, and S. Rizkalla, The prediction of air leakage rates through cracks in pressurized reinforced concrete containment vessels. International journal of
pressure vessels and piping, 1987. 29(1): p. 33-46.
5. Vennard, J.K. and R.L. Street, Elementary fluid mechanics. JOHN WILEY & SONS,
![Figure 1. The tendon behavior model (Model 1), represents tendons H53 and H54, elev. 6.579 m from [2] (refer to dwg](https://thumb-us.123doks.com/thumbv2/123dok_us/1508082.1184676/2.612.171.443.451.682/figure-tendon-behavior-model-model-represents-tendons-refer.webp)
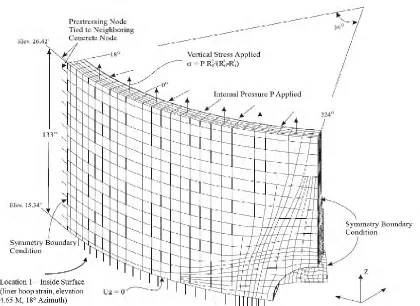
![Figure 3: The global model captured, in three dimensions, the Sandia/NRC/NUPEC 1:4 Scale PCCV Test [2] and details were left up to the participants](https://thumb-us.123doks.com/thumbv2/123dok_us/1508082.1184676/4.612.95.519.75.337/figure-global-captured-dimensions-sandia-nupec-details-participants.webp)