HIGHLIGHTED ARTICLE
| INVESTIGATION
Contrasting Determinants of Mutation Rates in
Germline and Soma
Chen Chen,*,†,1Hongjian Qi,‡,§Yufeng Shen,‡,** Joseph Pickrell,*,†,2and Molly Przeworski*,‡,2
*Department of Biological Sciences,§Department of Applied Physics and Applied Mathematics, and **Department of Biomedical Informatics, Columbia University, New York, New York 10025,†New York Genome Center, New York, New York 10013, and ‡Department of Systems Biology, Columbia University Medical Center, New York, New York 10032
ABSTRACTRecent studies of somatic and germline mutations have led to the identification of a number of factors that influence point mutation rates, including CpG methylation, expression levels, replication timing, and GC content. Intriguingly, some of the effects appear to differ between soma and germline: in particular, whereas mutation rates have been reported to decrease with expression levels in tumors, no clear effect has been detected in the germline. Distinct approaches were taken to analyze the data, however, so it is hard to know whether these apparent differences are real. To enable a cleaner comparison, we considered a statistical model in which the mutation rate of a coding region is predicted by GC content, expression levels, replication timing, and two histone repressive marks. We applied this model to both a set of germline mutations identified in exomes and to exonic somatic mutations in four types of tumors. Most determinants of mutations are shared: notably, we detected an effect of expression levels on both germline and somatic mutation rates. Moreover, in all tissues considered, higher expression levels are associated with greater strand asymmetry of mutations. However, mutation rates increase with expression levels in testis (and, more tentatively, in ovary), whereas they decrease with expression levels in somatic tissues. This contrast points to differences in damage or repair rates during transcription in soma and germline.
KEYWORDShuman; mutation rate; germline mutations; somatic mutations; strand asymmetry
G
ERMLINE mutations are the source of all heritable var-iation, including in disease susceptibility, and it is in-creasingly clear that somatic mutations also play important roles in human diseases, notably cancers (Muller 1927; Stratton et al.2009). Understanding the rate and mecha-nisms by which mutations occur is therefore of interest to both evolutionary biologists and to human geneticists aiming to identify the underlying causes of genetic diseases (Shendure and Akey 2015; Gao et al.2016). In particular, an accurate estimate of the local mutation rate is key totesting for an excess of disease mutations in specific genes among cases (Lawrenceet al.2013; Samochaet al.2014). Characterization of the variation in mutation rate along the genome can also yield important insights into DNA damage and repair mechanisms (Stratton 2011; Ségurelet al.2014). Until recently, our understanding of germline point muta-tions came mainly from analysis of diversity along the genome or divergence among species (Greenet al.2003; Websteret al.
2004; Polak and Arndt 2008; Hodgkinson and Eyre-Walker 2011; Park et al.2012). In the past several years, analyses have also been based on resequencing exomes or whole ge-nomes from blood samples of human pedigrees and calling germline variants as those present in the offspring but absent in the child (reviewed in Campbell and Eichler 2013; Ségurel
et al.2014; Shendure and Akey 2015). This approach is more direct than analyzing divergence data, and presents the advantage of being almost unaffected by selection, but the analysis is technically challenging and, with current study designs, some mutations may be missed, notably those that occur in the early postzygotic divisions (Harlandet al.2016; Moorjaniet al.2016; Rahbariet al.2016).
Copyright © 2017 Chenet al.
doi:https://doi.org/10.1534/genetics.117.1114
Manuscript received March 15, 2017; accepted for publication July 1, 2017; published Early Online July 21, 2017.
Available freely online through the author-supported open access option.
This is an open-access article distributed under the terms of the Creative Commons Attribution 4.0 International License (http://creativecommons.org/licenses/by/4.0/), which permits unrestricted use, distribution, and reproduction in any medium, provided the original work is properly cited.
Supplemental material is available online atwww.genetics.org/lookup/suppl/doi:10. 1534/genetics.117.1114/-/DC1.
1Corresponding author: Columbia University, 531 W 112th St. 4E1, New York, NY 10025. E-mail: cc3499@columbia.edu
Our knowledge of somatic point mutations, in turn, relies primarily on resequencing tumors. In these analyses, mutation calls are made by sequencing tumor and noncancerous tissue pairs from the same individual, and then excluding the var-iants shared between the two tissues (as the shared mutations are likely to be germline). Because, in this approach, a large population of cells is sequenced, the mutations identified tend to predate the tumorigenesis, and thus are mostly somatic mutations that occurred in normal tissues (see,e.g., Alexandrov
et al.2015; Martincorenaet al.2015).
Studies of both germline and soma reveal that the point mutation rate varies across the genome, from the scale of a single base pair to much larger scales (Hodgkinson and Eyre-Walker 2011; Hodgkinsonet al.2012; Ségurelet al.2014). At the single base pair level, the largest source of variation in germline mutation rate is the identity of the adjacent base pairs (Hwang and Green 2004; Hodgkinson and Eyre-Walker 2011). Notably, the mutation rate of CpG transitions (hence-forth CpG Ti) is an order of magnitude higher than other mutation types (e.g., Konget al.2012). Most CpG dinucleo-tides are methylated in the human genome; when the meth-ylated cytosine undergoes spontaneous deamination to thymine and is not corrected by the time of replication, the damage leads to a mutation. Among other types of sites, rates of mutation vary by two- to threefold (Konget al.2012). In the soma, the mutation rate at CpG sites is also elevated, although the extent of the increase differs across tumor types (Leeet al. 2010; Pleasanceet al.2010a,b). More generally, tumors vary in their mutation spectrum: analyses of muta-tions and their two neighboring base pairs (i.e., considering 96 mutation types) point to enrichment of distinct mutational signatures for different types of cancers, a subset of which have been shown to reflect particular mutagens or differ-ences in the efficiency of repair (Alexandrovet al.2013).
Over a larger scale of megabases, germline mutation rates have been associated with a number of additional factors, including transcription level (in testis), replication timing (in lymphoblastoid cell lines), chromatin states (both in lymphoblastoid cells and in ovary), meiotic crossover rates, and GC content (Hodgkinson and Eyre-Walker 2011; Michaelson et al. 2012; Park et al. 2012; Francioli et al.
2015; Besenbacheret al.2016; Goldmannet al.2016). Somatic mutation rates have also been associated with replication timing (in Hela cell lines) and with average transcription levels across 91 cell lines in Cancer Cell Line Encyclopedia (Lawrenceet al.2013).
In many cases, little is known about the mechanistic basis for the association of a given factor with mutation rates. However, the association of somatic mutation rates with transcription levels appears to be a byproduct of transcrip-tion-coupled repair (TCR), a subpathway of nucleotide exci-sion repair (NER) (Hanawalt and Spivak 2008; Nouspikel 2009). NER is a versatile repair pathway that senses lesion-causing distortions to DNA structure and excises the lesion for repair. Another subpathway of NER, global genome repair (GGR), can repair lesions on both transcribed strand (TS)
and nontranscribed strand (NTS), including transcribed re-gions as well as transcriptionally silent ones. In contrast, TCR operates only within transcribed regions, triggered by lesions on the TS, which it repairs off the NTS. This mechanism gives rise to a mutational strand asymmetry, as well as a composi-tional asymmetry between strands. For example, TCR leads to more A–G mutations (henceforth A.G) on the NTS than TS; acting over long periods of time, this phenomenon gen-erates an excess of G over A (and T over C) on the NTS (Green
et al. 2003; McVicker and Green 2010). Such mutational strand asymmetry has been found in both germline and soma (Greenet al.2003; Polak and Arndt 2008; Rubin and Green 2009; Lawrence et al. 2013; Francioli et al. 2015; Martincorenaet al.2015).
While many of the same determinants appear to play important roles in both germline and soma, there are hints of differences as well. For instance, studies of preneoplastic somatic mutations indicate that, over a 100 kb scale, the mutation rates in somatic tissues decrease with expression levels, and increase with later replication timing (Lawrence
et al.2013). Similarly, two studies that focused on somatic mutations in noncancerous somatic tissues, normal eyelid tissue, and neurons, found mutations to be enriched in re-gions of low expression and repressed chromatin (Lodato
et al. 2015; Martincorena et al.2015). A similar effect of replication timing was identified in studies of germline mu-tation (Stamatoyannopouloset al.2009; Francioliet al.2015; Besenbacheret al.2016; Carlsonet al.2017). However, the effect of expression levels on germline mutation rates re-mains unclear: one study reported increased divergence be-tween humans and macaques with greater germline expression (Parket al.2012), but others found no discernable effect of expression levels on mutation rates (Green et al.
2003; Webster et al. 2004; Polak and Arndt 2008; Hodgkinson and Eyre-Walker 2011; Francioli et al. 2015). This difference between germline and soma is particularly puzzling in light of the observation that the strand asymmetry of mutation rates between TS and NTS is seen in the germline as well as the soma (McVicker and Green 2010; Pleasance
et al.2010a,b; Lawrenceet al.2013). Together, these obser-vations suggest that the determinants of mutation rates may differ between germline and soma, raising the more general possibility that the damage rate or the repair efficacy differs among cell types (Lynch 2010).
A limitation, however, is that studies have used different statistical approaches, rendering the comparison hard to in-terpret. As an illustration, whereas some studies binned the genome into windows of 100 kb (e.g., Lawrenceet al.2013) or 1 Mb regions (e.g., Polaket al.2015), other studies have compared the mean mutation rate in transcribed regions and nontranscribed regions or in genes grouped by expression levels (Hodgkinson and Eyre-Walker 2011; Francioli et al.
2015; Lodatoet al.2015). Studies of somatic mutation also vary in whether they group different tissues or distinguish among them (e.g., Pleasance et al. 2010b; Lawrence et al.
mutation is that, by necessity, they relied on human–chimpanzee divergence as a proxy for de novo mutation rates (Green
et al. 2003; Webster et al. 2004; Hodgkinson and Eyre-Walker 2011), even though divergence reflects not only the mutation process but also effects of natural selection in the human–chimpanzee ancestor and biased gene con-version (Duret and Galtier 2009; McVickeret al.2009).
To our knowledge, only one study has used a uniform approach to study germline and soma. Theirfindings point to possible differences in their determinants: for instance, the histone mark H3K9me3 accounts for.40% of mutation rate variation at 100 kb in tumors, when a much weaker associ-ation is seen in the germline (Schuster-Böckler and Lehner 2012). This analysis relied on pairwise correlations, however, and therefore the results may be confounded by other factors that are correlated to the histone marks and differ between tissues. Moreover, to our knowledge, there has been no par-allel treatment of strand asymmetry in germline and soma.
To overcome these limitations, we built a multivariable regression model, in which the mutation rates of CpG Ti and other types of mutations in a coding region are predicted by GC content, expression levels, replication timing and two histone repressive marks. To this end, we used the expression levels, replication timing and histone marker levels of matched cell types, when available. We applied the model to a large set of germline point mutations identified in exomes from recently published studies on developmental disorders and to somatic point mutations in exomes found in four types of tumors and reported by the Cancer Genome Atlas (see Materials and Methods). In addition, we considered the mutational strand asymmetry in the two sets of data.
Materials and Methods
Datasets
To study germline mutations, we relied onde novomutation calls made from 8681 trios surveyed by exome sequencing. We combined results from two main sources: studies of neurodevelopmental disorders (NDD), which considered 5542 cases and 1911 controls (unaffecteds), and studies of congenital heart defect (CHD), conducted by the Pediatric Cardiac Genomics Consortium, which included 1228 trios.
The NDD cases include 3953 cases of Autism Spectrum Disorder (ASD), 1133 cases of deciphering developmental disorders (DDD), 264 cases of epileptic encephalopathies (EE), and 192 cases of intellectual disability (ID). All these studies applied similar capture and sequencing methods, and most samples were at.203coverage (see Table 1).
We tested for an effect of the study, which could potentially arise from differences in design or analysis pipeline, by adding a categorical variable (by an analogous approach to the one described below to test for differences among tissues). We found a marginally significant interaction between the study and the expression level in testis (our proxy for expression levels in the germline), driven by one study (CHD cases; Homsyet al.2015), as well as for interactions between the studies and the effects of H3K9me3 and GC content, driven by two small studies (EE and ID) (see Supplemental Material, Figure S1 inFile S1). Given these minor differences, and in order to increase our power, we combined all the germline mutation datasets in what follows (see Table S1for list of mutations).
To examine determinants of mutation rates in somatic tissues, we downloaded somatic mutation calls identified in four types of cancer from the Cancer Genome Atlas (TCGA) portal (in July 2015): breast invasive carcinoma (BRCA), cervical squamous cell carcinoma and endocervical adenocar-cinoma (CESC), brain lower grade glioma (LGG), and liver hepatocellular carcinoma (LIHC). The numbers of samples are listed below (Table 2). In all cases, both noncancerous and tumor tissues of patients were sampled, and the exomes were sequenced using an Illumina platform. In the studies, muta-tion calls shared by the normal and tumor samples were re-moved (on the presumption that they are germline). What remains are somatic mutations found at high enough fre-quency to be seen in a large population of cells, which are therefore likely to predate the tumorigenesis, i.e., that oc-curred in the preneoplastic tissues (Martincorena et al.
2015).
For each type of cancer with more than one mutation annotationfile available in the TCGA data portal, we selected thefile that included the largest number of patient samples. We removed the 7.6% of samples that had an unusually large number of mutations per sample (P , 0.05 by Tukey’s
test), because they are likely to reflect loss of some aspect of Table 1 Summary of germline datasets
Dataset Trios References Capture Sequencing
ASD 3953 De Rubeiset al.(2014);
Iossifovet al.(2014)
Exome Illumina and SOLiD
Simons simplex collection, unaffected
1911 Iossifovet al.(2014) Exome Illumina
CHD 1213 Homsyet al.(2015) Exome Illumina
DDD 1133 The Deciphering Developmental Disorders Study (2015)
Exome Illumina
EE 264 Epi4K Consortiumet al.(2013) Exome Illumina
ID 192 de Ligtet al.(2012); Rauchet al.(2012); Hamdanet al.(2014)
the DNA mismatch repair, and hence their mutational mech-anisms likely differ (Supek and Lehner 2015).
Possible determinants of mutation rates
We considered the main factors previously reported to be significantly correlated with mutation rates, namely ex-pression levels, replication timing, GC content, and histone modification levels. To quantify expression levels, we relied on gene expression data (measured as RPKM) from the Genotype-Tissue Expression (GTEx) for breast, uterus, brain cortex, and liver tissues. We also used GTEx expres-sion data from testis and ovary tissues, as proxies for germ-line cells.
The effect of the replication timing on somatic mutation rates was argued to be cell-type specific (Supek and Lehner 2015). We therefore relied on Repli-Seq measurements (pro-vided per base pair) in ENCODE cell lines that match the four types of cancer, namely MCF-7 (breast cancer), Hela-S3 (cervical cancer), SK-N-SH (neuroblastoma), and HepG2 (liver hepatocellular carcinoma) cell lines. These measure-ments were obtained from the University of California, Santa Cruz (UCSC) Genome Browser. In all cases, the replication timing reported is a smooth measure of the relative enrich-ment of early vs. late S-phase nascent strands, with high values indicating early replication. For each gene, we com-puted the average replication timing by taking the mean value of the data points that overlap with gene start-to-end coordinates in UCSC Refseq gene database. For genes with multiple transcripts, we took the union of all exons in all transcripts. For germline mutations, there are no data for the appropriate cell types, so we used replicating timing es-timates for lymphoblastoid cell lines (LCL) (provided in 10 kb windows) (Koren et al. 2012). We also tried using replication timing data from three somatic tissues instead; the replication timing data are highly correlated among the tissues, and, accordingly, the effects of mutation were esti-mated to be very similar (see Figure S2 inFile S1).
In addition, we considered the effects of chromatin marks that had been shown to correlate individually with somatic and germline mutation rates (Schuster-Böckler and Lehner 2012; Carlsonet al.2017): specifically, histone modification H3K9me3 and H3K27me3, two repressive marks associated with constitutively and facultatively repressed genes, respec-tively. Levels of these marks were downloaded from roadmap epigenomics data browser (December 2015, hg19) and con-verted to gene-based histone modification levels by averag-ing across the gene. We used the histone modification levels of adult ovary, breast myoepithelial cells, brain hippocampus,
and adult liver as proxies for germline, breast, brain, and liver, respectively. In the following regression analysis, we considered only three of four somatic tissues, as we could not obtain histone modification data for CESC. Finally, we computed exonic GC content as the fraction of G or C residues in the union of exons in all isoforms of a given gene.
Germline mutation studies relied on the UCSC Refseq gene annotation, whereas TCGA uses GENECODE annotation, which contains more transcripts (Larssonet al.2005; Zhao and Zhang 2015). To make the comparison cleaner, we fo-cused on exonic regions considered in both types of studies by using gene and exon coordinates of Refseq database in build hg19 from the UCSC genome browser.
Statistical model
Our main goal was to investigate possible relationships be-tween mutation rates and gene expression levels, while con-trolling for replication timing, GC content and some histone modification levels. Because our mutation counts are over-dispersed, with greater variance than mean, we used a neg-ative binomial regression model (instead of, e.g., a Poisson regression model). Specifically, for every protein-coding gene, we counted the number of CpG Ti or other types of mutations in the coding exons of a gene and treated it as an outcome of a sequence of independent Bernoulli trials with probabilityli, whereliis the probability of a mutation occurring in gene i.
Transitions at CpG sites are thought to occur primarily due to spontaneous deamination at methylated cytosines, a dis-tinct mutational source, and thus their determinants may be distinct from other mutation types (reviewed in Ségurelet al.
2014). However, within CpG islands, most CpGs are hypome-thylated (Takai and Jones 2002). To focus on a more homo-geneous set of methylated CpGs, we therefore excluded CpG islands from the analyses of CpG Ti. CpG island annotations were downloaded from UCSC browser (track: CpG Islands). In one analysis (Figure 2), we included the average level of CpG methylation in each gene in our model, as assayed by bisulfate sequencing in ovary, sperm, breast myoepithelial cells, brain hippocampus cells, and adult liver cells.
We considered gene expression levels measured in RPKM (X1), replication timing (X2), mean histone modification levels (H3K9me3 as X3and H3K27me3 as X4), and GC con-tent (X5) as predictors. We also included L, the total number of CpG sites (when considering CpG Ti) or all nucleotides (when considering all other types of mutations) in the exons of the given gene, as an exposure variable, to account for the variation in gene length. The logarithm ofliis then modeled as a linear combination of these features scores:
logðliÞ ¼b0þX
5
j¼1
bjXijþlogðLÞ þe
We used R function glm.nb to estimate the coefficients, where
b0is an intercept term,bj is the effect size of feature j, and Xij Table 2 Sizes of TCGA datasets
Dataset Sample size
BRCA 904
CESC 181
LGG 502
is the score for feature j in gene i. In order to make the effect sizes of different features comparable within a model, we normalized all the predictor variables to have a mean of 0 and a SD of 1. The gene expression levels measured in RPKM originally range from 0 to a few hundred thousand. As is standard (e.g., Greenet al.2003; Francioliet al.2015), we added half of the smallest nonzero value in the corre-sponding expression data sets and then log-transformed the expression level before normalization.
We note that, in this model, we are considering possible effects one at a time. Including interaction terms affects the estimates and significance levels but changes none of the qual-itative results, with the exception of results for H3K27me3, which become less significant (see Figure S3 inFile S1).
To examine whether the predictors have significantly dif-ferent effects across tissues, we combined the models into one by including a categorical variable C for the tissue type (see Figure 3). In this approach:
C¼1 for somatic tissues; C¼0 for germline;
logðlijÞ ¼b0þP
5
j¼1
bjXijþC
b6þP11
j¼7 bjXij
þlogðLÞ þe
where X1, X2, X3, X4and X5are the same genomic or epige-nomic features as in the separate model,b1,b2,b3,b4,b5are the effect sizes of features X1to X5for testis, andb7,b8,b9,
b10, andb11are the differences of effect size in the somatic tissue of features X1 to X5compared to those in testis. We used the R function glm.nb to estimate the coefficients.
Similarly, in order to ask whether effects differ between CpG Ti and other type of mutations in the same tissue, we included a binary variable C for the two mutation types (see Figure S4 inFile S1) where:
C¼1 for CpG Ti; C¼0 for all other mutations;
logðlijÞ ¼b0þP
5
j¼1
bjXijþC
b6þP11
j¼7 bjXij
þlogðLÞ þe
All variables are set up the same way as in the combined model described previously, except for thatb7,b8,b9,b10, andb11 are now the differences of the effect sizes for CpG Ti com-pared to those for all other mutation types.
Mutation spectrum and strand asymmetry analysis
We annotated the direction of transcription using the UCSC CCDS track andfiltered out genes that are transcribed off both strands (1.7% of genes in Refseq), which left19,000 genes to consider. This annotation allowed us to classify mutations into six types of mutation (A.C, A.G, A.T, G.A, G.C, G . T) on either TS or NTS. There are thus 12 possible changes (each of the six on both strands). We then calculated the mutation rate of any given type on NTS and TS separately, by considering the number of corresponding mutations in the combined data sets, divided by the total number of nucleo-tides that could give rise to such a mutation in the exons. To obtain the confidence intervals on the mutation rates (re-ported in Figure 4, Figure 5, and Figure S5 inFile S1) as well
as for the mutation asymmetry ratio (Figure 5 and Figure S5 in File S1), we used bootstrap resampling. Specifically, we created 100 samples of the same size as the original sample, by drawing randomly from the original sample with replace-ment, and estimated the 95% CI from those 100 samples.
We tested for strand asymmetry by a Chi-squared test. Because A.G strand asymmetry shows the greatest asym-metry (Greenet al.2003), and is the only mutation type that we found to be significant (and in the same direction) in all tissues (Figure 4), we focused primarily on this type, though we also considered A.T mutational patterns (see Figure S5 inFile S1). To test if the extent of strand asymmetry changes with transcription levels, we grouped genes into expression level quantiles and calculated A.G strand asymmetry. Our measure of strand asymmetry is the ratio of the mutation rate on NTS to that on TS.
sequence of independent Bernoulli trials with probabilityli as the response variable in the model below.
logðliÞ ¼b0þX
5
j¼1
bjXijþlogðLÞ
whereLis the corresponding number of As on the NTS or TS of a gene and other predictor variables are set up the same way as in the separate model in Figure 1. We applied the same analysis to A .T mutations, for which we detected significant asymmetry in the same direction in all types of tissues except for LGG (Figure S6 inFile S1).
Data availability
Germline mutations are provided inTable S1. TCGA somatic mutations can be downloaded from GDC data portal (https://gdc-portal.nci.nih.gov/). The replication timing data of LCL and other tissues are available from Korenet al.(2012) and the ENCODE website (https://www.encodeproject. org/search/?type=Experiment&assay_title=Repli-seq), re-spectively. The histone modification data can be freely accessed from the Epigenome Roadmap website (http:// www.roadmapepigenomics.org/data/tables/all). CpG meth-ylation data were downloaded from GEO (https://www.ncbi. nlm.nih.gov/geo/), with accession number GSM1010980 for ovary, GSM1127119 for sperm, GSM11217054 for breast myoepithelial cells, GSM1112838 for brain hippocampus cells, GSM916049 for adult liver cells, and GSM429321 for ESC cells.
Results
Variation among germline and somatic tissues
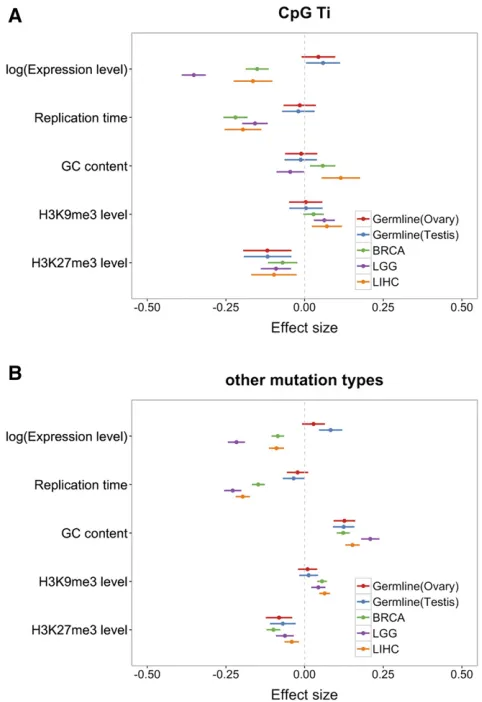
We began by applying our multivariable regression model (seeMaterials and Methods) to compare the determinants of
mutation rates per gene between the two germline tissues, and among the three somatic tissues (Figure 1). Results for germline mutations are very similar using testis or ovary ex-pression profiles.
Notably, in both testis and ovary, we found little effect of replication timing on germline mutation rates, other than a marginally significant negative effect for mutations other than CpG Ti (P = 0.046, using testis expression data). An association of replication timing had been previously re-ported for (imperfect) proxies of de novo mutation rates (Stamatoyannopoulos et al. 2009), suggesting that our in-conclusivefindings may reflect lack of power. Indeed, if we combine all mutation types within a coding region, and add CpG methylation levels within the gene as a covariate, the effect of replication timing is more readily apparent (Fig-ure 2; P = 3.3 3 1024using testes expression data, and
P = 0.01 using ovary expression data).
We also detected a significant increase of germline muta-tion rates with expression levels for both CpG Ti and other mutation types (Figure 1; see also Figure S2 inFile S1 for similar results with replication timing for different tissues), in contrast to a previous study using de novo mutations (Francioli et al. 2015) and most previous studies of diver-gence. One difference with the previous analysis ofde novo
mutations is that we rely on exonic mutation data and focus on the unit of a gene, whereas they considered whole genome data, dividing it up into 100 kb windows.
In our analysis, the effect of expression levels is most clearly seen using testis expression (e.g., in Figure 2,
P = 2.1 3 1026) rather than ovary expression (P = 0.02), possibly due to the fact that over three-quarters of germline mutations are of male origin (Konget al.2012; Goldmann
analysis of the germline mutation rates, unless otherwise noted.
We note that our analysis of germline mutation relies onde novomutation calls made in exome studies of blood samples from six sets, including five cases and unaffected controls (see Table 1). A previous study reported that in one set of cases, individuals with CHD, there is an increased number of putatively damaging mutations in the genes most highly expressed in the developing heart and brain (Homsy et al.
2015). Since the mutations are thought to be germline mutations (rather than somatic mutations), this association cannot be causal, instead reflecting an enrichment of damag-ing mutations in important heart developmental genes in CHD patients. To evaluate whether ourfindings of increased mutation rates with germline expression levels could be driven by a similar ascertainment bias, we excluded the CHD set and obtained the same results (see Figure S7 inFile S1). We also reran the analysis, comparing the effects in the
five cases compared to the controls; none of the qualitative results differed, though, as expected from the smaller size of the control sets, the estimated effect sizes were more uncer-tain (see Figure S8 inFile S1). Thus, our results suggest that the increase in mutation rates with expression levels in testes is not a result of focusing primarily on cases.
Germline mutation rates involving CpG Ti and other types are negatively associated with H3K27me3 levels (Figure 1). We also found that, other than for CpG Ti, germline mutation rates increase with the GC content of a gene. This observation is consistent with previousfindings of a high rate of GC to AT mutations relative to other types (e.g., Konget al.2012). In addition, it is thought that misincorporated bases during DNA replication in AT rich regions are more easily accessible, and thus more easily repaired than GC rich regions (Petruska and Goodman 1985; Bloomet al.1994). Indeed, considering only AT sites, mutation rates increase in regions of higher GC (see Figure S9 inFile S1), indicating that there is an effect of the GC content of nearby sites, not only of the higher muta-tion rate of GC sites themselves.
Among somatic tissues, the effects of mutation rate pre-dictors are also concordant. Notably, mutation rates decrease with expression levels in all three tissues, though the mag-nitudes of the effects differ. This finding is consistent with previous studies and thought to be a result of TCR (Lawrenceet al.2013). Intriguingly, in a model comparing the effects on CpG Ti and other mutation types directly, in all three somatic tissues, the effect of expression levels on mu-tation rates is most pronounced for CpG Ti (see Figure S4 in
File S1). Thisfinding suggests that damage or repair of CpG Ti is tightly coupled to transcription.
In all three somatic tissues, a later replication timing, a decrease in H3K27me3 levels, or an increase with H3K9me3 levels lead to an increase in mutation rates (Schuster-Böckler and Lehner 2012; Behjati et al.2014; Blokzijlet al.2016). The effect of replicating timing on mutation rate has been attributed to the depletion of free nucleotides within later replicating regions, leading to the accumulation of
single-stranded DNA, and thus rendering the DNA more susceptible to endogenous DNA damage (Stamatoyannopoulos et al.
2009). An alternative hypothesis is that DNA mismatch repair (MMR), which is coupled with replication, is more effective in the early replicating regions of the genome; this possibility is supported by the finding that this association is not de-tected in the tissue of MMR-deficient patients (Supek and Lehner 2015). While on face value, it may seem surprising that replication timing is a significant determinant for the LGG samples, given that neurons are postmitotic, glial cells still retain their ability to divide and a substantial fraction of mutations detected in neuronal samples may have occurred at earlier stages in development.
Differences between somatic tissues and testis
significant positive effect for germline mutations and a sig-nificantly negative effect for somatic tissues (e.g., BRCA:
P = 8 3 10216for CpG Ti;P , 2 3 10216for other mu-tation types;P , 2 3 1027for all somatic tissues and mu-tation types). When we tested for this difference explicitly, by adding a binary variable for soma and germline (see Ma-terials and Methods), we found that, indeed, both expression levels and replication timing differ in their effects, for CpG Ti and other mutation types (using testis as a proxy for germline expression levels; Figure 3). The same qualitative results are obtained when using expression data from ovary instead (Figure S10 inFile S1).
Notably, the effect of replication timing is stronger in soma (Figure 2 and Figure 3). The simplest explanation is that a larger fraction of mutations in the soma are introduced by errors related to replication, as opposed to other nonreplica-tive sources. Another (not mutually exclusive) possibility is that the effect of early replicationvs.late replication differs to a greater extent in the soma than in the germline. For exam-ple, if MMR is much more efficient in early replicating regions (Supek and Lehner 2015) and more efficient in soma than germline.
somatic tissues considered, with a greater decrease in muta-tion rates with expression seen in soma (Figure 2, Figure 3, and Figure S10 inFile S1). To examine this possibility further, we considered a signature of TCR—strand asymmetry—in the different tissues, detecting its presence among germline mutations as well as in all four somatic tissues (Figure 4). Consistent with previous studies (Greenet al.2003; McVicker and Green 2010; Francioliet al.2015), one type in particular, A.G, stands out. While the asymmetry is significant (and in the same direction) in allfive data sets, with more muta-tion on the NTS than the TS, the extent of asymmetry is
significantly different among thefive data sets (x2test,
function of expression levels in testis and ovary compared to soma (Figure 1, Figure 2, and Figure 3), despite the fact that we observed clear evidence for TCR in both germline and somatic mutations (Figure 4).
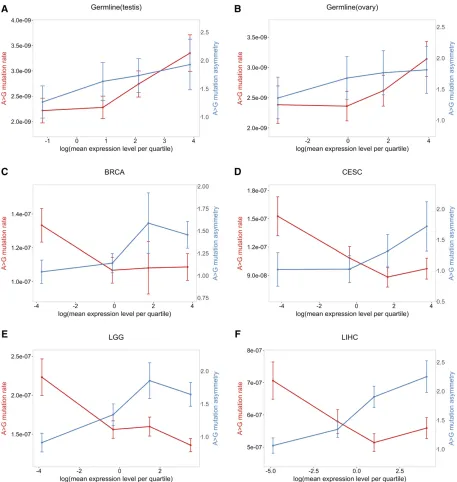
One way to visualize these differences is to focus on A.G mutations, and to consider how the mutation rate and degree of strand asymmetry vary with expression in different tissues (Figure 5). A striking contrast emerges: in testis and ovary, as expression levels increase, mutation rates and asymmetry in-crease, whereas, in the somatic tissues, asymmetry increases while mutation rates decrease. The same pattern is seen when A .T mutation rate and asymmetry are considered (see Figure S5 inFile S1). This difference in behavior with expression levels suggests that the balance between damage and repair rates during transcription differs between germ-line and soma.
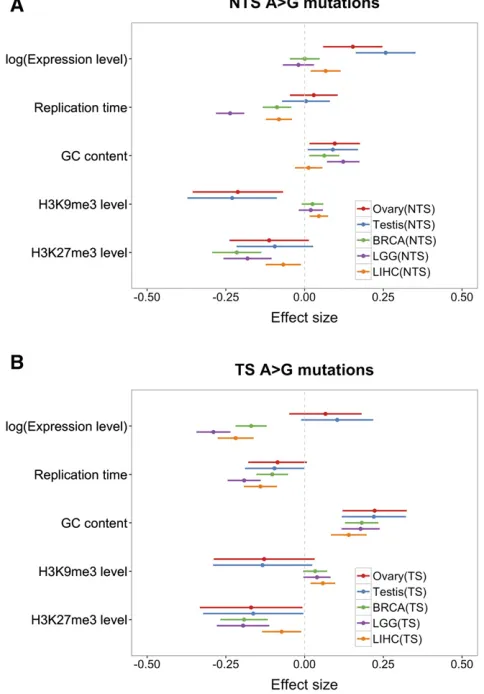
To explore the effects of transcription in more depth, we applied our regression model to NTS A.G mutations and TS A.G mutations separately (Figure 6). Increased expression in the soma has no discernable effect on the NTS, other than in liver, where it slightly increases mutation rates, but it de-creases the mutation rate on the TS. In contrast, expression in testis and ovary leads to increased mutation rates on the NTS, and little or no elevation on the TS. Assuming there is no repair of the NTS by TCR, thesefindings indicate that tran-scription in the germline introduces greater damage than it does in the soma, and, in both cases, that damage is effi -ciently repaired on the TS strand. If, however, the NTS is occasionally repaired by TCR or some other mechanism, then thefindings indicate that the efficiency of TCR (relative to the damage rate) is greater in soma. In this regard, we note that when the same analysis is applied to A.T mutations, which show significant asymmetry in all tissues considered other than LGG, there is some evidence that mutation rates de-crease with expression in somatic tissues even on the NTS, suggesting some form of repair of the NTS coupled to tran-scription (Figure S6 inFile S1).
Discussion
We compared the determinants of mutation in the soma and the germline, using the same unit of analysis (a coding region) and the same statistical model, and applied it to similar exome data for germlinede novomutations and four types of tumors, in which mutations largely predate tumorigenesis. We reca-pitulated previousfindings of the effects of GC content and of a histone mark indicative of repression on germline and so-matic mutations, as well as those of expression levels and replication timing on somatic mutations (Schuster-Böckler and Lehner 2012; Lawrenceet al.2013). Strikingly, we also found clear differences in the determinants of mutation rates between germline and soma, consistent with earlier hints based on divergence data (Hodgkinson and Eyre-Walker 2011). Notably, our results confirmed that somatic mutation rates decrease with expression levels, and reveal that, in sharp contrast,de novogermline mutation rates increase with
expression levels in testis (and more tentatively, in ovary). This contrast suggests that transcription may be mutagenic in germline cells but not in soma, and that the DNA damage or repair processes differ between them.
One limitation of our comparison—and of previous studies of germline and somatic mutation—is the need to rely on proxies for determinants of interest, such as replication tim-ing data from cancer cell lines instead of normal cells and, perhaps most importantly, the use of testis and ovary as a proxy for germ cells. One difficulty in that regard is that so-called “germline mutations” actually arise from many stages of development, including cell types that predate the specification of the germline (see,e.g., Rahbariet al.2016) and thus it is difficult to know which of the available tissues to use as a proxy. Until these findings can be revisited with expression data from more precise cell types, such as primor-dial germ cells and spermatocytes, all that can be concluded is that our findings point to a difference between somatic tissues and some subset of germ cells.
A second limitation is that we considered only two types of mutations (CpG Ti and other). While these two types capture most of the variation in mutation rates, the larger context (adjacent base pairs, but also 7mers) also impacts mutation rates (Hwang and Green 2004; Hodgkinson and Eyre-Walker 2011; Aggarwala and Voight 2016). These different mutation subtypes are likely affected somewhat differently by the de-terminants considered here (Carlson et al. 2017). Despite these limitations, our work provides a framework to contrast possible determinants of mutation rates in soma and germ-line while controlling for some confounding effects, and results will only improve as data sets increase and the mea-surements of salient genomic and cellular features become more accurate.
What is already clear is that there exist divergent effects of expression on mutation rates across tissues that are not attributable to well-known covariates. Moreover, the differ-ences cannot readily be explained by the noise introduced by imperfect proxies or limited data. One possibility is that the effects of transcription do not vary across tissues, but are nonlinear in their effects on mutation rates. As a thought experiment, if genes that are not expressed were not repaired, and had a relatively high mutation rate as a result, and genes that are highly expressed had a high mutation rate because the repair efficiency is insufficient relative to damage, then genes with low levels of expression would be the least mutagenic. If so, tissues in which many genes have either low or no expres-sion might show a decrease of mutation rates with expresexpres-sion, whereas tissues with many genes that are lowly or expressed might show an increase in mutation rates with expression.
A more likely explanation, in our view, is that the tradeoff between damage and repair associated with transcription differs among tissues, and in particular between germline and soma. Indeed, we know that tissue differs by sources of damage (Alexandrovet al. 2015) and the rate at which mutations accumulate (Blokzijl et al. 2016). There also exist differences in the signatures of strand asymmetry (Alexandrovet al.2013; Blokzijlet al.2016; Figure 4). Tran-scription plausibly increases the rate of damage by opening up the DNA helix, rendering the single strands more suscep-tible to mutagens (Polak and Arndt 2008; Jinks-Robertson and Bhagwat 2014). One possibility is that, in the germline, transcription-associated mutagenesis (TAM) swamps TCR, leading to higher mutation rates with increased transcription, whereas in the soma, TCR is more efficient, especially on the TS, and the balance of TAM and TCR leads to decreased mutagenesis with increased expression. Another possibility, which is not mutually exclusive, is the presence of additional repair mechanisms in somatic tissues. In support of this possibility, global genome repair (GGR) is attenuated in dif-ferentiated cells, yet mutations on the NTS appear to none-theless be repaired efficiently (Nouspikel and Hanawalt 2000; Marteijnet al.2014). This evidence led to the hy-pothesis of transcription-domain-associated repair (DAR), which might repair damage on both strands in addition to TCR (reviewed in Nouspikel 2007). From an evolutionary
standpoint, the increased efficiency of TCR relative to TAM in somavs.germline may be explained by selection pressure on the repair of somatic tissues to prevent aging and cancer (Lynch 2010).
Mounting evidence suggests that per cell division mutation rates differ across tissues (Greenmanet al.2007; Lynch 2010; Alexandrovet al.2013), and, in particular, that they may be higher in early embryonic development than at other stages of development (Ségurel et al. 2014; Harland et al. 2016; Lindsayet al.2016; Rahbariet al.2016). This study raises the possibility that at least part of the explanation may lie in the balance between damage and repair, with TCR operating at different efficiencies relative to TAM or jointly with other repair pathways, thereby maintaining low mutation rates in soma. As mutation data from more tissues become available, it will be both feasible and enlightening to examine tissue-specific differences in repair.
Acknowledgments
We thank Ziyue Gao, Priya Moorjani and other members of the Przeworski and Sella laboratories for comments on the manuscripts and helpful discussions. This work was partly supported by GM122975 to M.P.
Literature Cited
Aggarwala, V., and B. F. Voight, 2016 An expanded sequence
context model broadly explains variability in polymorphism lev-els across the human genome. Nat. Genet. 48: 349–355. Alexandrov, L., N.-Z. Serena, D. Wedge, S. Aparicio, S. Behjatiet al.,
2013 Signatures of mutational processes in human cancer. Na-ture 500: 415–421.
Alexandrov, L. B., P. H. Jones, D. C. Wedge, J. E. Sale, P. J. Campbell et al., 2015 Clock-like mutational processes in human somatic cells. Nat. Genet. 47: 1402–1407.
Behjati, S., M. Huch, R. van Boxtel, W. Karthaus, D. C. Wedge et al., 2014 Genome sequencing of normal cells reveals de-velopmental lineages and mutational processes. Nature 513: 422–425.
Besenbacher, S., P. Sulem, A. Helgason, H. Helgason, H. Kristjansson et al., 2016 Multi-nucleotide de novo mutations in humans. PLoS Genet. 12: e1006315.
Blokzijl, F., J. de Ligt, M. Jager, V. Sasselli, S. Roerink et al., 2016 Tissue-specific mutation accumulation in human adult stem cells during life. Nature 538: 260–264.
Bloom, L. B., M. R. Otto, R. Eritja, L. J. Reha-Krantz, M. F. Goodman et al., 1994 Pre-steady-state kinetic analysis of sequence-dependent nucleotide excision by the 39-exonuclease activity of bacteriophage T4 DNA polymerase. Biochemistry 33: 7576–7586.
Campbell, C. D., and E. E. Eichler, 2013 Properties and rates of germline mutations in humans. Trends. Genet. 29: 575–584. Carlson, J., L. J. Scott, A. E. Locke, M. Flickinger, S. Levy et al.,
2017 Extremely rare variants reveal patterns of germline mu-tation rate heterogeneity in humans. bioRxiv. Available at:
http://www.biorxiv.org/content/early/2017/02/14/108290. de Ligt, J., M. H. Willemsen, B. W. M. van Bon, T. Kleefstra, H. G.
De Rubeis, S., X. He, A. P. Goldberg, C. S. Poultney, K. Samocha et al., 2014 Synaptic, transcriptional and chromatin genes dis-rupted in Autism. Nature 515: 209–215.
Duret, L., and N. Galtier, 2009 Biased gene conversion and the evolution of mammalian genomic landscapes. Annu. Rev. Geno-mics Hum. Genet. 10: 285–311.
Epi4K ConsortiumEpilepsy Phenome/Genome ProjectAllen, A. S., S. F. Berkovic, P. Cossette et al., 2013 De novo mutations in epileptic encephalopathies. Nature 501: 217–221.
Francioli, L. C., P. P. Polak, A. Koren, A. Menelaou, S. Chunet al., 2015 Genome-wide patterns and properties ofde novo muta-tions in humans. Nat. Genet. 47: 822–826.
Gao, Z., M. J. Wyman, G. Sella, and M. Przeworski, 2016 Interpreting the dependence of mutation rates on age and time. PLoS Biol. 14: e1002355.
Goldmann, J. M., W. S. Wong, M. Pinelli, T. Farrah, D. Bodianet al., 2016 Parent-of-origin-specific signatures ofde novomutations. Nat. Genet. 48: 935–939.
Green, P., B. Ewing, W. Miller, P. J. Thomas NISC Comparative Se-quencing ProgramE. D. Green, 2003 Transcription-associated mutational asymmetry in mammalian evolution. Nat. Genet. 33: 514–517.
Greenman, C., P. Stephens, R. Smith, G. L. Dalgliesh, C. Hunter et al., 2007 Patterns of somatic mutation in human cancer genomes. Nature 446: 153–158.
Hamdan, F. F., M. Srour, J.-M. Capo-Chichi, H. Daoud, C. Nassif et al., 2014 De novomutations in moderate or severe intellec-tual disability. PLoS Genet. 10: e1004772.
Hanawalt, P. C., and G. Spivak, 2008 Transcription-coupled DNA repair: two decades of progress and surprises. Nat. Rev. Mol. Cell Biol. 9: 958–970.
Harland, C., C. Charlier, L. Karim, N. Cambisano, M. Deckerset al., 2016 Frequency of mosaicism points towards mutation-prone early cleavage cell divisions. bioRxiv. Available at:http://www. biorxiv.org/content/early/2017/06/29/079863.
Hodgkinson, A., and A. Eyre-Walker, 2011 Variation in the mutation rate across mammalian genomes. Nat. Rev. Genet. 12: 756–766. Hodgkinson, A., Y. Chen, and A. Eyre-Walker, 2012 The
large-scale distribution of somatic mutations in cancer genomes. Hum. Mutat. 33: 136–143.
Homsy, J., S. Zaidi, Y. Shen, J. S. Ware, K. E. Samocha et al., 2015 De novo mutations in congenital heart disease with neu-rodevelopmental and other congenital anomalies. Science 350: 1262–1266.
Hwang, D. G., and P. Green, 2004 Bayesian Markov chain Monte Carlo sequence analysis reveals varying neutral substitution pat-terns in mammalian evolution. Proc. Natl. Acad. Sci. USA 101: 13994–14001.
Iossifov, I., B. J. O’Roak, S. J. Sanders, M. Ronemus, N. Krumm et al., 2014 The contribution ofde novocoding mutations to autism spectrum disorder. Nature 515: 216–221.
Jinks-Robertson, S., and A. S. Bhagwat, 2014
Transcription-associated mutagenesis. Annu. Rev. Genet. 48: 341–359. Kong, A., M. L. Frigge, G. Masson, S. Besenbacher, P. Sulemet al.,
2012 Rate ofde novomutations and the importance of father’s age to disease risk. Nature 488: 471–475.
Koren, A., P. Polak, J. Nemesh, J. J. Michaelson, J. Sebat et al., 2012 Differential relationship of DNA replication timing to different forms of human mutation and variation. Am. J. Hum. Genet. 91: 1033–1040.
Larsson, T. P., C. G. Murray, T. Hill, R. Fredriksson, and H. B.
Schiöth, 2005 Comparison of the current RefSeq, Ensembl
and EST databases for counting genes and gene discovery. FEBS Lett. 579: 690–698.
Lawrence, M. S., P. Stojanov, P. Polak, G. V. Kryukov, K. Cibulskis et al., 2013 Mutational heterogeneity in cancer and the search for new cancer-associated genes. Nature 499: 214–218.
Lee, W., Z. Jiang, J. Liu, P. M. Haverty, Y. Guanet al., 2010 The mutation spectrum revealed by paired genome sequences from a lung cancer patient. Nature 465: 473–477.
Lindsay, S. J., R. Rahbari, J. Kaplanis, T. Keane, and M. Hurles, 2016 Striking differences in patterns of germline mutation between mice and humans. bioRxiv. Available at:http://www. biorxiv.org/content/early/2016/10/20/082297.
Lodato, M. A., M. B. Woodworth, S. Lee, G. D. Evrony, B. K. Mehta et al., 2015 Somatic mutation in single human neurons tracks developmental and transcriptional history. 350: 94–98. Lynch, M., 2010 Rate, molecular spectrum, and consequences of
human mutation. Proc. Natl. Acad. Sci. USA 107: 961–968. Marteijn, J. A., H. Lans, W. Vermeulen, and J. H. J. Hoeijmakers,
2014 Understanding nucleotide excision repair and its roles in cancer and ageing. Nat. Rev. Mol. Cell Biol. 15: 465–481. Martincorena, I., A. Roshan, M. Gerstung, P. Ellis, P. Van Loo, S.
McLaren et al., 2015 High burden and pervasive positive se-lection of somatic mutations in normal human skin. 348: 880– 886.
McVicker, G., and P. Green, 2010 Genomic signatures of germline gene expression. Genome Res. 20: 1503–1511.
McVicker, G., D. Gordon, C. Davis, and P. Green, 2009 Widespread genomic signatures of natural selection in hominid evolution. PLoS Genet. 5: e1000471.
Michaelson, J. J., Y. Shi, M. Gujral, H. Zheng, D. Malhotraet al., 2012 Whole-genome sequencing in autism identifies hot spots for de novo germline mutation. Cell 151: 1431–1442.
Moorjani, P., Z. Gao, and M. Przeworski, 2016 Human germline mutation and the erratic evolutionary clock. PLoS Biol. 14: e2000744.
Muller, H. J., 1927 Artificial transmutation of the gene. Science 66: 84–87.
Nouspikel, T., 2007 DNA repair in differentiated cells: some new answers to old questions. Neuroscience 145: 1213–1221. Nouspikel, T., 2009 DNA repair in mammalian cells. Cell. Mol.
Life Sci. 66: 994–1009.
Nouspikel, T., and P. C. Hanawalt, 2000 Terminally differentiated human neurons repair transcribed genes but display attenuated global DNA repair and modulation of repair gene expression. Mol. Cell. Biol. 20: 1562–1570.
Park, C., W. Qian, and J. Zhang, 2012 Genomic evidence for el-evated mutation rates in highly expressed genes. EMBO Rep. 13: 1123–1129.
Petruska, J., and M. F. Goodman, 1985 Influence of neighboring bases on DNA polymerase insertion and proofreading fidelity. J. Biol. Chem. 260: 7533–7539.
Pleasance, E. D., R. K. Cheetham, P. J. Stephens, D. J. McBride, S. J. Humphrayet al., 2010a A comprehensive catalogue of somatic mutations from a human cancer genome. Nature 463: 191–196. Pleasance, E. D., P. J. Stephens, S. O’Meara, D. J. McBride, A. Meynertet al., 2010b A small-cell lung cancer genome with complex signatures of tobacco exposure. Nature 463: 184–190. Polak, P., and P. F. Arndt, 2008 Transcription induces strand-specific mutations at the 59end of human genes. Genome Res. 18: 1216–1223.
Polak, P., R. Karli´c, A. Koren, R. Thurman, R. Sandstrom et al., 2015 Cell-of-origin chromatin organization shapes the muta-tional landscape of cancer. Nature 518: 360–364.
Rahbari, R., A. Wuster, S. Lindsay, R. Hardwick, L. Alexandrovet al., 2016 Timing, rates and spectra of human germline mutation. Nat. Genet. 48: 126–133.
Rauch, A., D. Wieczorek, E. Graf, T. Wieland, S. Endele et al.,
2012 Range of genetic mutations associated with severe
non-syndromic sporadic intellectual disability: an exome se-quencing study. Lancet 380: 1674–1682.
Samocha, K. E., E. B. Robinson, S. J. Sanders, C. Stevens, A. Sabo et al., 2014 A framework for the interpretation of de novo mutation in human disease. Nat. Genet. 46: 944–950. Schuster-Böckler, B., and B. Lehner, 2012 Chromatin organization
is a major influence on regional mutation rates in human cancer cells. Nature 488: 504–507.
Ségurel, L., M. J. Wyman, and M. Przeworski, 2014 Determinants of mutation rate variation in the human germline. Annu. Rev. Genomics Hum. Genet. 15: 47–70.
Shendure, J., and J. M. Akey, 2015 The origins, determinants, and consequences of human mutations. Science 349: 1478–1483. Stamatoyannopoulos, J. A., I. Adzhubei, R. E. Thurman, G. V. Kryukov,
S. M. Mirkinet al., 2009 Human mutation rate associated with DNA replication timing. Nat. Genet. 41: 393–395.
Stratton, M. R., 2011 Exploring the genomes of cancer cells: prog-ress and promise. Science 331: 1553–1558.
Stratton, M. R., P. J. Campbell, and P. A. Futreal, 2009 The cancer genome. Nature 458: 719–724.
Supek, F., and B. Lehner, 2015 Differential DNA mismatch repair underlies mutation rate variation across the human genome. Nature 521: 81–84.
Takai, D., and P. A. Jones, 2002 Comprehensive analysis of CpG islands in human chromosomes 21 and 22. Proc. Natl. Acad. Sci. USA 99: 3740–3745.
The Deciphering Developmental Disorders Study, 2015
Large-scale discovery of novel genetic causes of developmental disor-ders. Nature 519: 223–228.
Webster, M. T., N. G. C. Smith, M. J. Lercher, and H. Ellegren, 2004 Gene expression, synteny, and local similarity in human noncoding mutation rates. Mol. Biol. Evol. 21: 1820–1830.
Zhao, S., and B. Zhang, 2015 A comprehensive evaluation of
Ensembl, RefSeq, and UCSC annotations in the context of
RNA-seq read mapping and gene quantification. BMC
Geno-mics 16: 97.