GENETICS | INVESTIGATION
Directional
Trans
-Synaptic Labeling of Speci
fi
c
Neuronal Connections in Live Animals
Muriel Desbois,* Steven J. Cook,†Scott W. Emmons,*,†and Hannes E. Bülow*,†,1 *Department of Genetics and†Dominick P. Purpura Department of Neuroscience, Albert Einstein College of Medicine, Bronx, New York 10461 ORCID ID: 0000-0002-6271-0572 (H.E.B.)
ABSTRACT Understanding animal behavior and development requires visualization and analysis of their synaptic connectivity, but existing methods are laborious or may not depend ontrans-synaptic interactions. Here we describe a transgenic approach forin vivo
labeling of specific connections inCaenorhabditis elegans, which we term iBLINC. The method is based on BLINC (BiotinLabeling of
INtercellularContacts) and involvestrans-synaptic enzymatic transfer of biotin by theEscherichia colibiotin ligase BirA onto an acceptor peptide. A BirA fusion with the presynaptic cell adhesion molecule NRX-1/neurexin is expressed presynaptically, whereas a fusion between the acceptor peptide and the postsynaptic proteinNLG-1/neuroligin is expressed postsynaptically. The biotinylated acceptor peptide::NLG-1/neuroligin fusion is detected by a monomeric streptavidin::fluorescent protein fusion transgenically secreted into the extracellular space. Physical contact between neurons is insufficient to create afluorescent signal, suggesting that synapse formation is required. The labeling approach appears to capture the directionality of synaptic connections, and quantitative analyses of synapse patterns display excellent concordance with electron micrograph reconstructions. Experiments using photoconvertible fluorescent proteins suggest that the method can be utilized for studies of protein dynamics at the synapse. Applying this technique, we find connectivity patterns of defined connections to vary across a population of wild-type animals. In aging animals, specific segments of synaptic connections are more susceptible to decline than others, consistent with dedicated mechanisms of synaptic maintenance. Collectively, we have developed an enzyme-based, trans-synaptic labeling method that allows high-resolution analyses of synaptic connectivity as well as protein dynamics at specific synapses of live animals.
KEYWORDSbiotin; circuit; connectome; labeling; synapse
U
NDERSTANDING animal behavior requires the deter-mination and analysis of their precise neural connectivity,i.e., their connectome. Historically, this has been accom-plished through reconstruction of serial sections of electron micrographs (White et al. 1986; Jarrell et al. 2012). Pio-neered in the nematode Caenorhabditis elegans with its
de-fined and invariant nervous system, partial circuits from
Drosophilaand the mouse retina have now also been recon-structed (Helmstaedter et al. 2013; Takemuraet al. 2013). However, both the experimental effort and the static nature of the connectome at the time of analysis render investigations
into the variability of synaptic connections between individu-als, during development, or in different genotypes laborious at best. Live-imaging techniques to visualize synaptic connectiv-ity have been developed such as GFP Reconstitution Across Synaptic Partners (GRASP) in C. elegansand, more recently, Synaptic Tagging with Recombination (STaR) in flies (Fein-berget al.2008; Chenet al.2014). GRASP takes advantage of the strong molecular interaction between split greenfl uores-cence protein segments to create afluorescent bridge across the synaptic cleft (Feinberget al.2008). However, thetrans -synaptic interaction is strong and may not be reversible (Chen
et al. 2014), thus precluding dynamic studies. STaR, on the other hand, relies on colocalization of pre- and postsynaptic labels without a directtrans-synaptic interaction (Chenet al.
2014).
To develop a methodology that involves a trans-synaptic enzymatic reaction, we adaptedBiotinLabeling ofINtercellular
Contacts (BLINC), a technique established in cell culture (Liu
Copyright © 2015 by the Genetics Society of America doi: 10.1534/genetics.115.177006
Manuscript received April 1, 2015; accepted for publication April 24, 2015; published Early Online April 27, 2015.
Supporting information is available online at www.genetics.org/lookup/suppl/ doi:10.1534/genetics.115.177006/-/DC1.
1Corresponding author: Albert Einstein College of Medicine, 1300 Morris Park Ave.,
Ullmann Bldg., Rm. 807, Bronx, NY 10461. E-mail: [email protected]
et al.2013) and developed it for transgenic use inC. elegans. BLINC is based on enzymatic transfer of biotin onto a 15-amino-acid peptide (the acceptor peptide, or AP) by the
Escherichia coli biotin ligase BirA (Figure 1A) (Liu et al.
2013). Thein vivoBLINC method, which we term iBLINC, seems to capture the directionality of synaptic connections and permits the quantification of synaptic patterns in a pop-ulation of animals. Based on the observed patterns we con-clude that connectivity patterns between two given neurons may be variable between individual animals, whereas the overall strength of the connection remained relatively con-stant. Our experiments show excellent correlation with known electron microscopic studies both in anunc-104/ kinesin mutant background and during aging. Thus, iBLINC is a useful tool for high-resolution studies of specific synaptic connections in liveC. elegansand possibly other organisms.
Materials and Methods
Strains
Worms were cultured as previously described (Brenner 1974). For a complete strain list, seeSupporting Information.
Molecular biology
The sequence of monomeric streptavidin (mStrep) (Limet al.
2011) was codon-optimized forC. elegansand synthesizedde novo by Genscript. Subsequently, mStrep was cloned PmlI/ AgeI into Punc-122::HS4C3::tagRFP (Attreed et al. 2012) to encode a fusion protein where streptavidin is N-terminally fused in frame to theSEL-1signal sequence and C-terminally to tagRFP (Supporting Information, Figure S1A and Figure S2). The BirA::NRX-1/neurexin fusion was created in several steps. First, theE. colibiotin ligase (BirA) was PCR-amplified fromceh-36prom2::NLS-myc-BirAo::unc-54-39UTR(kind gift of B. Tursun and O. Hobert) and fused in frame by PCR to part of theNLG-1/neuroligin complementary DNA (cDNA) amplified from a GRASP plasmid (Psrh-128::nlg-1::spGFP11, kind gift of M. vanHoven). Second, this PCR fusion was cloned in frame intoPsrh-128::nlg-1::spGFP11to yield a BirA::NLG-1/neuroligin fusion. Third, theNLG-1/neuroligin sequence was replaced by the NRX-1/neurexin coding sequence, which was amplified from a N2 cDNA library with custom primers. Finally, the
Psrh-128promoter was replaced by other promoters as neces-sary. This construct encodes a predicted protein with a heter-ologous PAT-3 b-integrin signal sequence, followed by BirA fused N-terminally to NRX-1/neurexin lacking its endoge-nous signal peptide (Figure S1A andFigure S2). Similarly, AP was PCR-amplified from pBALU-NtermAVI 2.0 (kind gift of B. Tursun and O. Hobert) and fused by PCR to a part of the NLG-1/neuroligin cDNA amplified from a GRASP plasmid (Psrh-128::
nlg-1::spGFP11, kind gift of M. vanHoven). This PCR fusion was cloned in frame into Psrh-128::nlg-1::spGFP11 to yield a AP:: NLG-1/neuroligin fusion, and, finally, the Psrh-128 promoter was replaced as required. This construct encodes a predicted protein with a heterologousPAT-3b-integrin signal sequence, followed by two 15-amino-acid AP peptides fused N-terminally
toNLG-1/neuroligin lacking its endogenous signal peptide ( Fig-ure S1A andFigure S2). All amplified sequences were verified by sequencing. For further details, seeSupporting Information.
Fluorometric and microscopic analyses
For epifluorescence microscopy, young adult animals were anesthetized with 5 mM levamisole or 0.3 mM 2,3-butane-dione monoxime (BDM) + 4 mM levamisole and analyzed on an AxioImager Z1 compound microscope (Zeiss); the signal is not visible under a dissecting microscope equipped for epifluorescence, at least not with the synaptic connections tested. In all images, the iBLINC signal was visualized using an exposure time of 1000 ms at3630 magnification. The cyto-plasmic markers were visualized with a 10- to 20-ms exposure time at3630 magnification. Animals were optically sectioned using the Zeiss Apotome, and the sections were processed to produce maximum intensity projections in some cases. All images were processed subsequently with the Zeiss proprie-tary Axiovision software and assembled into figures using Adobe Photoshop and Adobe Illustrator.
Time-course analysis
To observe the signal at larval stage 1 (L1), an egg prep was performed and animals were allowed to develop without food over night. To image the signal during larval stages 2–4 (L2-L4), an egg prep was performed and the animals were left developing on a plate containing OP50and staged by gonad morphology. To observe the signal during adulthood, L4 worms were picked and incubated at 20°for 1–15 days. Every 2 days the worms were transferred onto a fresh plate to avoid starvation and to eliminate the progeny. At relevant time points, animals were imaged as describe above.
Analyses of synapses pattern and statistical analyses
To compare the pattern of AFD–AIY synapses, the images of different genotypes were shuffled and blinded for analysis using ImageJ (Schneider et al.2012). The staining patterns were isolated from background, and worms were placed in the same orientation. Individual punctae were circled and posi-tion, fluorescence intensity, and surface area of each puncta extracted. Statistical analysis and plots were generated using R (R Core Team 2013). The average size of punctae was analyzed using an ANOVA test with a Bonferroni correction for pairwise comparisons.
“Pearl chain” graphs were created by arbitrarily placing punctae into four differently sized bins (0–13; 14–18; 19–25; and.25 square pixels). Total synaptic length was defined by measuring the distance between punctae using a triangulation formula and summing the distances. Punctae were then aligned and binned depending on quartiles of synaptic length, thefirst quartile being the most distal part of the process (in relation to the cell body) and the last one being the proximal part of the synaptic length. The number of punctae in each quartile was compared between ages and genotypes by employing a two-way ANOVA test using GraphPad Prism (version 5.04 for Windows, GraphPad Software, www.graphpad.com). The
analysis of 1-, 3-, 6-, or 9-day-old wild-type animals was performed using an integrated transgenic line (dzIs68:Is[Pgcy-8::BirA::nrx-1;
Pttx-3::AP::nlg-1;Punc-122::streptavidin::tagRFP;Pelt-2::GFP]). The analysis ofunc-104(e1265)mutant animals was performed using the parental extrachromosomal linedzEx1240.
Behavioral assays
Worms were grown as described at 20°and assayed at 25° (Tsalik and Hobert 2003). All plates and solutions were equilibrated at 25° before use, and all experiments were performed blindly. Worms of each genotype were picked the day before the assay at the L4 larval stage and placed on a plate withOP50bacteria and incubated over night at 20°. On the day of the assay worms were picked and placed on a plate without food to “clean” worms from adhering food and then used as described below.
Radial locomotion: Ten worms were placed on the assay plate (lacking food), and their positions were marked on the plate at 5, 10, and 15 min. The distances were then mea-sured and multiplet-tests were performed using the Graph-Pad software package.
Thrashing assays: Worms were picked individually and placed in a drop of M9 buffer. The number of thrashes in 1 min were counted and analyzed with a Mann–Whitney test using the GraphPad software package.
Reversal assays: Worms were placed on a fresh plate without food. After 1 min of recovery, the number of rever-sals in 3 min were counted. Every change of movement from forward to backward was considered as a reversal. Statisti-cal analyses were performed using a Mann–Whitney test with the GraphPad software package.
Body bends: Worms were placed on a fresh plate without food, and the number of body bends per 20 sec were counted. Statistical analyses were performed using a Mann– Whitney test with the GraphPad software package.
Volumetric reconstruction of the C. elegans nervous system
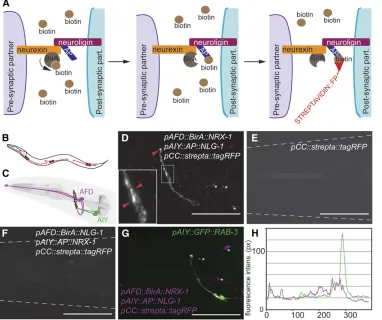
Digitized serial-section transmission electron micrographs of an L4 animal (JSH series) and an3-day-old adult hermaphro-dite (N2U) were aligned manually, segmented, and rendered Figure 1 Trans-synaptic labeling of specific synapses in live animals. (A) Schematic of the iBLINC system. The biotin ligase (BirA) fused with neu-rexin biotinylates the acceptor pep-tide AP::neuroligin fusion, using biotin present in the extracellular space The ligated biotin is detected using a monomeric streptavidin fused to tagRFP and secreted from the coelomocytes (B). (B) Schematic of a worm showing the coelomo-cytes secreting a monomeric strep-tavidin–fluorescent protein fusion (detector). (C) Schematic of AFD and AIY neurons. Synapses are in-dicated as black dots. Adapted from the Virtual Worm Project (http:// caltech.wormbase.org/virtualworm/). (D–F) Epifluorescent micrographs of the head region of transgenic ani-mals expressing the presynaptic BirA fusion in AFD (using the Pgcy-8 promoter), the postsynaptic AP fusion in AIY (using thePttx-3 pro-moter), and the streptavidin detec-tor fusion from the coelomocytes (Punc-122promoter) (D), the strep-tavidin detector fusion alone (E), or the pre- and postsynaptic proteins in reversed order (F). Note that expressing the fusions from F cor-rectly on the pre- and postsynaptic side, respectively, resulted in signal (Figure S3D). Some vesicular staining is usually seen in the postsynaptic cell body (not shown), which can be useful for cell identification. Arrowheads indicate labeling between AFD and AIY neurons in D and a dashed line the outline of the animals in E and F. In all micrograph panels, punctae marked by an asterisk are considered background staining as they are not seen consistently in different animals. Bars, 20
mm. Anterior is to the left. (G) Epifluorescent micrograph showing postsynaptic sites of AIY in magenta (iBLINC) and presynaptic sites in green [wyIs45
(Is[pAIY::GFP::RAB-3])]. (H) Colocalization of post- and presynaptic sites in AIY was measured by a line scan and show by and large mutually exclusive staining. One hundred percent of animals showed immediately juxtaposed pre- and postsynaptic sites in AIY neurons (n= 14).
using TrakEM2 (Whiteet al.1986; Cardonaet al.2012). Syn-aptic connectivity between neurons was annotated by counting the number of consecutive serial sections containing a presyn-aptic density using Elegance (Xuet al.2013).
Photo-conversion experiments
For photo-conversion experiments, young adult animals were anesthetized using 0.15 mM BDM + 4 mM levamisole and analyzed on an AxioImager Z1 compound microscope (Zeiss). The slide was sealed using Vaseline petroleum jelly. Images were takenfirst in the red channel (591–652 nm) at 400-ms exposure time and gain 34 and then in the green channel (500–550 nm) at 400-ms exposure time and gain 34 to avoid photo-conversion by the blue light. Then the worm was exposed for 30 sec to blue light using a DAPIfilter (365 nm). A postphotoactivation image series was taken using the same exposure times. The worm was left on the slide for 1 hr at room temperature. Finally, the recovery images were taken using the same parameters.
Results
To develop BLINC for transgenic use inC. elegans, we modified GRASP constructs, which had previously been shown to be correctly trafficked to the cell surface (Feinberget al. 2008). The resulting presynaptic BLINC construct encoded a protein in which the signal sequence of the presynaptic cell adhesion pro-tein NRX-1/neurexin was replaced by the heterologous signal sequence ofPAT-3b-integrin followed by theE. colibiotin ligase BirA (Figure 1A,Figure S1,Figure S2). Similarly, the N terminus of the postsynaptic cell adhesion molecule NLG-1/neuroligin was modified such that the endogenous signal peptide was replaced by thePAT-3b-integrin signal sequence followed by two copies of the 15-amino-acid AP (Figure 1A, Figure S1, Figure S2).NLG-1/neuroligin is a postsynaptic partner of neu-rexin (reviewed by Craig and Kang 2007). ANLG-1/neuroligin reporter shows expression in a subset of cells in the nervous system ofC. elegans, including several motor neurons and inter-neurons such as the AIY interinter-neurons (Hunteret al.2010). In contrast, widespread expression in the nervous system is seen with a NRX-1/neurexin reporter (Haklai-Topper et al. 2011). We predicted that, in analogy to experiments in cell culture, transgenic pre- and postsynaptic expression of the two fusion proteins would result in enzymatic biotinylation of the AP on NLG-1/neuroligin across the synaptic cleft. To detect the bio-tinylated AP::NLG-1/neuroligin fusion in vivo, we designed a monomeric streptavidin::tagRFP“detector”that we transgeni-cally secreted into the extracellular space ofC. elegansfrom six scavenger cells termed coelomocytes (Figure 1, A and B;Figure S1A). We term this technique iBLINC, forin vivoBLINC.
Labeling of AFD–AIY synapses by iBLINC
To test the technique, we focused on part of the thermo-sensory circuit in the head of C. elegans, consisting of the bilateral pairs of AFD sensory neurons and AIY interneurons (Moriet al.2007). The AFD neurons are localized laterally in the head of the animals whereas the AIY interneurons are
localized in the ventral ganglion (Figure 1C). On both sides of the animal, the neurites of AIY and AFD run alongside each other in the ventral ganglion and nerve ring, the major neuropil of the nematode, where they form multipleen pas-santsynapses (Figure 1C and Figure 2A) (Whiteet al.1986). We expressed the BirA::NRX-1/neurexin and the AP::NLG-1/neuroligin fusions presynaptically in AFD and postsynap-tically in AIY neurons, respectively, using specific promoters. When the streptavidin detector was secreted from the coe-lomocytes at the same time, we observed punctate signals in the head (14/14 transgenic lines;n= 10–30 per line) (Fig-ure 1D and Figure S1B). In addition, we usually saw vesic-ular staining in the cell bodies of the postsynaptic neurons (data not shown), suggesting that (i) the method is indeed “nontrapping” and fails to create a stable bond across the synaptic cleft and (ii) that the streptavidin–biotin–NLG-1/ neuroligin complex is actively turned over. No fluorescent signal was observed in animals expressing the secreted streptavidin detector alone (4/4 transgenic lines; n= 20– 30/line) (Figure 1E), indicating that no endogenous epito-pes are recognized by the streptavidin detector. When the BirA::NRX-1/neurexin or AP::NLG-1/neuroligin fusions, re-spectively, were omitted, no signal was observed (Figure S3, A–C). Thesefindings indicate that there are neither endogenous enzymes that can transfer biotin onto the AP::NLG-1/neuroligin fusion nor endogenous acceptor peptides for BirA present in the extracellular space ofC. elegans. A similar signal was observed when the streptavidin was tagged with a superfolder GFP var-iant in tandem (23sfGFP) or when it was secreted form the intestine instead of the coelomocytes (Figure S3, E–H). Thus, the observed signal is independent of thefluorophore or pro-moter used to drive the streptavidin detector.
The punctate signal was juxtaposed with cytoplasmic
fluorescent markers of both AIY and AFD neurons (Figure S4, A and B). It was adjacent to, but largely nonoverlapping with, a marker for presynaptic specializations in AIY interneur-ons cinterneur-onsistent with the expectation that pre- and postsynaptic sites in AIY neurons are adjacent but nonoverlapping (Figure 1, G and H). This indicated that the signal is localized to, and probably labeled the connection between, AFD and AIY neu-rons. Finally, the observedfluorescent signal correlated with a volumetric reconstruction of the AIY and AFD neurons of an electron micrograph series of a L4 larval stage animal (Figure 2A andFigure S5).
To test whether the signal is dependent on the correct localization of pre- and postsynaptic proteins, we expressed a BirA::NLG-1/neuroligin fusion, i.e., the postsynaptic protein, presynaptically in AFD, and the AP::NRX-1/neurexin presynap-tic protein postsynappresynap-tically in AIY. We found no signal in these transgenic lines (0/19 lines;n= 3–15/line) (Figure 1F), sug-gesting that iBLINC can capture the directionality of synaptic connections. Finally, we compared iBLINC with GRASP using the same connection between the presynaptic AFD sensory neu-rons and AIY interneuneu-rons. We found iBLINC to result in similar labeling of synapses when compared to an analogous GRASP signal (Figure S1, B–D).
We next asked whether visualizing the synaptic connections between AFD and AIY compromises the functionality of the connection. Several behavioral paradigms of locomotion have previously been shown to require AIY function. For example, mutants in the homeobox transcription factor ttx-3, which is required for terminal differentiation of AIY interneurons (Altun-Gultekinet al.2001), show temperature-dependent lo-comotion defects (Tsalik and Hobert 2003). We performed the same tests, including a thrashing assay, a reversal assay, a body bend assay, and a radial locomotion assay with ttx-3mutant animals serving as a positive control andN2wild-type animals and nontransgenic siblings of the transgenic iBLINC line (dzEx1240) as negative controls. Transgenic animals express-ing iBLINC did not show obvious differences in these assays compared to wild-type animals or their nontransgenic siblings (Figure S6). Collectively, these results suggest that iBLINC
trans-synaptically labels connections from AFD sensory neu-rons to AIY interneuneu-rons without interfering with function.
iBLINC depends on the formation of a synapse
We next asked whether physical contact between two neurons was sufficient to allow formation of an iBLINC signal or
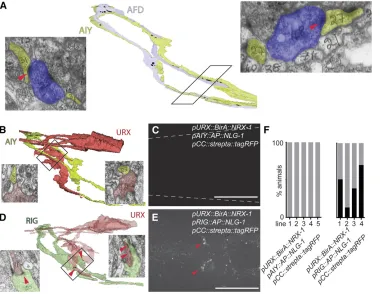
whether formation of synapses was required. To this end, we sought to identify a neuron that is in cellular contact with AIY neurons, but fails to establish synaptic connections. Volumetric reconstruction of the original electron micrograph series from White et al.(1986) identified the neurites of the pair of URX sensory neurons to run along the neurites of AIY interneurons without forming synapses (Figure 2B). Using green and red
fluorescent cytoplasmic markers of AIY and URX, respectively, we confirmed that the neurites of both pairs of neurons ap-peared immediately adjacent in 89% of the animals (n= 28) (Figure S4, D and E). Expression of the BirA::NRX-1/neurexin presynaptic fusion in URX with the postsynaptic AP::NLG-1/ neuroligin in AIY failed to result in any signal (0/5 transgenic lines;n= 15–48) (Figure 2, B, C, and F). In contrast, expres-sion of the BirA::NRX-1/neurexin presynaptic fuexpres-sion in URX and the AP::NLG-1/neuroligin in RIG interneurons, bonafide
postsynaptic partners of URX sensory neurons (Figure 2D) (Whiteet al.1986), resulted in specific labeling (4/4 transgenic lines;n= 22–51) (Figure 2, E and F). These results are con-sistent with the conclusion that the iBLINC signal requires the presence of synapses and that cellular contact alone is insuffi -cient to bring the NRX-1/neurexin and NLG-1/neuroligin Figure 2 iBLINC is dependent on the formation of synapses. (A) Vol-umetric reconstruction of AFD sen-sory (shaded in light blue) and AIY interneurons (shaded in yellow) us-ing the JSH electron micrograph se-ries of an L4 larval stage animal. Electron micrograph section from the positions shows cellular contact with presynaptic specializations (red arrowheads). Synapses visible on the micrographs are reported as black punctae in the volumetric re-construction. (B) Volumetric recon-struction of URX sensory (shaded in red) and AIY interneurons (shaded in yellow) using the JSH electron mi-crograph series of an L4 larval stage animal. Electron micrograph section from the boxed area shows cellular contact but no presynaptic special-izations. Both URX and AIY were also seen to run along each other using cell-specific cytoplasmicfl uo-rescent markers (Figure S4, D and E). (C) Epifluorescent micrographs of the head region of transgenic animals expressing the presynaptic BirA fusion in URX and the postsyn-aptic AP fusion in AIY. Dashed lines indicate the outline of the animal. (D) Volumetric reconstruction of URX sensory (shaded in red) and RIG interneurons (shaded in green) using the JSH electron micrograph series of an L4 larval stage animal; presynaptic densities observed between URX and RIG are represented in black (red arrowheads). Electron micrograph sections from the boxed area show cellular contact with presynaptic specializations in URX. (E) Epifluorescent micrographs of a ventral view of the head region of a transgenic animal expressing the presynaptic BirA fusion in URX (using thePgcy-32promoter) and the postsynaptic AP fusion in RIG (using thatPflp-18promoter) together with the streptavidin detector. Specific signal is visible only between URX and RIG neurons (arrowheads) but not between URX and AIY (E) and likely corresponds to the connections boxed and shown in representative micrographs in D. Note that the Pflp-18promoter is also expressed in AVA command interneurons (Rogerset al.2003), which may be weak postsynaptic partners of URX (Whiteet al.1986). (F) Quantification of animals that displayfluorescent signal. Different transgenic lines are shown in each case (n= 19–51).
components of the system into sufficient physical proximity for interaction.
iBLINC punctae correspond to synapses
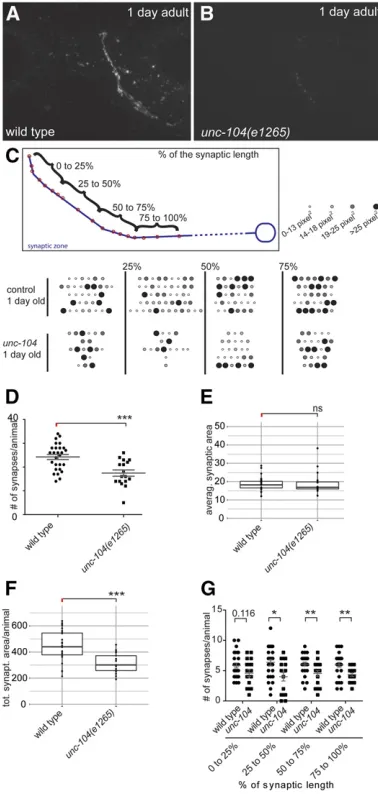
To determine whether the punctae that we observe are synapses, we determined the number of punctae seen by iBLINC to compare them with the number of presynaptic densities seen in electron microscopic reconstructions. To that end, we circled and quantified the punctae in maximum-intensity projections of iBLINC patterns on either the right or the left side of transgenic iBLINC animals (Figure 3C and Figure S5) and arrayed them in order, thereby creating pearl chain graphs for each animal (Figure 3C). We found the number of iBLINC punctae to be in accordance with the number of presynaptic densities observed in electron micro-scopic reconstructions at two different ages, the L4 stage and older adult (Figure S5). We next determined and com-pared the number, average size, and total area of iBLINC punctae in wild-type animals and in a mutant of the KIF1A kinesin homolog UNC-104, previously shown by electron microscopy to contain fewer synapses with fewer synaptic vesicles (Hall and Hedgecock 1991). As in electron micro-scopic studies, we found a reduced overall number of punctae/ synapses between AFD and AIY inunc-104mutant animals [17.561.3 SEM (n= 17) per side] compared to wild-type animals of the same age [24.361.1 SEM (n= 27)] (Figure 3D). Consistent with an unchanged average synaptic size, we observed a decreased total synaptic area, suggesting a weaker connection between both neurons (Figure 3, E and F). To obtain insight into the spatial distribution of punctae, we arbitrarily divided the length of the synaptic connections formeden passantinto four equal bins/quartiles (Figure 3C). Surprisingly, we found the area proximal to the cell body to be possibly more affected than the distal portion of the synaptic zone, suggesting that UNC-104 may serve functions other than in anterograde transport (Figure 3G). Taken together, these findings suggest that the punctae in iBLINC correspond to one or a small number of synapses.
Age-dependent changes of synapse number and size in the AFD–AIY connection
The iBLINC signal between AFD and AIY interneurons was visible as early as the first larval stage and throughout life until at least 15-day-old adult worms (Figure 4, A–C). To determine the patterning of synapses between animals and over time, we created binned pearl chain graphs at different ages from L4 larval animals to 9-day-old adults. These anal-yses revealed no obvious regularity of punctae between ani-mals at the L4 larval stage or as 1-, 3-, 6- or 9-day-old adults (Figure 4D). We next quantified the number and size of synapses at different ages. At the L4 larval stage we found an average of 18.4 60.8 SEM (n= 16) punctae/synapses per side of the animal, which increased to 24.861.6 SEM (n= 16) punctae in 1-day-old adults with no obvious bias for the left or right side of the animal [left: 24.561.7 SEM (n= 13); right: 24.061.3 (n= 14)] (Figure 4E).
Consis-tent with a higher number and an unchanged average size of synapses, the total synaptic area increased during early adult-hood (Figure 4, F–H). However, from 1-day-old animals on-ward, the number of synapses decreased significantly and stabilized at 17.4 6 1.9 (n = 11), 18.1 6 1.4 (n = 14), and 16.0 6 1.6 (n = 7) synapses in 3-, 6-, and 9-day-old Figure 3 iBLINC labeling in live animals of different genotypes. (A and B) Epifluorescent micrographs of a 1-day-old wild type (A) or 1-day-oldunc-104 (e1265)mutant animals (B). Anterior is to the left in all micrograph panels. (C) Pearl chain graphs illustrating the sequential pattern of synapses. Each row is an individual animal. Synapses were quantified and placed into four differently sized bins based onfluorescent area as indicated by different sizes and shades. Four different synaptic areas were defined as shown in the schematic. The total synaptic length was defined by the distance between thefirst and last puncta and then split into four equally sized areas. (D–G) Quantification of synapse patterns in the genotypes indicated. Shown are the number of synapses per animal (D) and box plots of the average synaptic area per animal (E), the total synaptic area per animal (F), and the number of synapses per animal in the different synaptic sections (as defined in panel C of thisfigure) (G). In E and F, each dot represents the mean of one animal (with the mean of means in-dicated by a line), and the box shows the 25th and 75th percentile, respectively. Statistical significance is indicated explicitly or as the follows: ns, not significant; *P,0.05;**P,0.005;***P,0.0005. Size units are square pixels.
adults, respectively (Figure 4F). This occurred primarily due to loss of smaller synapses (Figure S7). Consistent with this observation, the average synapse size significantly increased in 3-day-old adults and, with less statistical certainty, in 6- and 9-day-old adults (Figure 4G). On the other hand, the total synaptic area remained constant with a trend for decreasing total area in aging animals, in line with electron microscopic studies (Toth et al. 2012) (Figure 4H). These
results suggest an expansion of connectivity during early adulthood, followed by a consolidation phase and eventual decline.
Finally, we wanted to explore whether specific areas of the synaptic connection behaved differently. To this end, we quantified the number of synapses in each bin/quartile. We observed dynamic changes in some areas of the connection, whereas others remained relatively unaffected over time Figure 4 iBLINC labeling in live ani-mals during aging. (A–C) Epifl uores-cent micrographs of animals at an early larval stage (L1) and 1- and 15-day-old adults. Anterior is to the left in all micrograph panels. (D) Pearl chain graphs illustrating the sequential patterns of synapses of worms at different stages: L4 (larval stage), 1-, 3-, 6-, and 9- days- old. Each row represents an individual animal. Synapses were quantified and placed into four different bins based on four different synaptic sec-tions as defined in the schematic (Figure 3C). Total synaptic length was defined by the distance be-tween thefirst and last puncta and then split into four equally sized sec-tions. Fluorescent area of punctae is indicated by different sizes and shades. (E) Quantification of the number of synapses per 1-day-old adult animals on the left and right side, respectively. ns, not significant. (F–I) Quantification of synapse pat-terns at the developmental stages indicated. Shown are the number of synapses per animal (F) and box plots of the average synaptic area per animal (G), the total synaptic area per animal (H), and the number of synapses per animal in the differ-ent synaptic sections (as defined in panel Figure 3C)(I). at the indicated ages. In G and H, each dot repre-sents the mean of one animal (with the mean of means indicated by a line), and the box shows the 25th and 75th percentile, respec-tively. Statistical significance is indi-cated explicitly or as the follows: ns, not significant; *P, 0.05; **P ,
0.005; ***P , 0.0005. Size units are square pixels.
(Figure 4I). These findings are consistent with the notion that dedicated maintenance mechanisms exist to ensure ap-propriate conservation of synaptic connections.
iBLINC allows dynamic studies
To explore whether iBLINC could lend itself to dynamic studies at the synapse, we fused the monomeric streptavidin detector to the photoconvertible fluorescent protein den-dra2 (Chudakov et al.2007). The dendra2 protein changes
fluorescent properties upon exposure to blue light from green to red, allowing “chase”experiments in which“old” signal (converted/red) can be distinguished from newly formed signal (green). We find that the dendra2 iBLINC signal can be quantitatively converted into redfluorescence and that within,1 hr a new green iBLINC signal appears (Figure 5). Since the streptavidin–biotin interaction can be considered irreversible, this finding suggests that iBLINC could serve to investigate protein turnover at the postsyn-aptic site of specific synapses under different experimental conditions.
Discussion
We have developed a method for live imaging of specific synaptic connections in C. elegans, which we term iBLINC and which is based on BLINC (BiotinLabeling ofIN tercellu-larContacts) (Liuet al.2013). The method is rapid, simple, specific, and possibly brighter than existing methods, and the observed signals correlate well with electron micro-scopic studies of connectivity inC. elegans. Thus, iBLINC could serve as a useful additional tool to investigate synaptic connectivity and dynamics under different experimental conditions in nematodes and, possibly, other organisms.
Using iBLINC we were able to observe and quantify the variability of the synaptic connection between the AFD and AIY neurons, which are part of the thermosensory circuit of the small nematode C. elegans. The connectivity between these two neurons, at least in regard to size of the synapses, does not seem to follow any obvious pattern across a popu-lation of animals and varies from worm to worm, although the overall strength appears relatively constant. However, the number of synapses seems to be important and changes with age of the animals. For example, we observed an in-creased number of synapses between the last larval stage and 1-day-old adult worms. Our observations suggest a sig-nificant expansion of connectivity during early adulthood, followed by a consolidation phase and eventual decline. Similar observations of decline have also been made in the aging human brain (Bertoni-Freddariet al.1990). It will be interesting to explore the impact of other factors on devel-opment of synaptic patterns, such as life history, environ-mental conditions, or neuronal activity. The observation that the functionality of the synaptic connection does not appear compromised in iBLINC animals could render such studies feasible in the future.
A concern withtrans-synaptic approaches is that the syn-aptic connection that is being visualized is stabilized by the interactions of the transgenes used. Several observations suggest that this may not be the case for iBLINC. First,fl uo-rescent vesicles can be observed in the postsynaptic neuro-nal cell body. This suggests turnover of the fluorescent streptavidin–biotin–AP-NLG-1/neuroligin complex and indi-cates that NRX-1/neurexin–NLG-1/neuroligin interaction may not be stabilizing. Second, the turnover at the postsyn-aptic side seems rapid, as new signal is observed within 60 min after photoconversion of the streptavidin-dendra2 detector. Finally, the signal does not obviously affect func-tionality of the tested connections, suggesting that, even if there were some stabilization, it may not be functionally relevant.
Nematodes could be uniquely suited for the use of iBLINC because of the convenience of coelomocytes as both source and sink of the streptavidin detector. However, even in the absence of these cells in vertebrates (e.g., mice), it seems possible that a secreted version of the streptavidin detector could be used. Alternatively, transgenic mice that only ex-press the pre- and postsynaptic fusions under the control of tissue-specific promoters could be envisioned, but without the streptavidin detector. Such animals could be subjected to staining with fluorescently labeled streptavidin in conjunc-tion with methods such as CLARITY (Chunget al.2013) to visualize global connectivity patterns under different condi-tions. Additionally, double-labeling experiments could be Figure 5 iBLINC may be used for dynamic studies. (A–C) Epifluorescent micrographs of the head region of transgenic animals expressing iBLINC with the detector tagged with a photoconvertible protein, Dendra2. Be-fore photoconversion greenfluorescence is observed in the head while no red is present (A). After a 30-sec exposure to blue light, green is no longer seen in the head while red appears (B). After only 1 hr of recovery, green is observed again. The green and red streptavidin colocalized, showing that new proteins are again at the membrane (C).
imagined using alternativetrans-synaptic techniques devel-oped in cell culture, such as ID-prime where lipoic acid is enzymatically transferred across the synaptic cleft (Liuet al.
2013). In sum, we have developed a transgenic, enzyme-based method (iBLINC) for labeling specific synaptic con-nections in live animals. Using iBLINC, we have been able to analyze synaptic patterns and follow the dynamics of specific connections during development and aging across a population of animals.
Acknowledgments
We thank B. Tursun for the BirA and AVItag; M. vanHoven for GFP Reconstitution Across Synaptic Partners constructs; D. Colón-Ramos for wyIs45; J. White and J. Hodgkin for donating Medical Research Council/Laboratory of Molecular Biology archival electron micrographs, which are under the curation of D. Hall at the Albert Einstein College of Medi-cine; C. Brittin for assisting with electron micrograph anal-ysis; J.-L. Bessereau and M. Pierron for help with analyzing colocalization; E. L. Snapp for the dendra2 plasmid and for assistance with photoconversion experiments; E. Klein for technical assistance; and B. Brugg, D. Hall, and members of the Bülow and Emmons labs for comments on the man-uscript and helpful discussions. This work was supported in part by National Institutes of Health grants 5R01HD055380 and R01GM01313 (to H.E.B.), R01GM066897 (to S.W.E.), and 5T32GM007491 (to S.J.C.) and by a grant from The G. Harold and Leila Y. Mathers Charitable Foundation (to S.W.E.). H.E.B. is an Irma T. Hirschl/Monique Weill-Caulier Research Fellow.
Literature Cited
Altun-Gultekin, Z., Y. Andachi, E. L. Tsalik, D. Pilgrim, Y. Koharaet al., 2001 A regulatory cascade of three homeobox genes, ceh-10, ttx-3 and ceh-2ttx-3, controls cell fate specification of a defined interneu-ron class in C. elegans. Development 128: 1951–1969.
Attreed, M., M. Desbois, T. H. van Kuppevelt, and H. E. Bülow, 2012 Direct visualization of specifically modified extracellular glycans in living animals. Nat. Methods 9: 477–479.
Bertoni-Freddari, C., P. Fattoretti, T. Casoli, W. Meier-Ruge, and J. Ulrich, 1990 Morphological adaptive response of the synaptic junctional zones in the human dentate gyrus during aging and Alzheimer’s disease. Brain Res. 517: 69–75.
Brenner, S., 1974 The genetics ofCaenorhabditis elegans. Genetics 77: 71–94.
Cardona, A., S. Saalfeld, J. Schindelin, I. Arganda-Carreras, S. Preibisch
et al., 2012 TrakEM2 software for neural circuit reconstruction. PLoS ONE 7: e38011.
Chen, Y., O. Akin, A. Nern, C. Y. Tsui, M. Y. Pecotet al., 2014 Cell-type-specific labeling of synapses in vivo through synaptic tag-ging with recombination. Neuron 81: 280–293.
Chudakov, D. M., S. Lukyanov, and K. A. Lukyanov, 2007 Using photoactivatable fluorescent protein Dendra2 to track protein movement. Biotechniques 42: 553, 555, 557 passim.
Chung, K., J. Wallace, S. Y. Kim, S. Kalyanasundaram, A. S. Andalman
et al., 2013 Structural and molecular interrogation of intact biological systems. Nature 497: 332–337.
Craig, A. M., and Y. Kang, 2007 Neurexin-neuroligin signaling in synapse development. Curr. Opin. Neurobiol. 17: 43–52. Feinberg, E. H., M. K. Vanhoven, A. Bendesky, G. Wang, R. D. Fetter
et al., 2008 GFP Reconstitution Across Synaptic Partners (GRASP) defines cell contacts and synapses in living nervous systems. Neuron 57: 353–363.
Haklai-Topper, L., J. Soutschek, H. Sabanay, J. Scheel, O. Hobert
et al., 2011 The neurexin superfamily of Caenorhabditis ele-gans. Gene Expr. Patterns 11: 144–150.
Hall, D. H., and E. M. Hedgecock, 1991 Kinesin-related gene unc-104 is required for axonal transport of synaptic vesicles in C. elegans. Cell 65: 837–847.
Helmstaedter, M., K. L. Briggman, S. C. Turaga, V. Jain, H. S. Seung
et al., 2013 Connectomic reconstruction of the inner plexiform layer in the mouse retina. Nature 500: 168–174.
Hunter, J. W., G. P. Mullen, J. R. McManus, J. M. Heatherly, A. Dukeet al., 2010 Neuroligin-deficient mutants of C. elegans have sensory processing deficits and are hypersensitive to oxidative stress and mercury toxicity. Dis. Model. Mech. 3: 366–376.
Jarrell, T. A., Y. Wang, A. E. Bloniarz, C. A. Brittin, M. Xu et al., 2012 The connectome of a decision-making neural network. Science 337: 437–444.
Lim, K. H., H. Huang, A. Pralle, and S. Park, 2011 Engineered streptavidin monomer and dimer with improved stability and function. Biochemistry 50: 8682–8691.
Liu, D. S., K. H. Loh, S. S. Lam, K. A. White, and A. Y. Ting, 2013 Imaging trans-cellular neurexin-neuroligin interactions by enzymatic probe ligation. PLoS ONE 8: e52823.
Mori, I., H. Sasakura, and A. Kuhara, 2007 Worm thermotaxis: a model system for analyzing thermosensation and neural plas-ticity. Curr. Opin. Neurobiol. 17: 712–719.
Rogers, C., V. Reale, K. Kim, H. Chatwin, C. Li et al., 2003 Inhibition of Caenorhabditis elegans social feeding by FMRFamide-related peptide activation of NPR-1. Nat. Neurosci. 6: 1178–1185.
Schneider, C. A., W. S. Rasband, and K. W. Eliceiri, 2012 NIH Image to ImageJ: 25 years of image analysis. Nat. Methods 9: 671–675. Takemura, S. Y., A. Bharioke, Z. Lu, A. Nern, S. Vitaladevuniet al., 2013 A visual motion detection circuit suggested by Drosoph-ila connectomics. Nature 500: 175–181.
R Core Team, 2013 R: A language and environment for statistical computing. R Foundation for Statistical Computing, Vienna, Austria. ISBN 3-900051-07-0, URLhttp://www.R-project.org/. Toth, M. L., I. Melentijevic, L. Shah, A. Bhatia, K. Lu et al.,
2012 Neurite sprouting and synapse deterioration in the aging Caenorhabditis elegans nervous system. J. Neurosci. 32: 8778– 8790.
Tsalik, E. L., and O. Hobert, 2003 Functional mapping of neurons that control locomotory behavior in Caenorhabditis elegans. J. Neurobiol. 56: 178–197.
White, J. G., E. Southgate, J. N. Thomson, and S. Brenner, 1986 The structure of the nervous system of the nematode Caenorhabditis elegans. Philos. Trans. R. Soc. Lond. B Biol. Sci. 314: 1–340. Xu, M., T. A. Jarrell, Y. Wang, S. J. Cook, D. H. Hall et al.,
2013 Computer assisted assembly of connectomes from elec-tron micrographs: application to Caenorhabditis elegans. PLoS ONE 8: e54050.
Communicating editor: O. Hobert
GENETICS
Supporting Information www.genetics.org/lookup/suppl/doi:10.1534/genetics.115.177006/-/DC1
Directional
Trans
-Synaptic Labeling of Speci
fi
c
Neuronal Connections in Live Animals
Muriel Desbois, Steven J. Cook, Scott W. Emmons, and Hannes E. Bülow
2 SI M. Desbois et al.
Supplemental Material
to
Directional trans-synaptic labeling of specific neuronal connections in live animals
Muriel Desbois1, Steven Cook2, Scott W. Emmons1,2 and Hannes E. Bülow1,2*
1 Department of Genetics and 2 Dominick P. Purpura Department of Neuroscience
Albert Einstein College of Medicine
Bronx, New York, 10461
* corresponding author: Telephone 718 430 3621
Fax 718 430 8778
e-mail: [email protected]
Running title: directional trans-synaptic labeling
5 Figures
M. Desbois et al. 3 SI
File S1
Methods
Strains
Worms were cultured as previously described. The following strains and alleles were used:
N2 Bristol wild-type, oyIs17 [Pgcy-8::GFP] (YU et al. 1997), mgIs18 [Pttx-3::GFP] (OH99)
(ALTUN-GULTEKIN et al. 2001), wyIs45[Pttx-3::rab-3::GFP] (TV392) (COLON-RAMOS et al. 2007),
dzEx1240 [Pgcy-8::BirA::nrx-1; Pttx-3::AP::nlg-1; Punc-122::streptavidin::tagRFP; elt-2::GFP]
(EB2217), dzEx1321 [Pgcy-8::BirA::nrx-1; Pttx-3::AP::nlg-1; Pelt-2::streptavidin::tagRFP;
rol-6(su1006)] (EB2365), dzEx1322 [Pelt-2::streptavidin::tagRFP; rol-6(su1006)] (EB2366),
dzEx1323 [Pgcy-8::BirA::nrx-1; Punc-122::streptavidin::tagRFP; rol-6(su1006)] (EB2367),
dzEx1324 [Pttx-3::AP::nlg-1; Punc-122::streptavidin::tagRFP; rol-6(su1006)] (EB2368), dzIs64
[Punc-122::streptavidin::tagRFP; rol-6(su1006)] (EB2268), dzEx1325
[Pgcy-8:nlg-1::spGFP1-10; Pttx-3::nlg-1::spGFP11; rol-6(su1006)] (EB2369), dzEx1326 [Pgcy-32::mcherry;
Pttx-3::GFP; rol-6(su1006)] (EB2370), dzEx1330 [Pgcy-8::BirA::nrx-1; Pttx-3::AP::nlg-1;
Punc-122::streptavidin::2xsfGFP; rol-6(su1006)] (EB2374), dzIs66 [Punc-122::streptavidin::2xsfGFP;
Pelt-2::GFP] (EB2268), dzEx1327 [Pgcy-8::BirA::nrx-1; Pttx-3::AP::nlg-1;
Punc-122::streptavidin::dendra2; rol-6(su1006)] (EB2371), dzEx1328 [Pgcy-32::BirA::nrx-1;
Pttx-3::AP::nlg-1; Punc-122::streptavidin::tagRFP; rol-6(su1006)] (EB2372), dzEx1329
[Pgcy-32::BirA::nrx-1; Pflp-18::AP::nlg-1; Punc-122::streptavidin::tagRFP; rol-6(su1006)] (EB2373),
dzEx1240 ; oyIs17 (EB2265), dzEx1240; mgIs18 (EB2264), dzEx1240; wyIs45 (EB2266),
dzEx1240; unc-104(e1265) (EB2434).
To create transgenic worms, constructs were injected at 25ng/μl with pRF4 (rol-6(su1006))
as a dominant injection marker or a gut fluorescent marker (Pelt-2::GFP). Several transgenic
lines giving comparable results were obtained for each construct.
4 SI M. Desbois et al.
standard procedures. Details for genotyping are available on request.
Molecular biology
The acceptor peptide (AP) was PCR amplified from pBALU-NtermAVI 2.0 (kind gift of B.
Tursun & O. Hobert) and fused by PCR to a part of the NLG-1/neuroligin cDNA amplified from a
GRASP plasmid (Psrh-128::nlg-1::spGFP11, kind gift of M. vanHoven). This fragment was
subcloned into Psrh-128::nlg-1::spGFP11 using NheI and the AgeI within the NLG-1/neuroligin
cDNA so that the AP sequence was fused in frame between the PAT-3 signal peptide and
NLG-1 sequence. The Psrh-128 promoterwas swapped to the Pflp-18 promoter (ROGERS et al. 2003)
using NotI/BamHI and to the ttx-3 promoter with XmaI/ApaI.
The E. coli biotin ligase (BirA) was PCR amplified from
ceh-36prom2::NLS-myc-BirAo::unc-54-3’UTR (kind gift of B. Tursun & O. Hobert) and fused in frame by PCR to NLG-1/neuroligin
amplified from a GRASP plasmid (Psrh-128::nlg-1::spGFP11, kind gift of M. vanHoven) and
subcloned using NheI and AgeI into the same plasmid. Thus, the BirAo (o for optimized,
hereafter named BirA) sequence is inserted in frame between the PAT-3 signal peptide and
NLG-1 sequence. The Psrh-128 promoter was switched to the Pflp-18 promoter using NotIand
BamHI sites and further to the Pmec-7 promoter using SphI/XmaI.
The nrx-1 cDNA was amplified using custom primers from N2 cDNA and subcloned into
pPD96.41 using XhoI/XmaI sites; then subcloned into the plasmid Pmec-7::BirA::nlg-1 to
replace the NLG-1 sequence with the NRX-1 using Bsu36I and SmaI sites. Finally the Pmec-7
promoter was switched to the Pgcy-8 promoter using SphIand KpnI enzymes. SphI and XmaI
sites were used to exchange the Pgcy-32 promoter (YU et al. 1997) for the Pgcy-8 promoter (YU
et al. 1997). All PCR amplified sequences were verified, and primer and plasmid sequences are
available on request.
The AFD-AIY GRASP specific plasmids were constructed by switching the Pflp-18 promoter
of Pflp-18::nlg-1::spGFP1-10 for the Pgcy-8 promoter, and the Pshr-128 promoter in
M. Desbois et al. 5 SI
6 SI M. Desbois et al.
Figure S1. Schematic of iBLINC constructs.
A. The iBLINC constructs have a modular structure comprising a signal peptide,
followed by various modules as indicated. Convenient restriction sites are indicated
to allow easy replacement of promoters or fluorescent proteins. TD: transmembrane
domain; Lam G: laminin G domain; EGF: Epidermal Growth Factor-like domain.
B. Quantification of fluorescent signal in several transgenic lines as indicated. The
percentage of animals showing a fluorescent signal is shown by black bars
(N=10-58/transgenic line). Variable penetrance of staining could be the result of variable
expression from extrachromosomal transgenes.
C. Schematic of the in vivo BLINC system. Epifluorescent micrograph of the head
region of a transgenic animal (dzEx1240)expressing iBLINC (using mstrep::tagRFP)
in AFD/AIY.
D. Schematic of the in vivo GRASP system with an epifluorescent micrograph of the
head region of a transgenic animal (dzEx1325)expressing GRASP (GFP) in
AFD/AIY. Images in (c) and (d) were taken under exactly the same conditions
M. Desbois et al. 7 SI
Figure S2. Annotated sequences of key plasmids and fragments.
Punc-122::streptavidin::tagRFP (pCC::streptavidin::tagRFP)
unc-122 promoter
sel-1 Signal sequence
streptavidin
tagRFP
unc-54 3’UTR
8 SI M. Desbois et al.
M. Desbois et al. 9 SI
10 SI M. Desbois et al.
ACGATAGTTACCGGATAAGGCGCAGCGGTCGGGCTGAACGGGGGGTTCGTGCACACAGCCCAGCTTGGAGCGAACGACCT ACACCGAACTGAGATACCTACAGCGTGAGCATTGAGAAAGCGCCACGCTTCCCGAAGGGAGAAAGGCGGACAGGTATCCG GTAAGCGGCAGGGTCGGAACAGGAGAGCGCACGAGGGAGCTTCCAGGGGGAAACGCCTGGTATCTTTATAGTCCTGTCGG GTTTCGCCACCTCTGACTTGAGCGTCGATTTTTGTGATGCTCGTCAGGGGGGCGGAGCCTATGGAAAAACGCCAGCAACG CGGCCTTTTTACGGTTCCTGGCCTTTTGCTGGCCTTTTGCTCACATGTTCTTTCCTGCGTTATCCCCTGATTCTGTGGAT AACCGTATTACCGCCTTTGAGTGAGCTGATACCGCTCGCCGCAGCCGAACGACCGAGCGCAGCGAGTCAGTGAGCGAGGA AGCGGAAGAGCGCCCAATACGCAAACCGCCTCTCCCCGCGCGTTGGCCGATTCATTAATGCAGCTGGCACGACAGGTTTC CCGACTGGAAAGCGGGCAGTGAGCGCAACGCAATTAATGTGAGTTAGCTCACTCATTAGGCACCCCAGGCTTTACACTTT ATGCTTCCGGCTCGTATGTTGTGTGGAATTGTGAGCGGATAACAATTTCACACAGGAAACAGCT
Pgcy-8::BirA::nrx-1 (pAFD::BirA::NRX-1)
gcy-8 promoter
pat-3 Signal peptide
BirA coding sequence and BirA intron
Linker
Nrx-1 cDNA
unc-543’UTR
M. Desbois et al. 11 SI
12 SI M. Desbois et al.
M. Desbois et al. 13 SI
actagaattctgaatgatggatttccacatgtcattaaaatatctagaactgaagcaaatatgacaattcaagtggataa gctaccatcattacgatatcgaccaaaaagagcaagtgatcttgttttgttgaatatgcaaaccagaatatctatcggag cagcattcaatactaggcatttggatcaaaaaagactgttacgtcatcgtcgaaatacggagatttttgattcatatcag ggagaaatatctggagtcaacgtcaatggattgatgattttggatctttatgaaaatggttctaaccgcatccacaccat tggcgcaccccaaacaacagctgtatcggagcaagtgagcagtgaatcagaagaagacgacgagctagcggaaatgatga tggcacattccatcgatgagaatccaaacgaagcactcatcgagtcattggctcccagctgtctaagtcttgaagaacaa cagtcgtgcttcattgatactgacgattcaacaggattcttctcgccagtccttccaactgttgccaactttccaactac aagacagactgaacatattgataacgaagttactgctctaataacaagtagtttggcaccacaaaagacacgcccaaagt caacgcctcacttcacagtatatccagtaagacctacaacgcctatgggagatacgatcacaacaacaatgcaggccgcc acagtaaccgatttcccGcgaactccactgatcatgtgctccagtttggcagtaattattgccattgctgcagtcgtgtt ctttgttttcaaatgcagacaaaatccgccaaactctgaacactacaccatggctatgaaatctcaatcaggctatacag caattgctcctgaactttcacctcccatgaaccatgaccggagcaacgattcatgtacacaaccattacttgcaaaacca cacatcaacggaaacggttatgaaccgctgaaaggcgcggtaatagccaatggaaatggagcaacggccacaatgatgag aaacggaaacgggaatggggtggcaaagaaaaaggattttaaagagtggtacgtataaTCTCGAGGAGCTCCCGAGATCT TCAGCGCTCAGCATTCGTAGAATTgtaagtttaaactttctcatactaactaacgcgctctatttaaattttcagAATTC CAACTGAGCGCCGGTCGCTACCATTACCAACTTGTCTGGTGTCAAAAATAATAGGGGCCGCTGTCATCAGAgtaagttta aactgagttctactaactaacgagtaatatttaaattttcagCATCTCGCGCCCGTGCCTCTGACTTCTAAGTCCAATTA CTCTTCAACATCCCTACATGCTCTTTCTCCCTGTGCTCCCACCCCCTATTTTTGTTATTATCAAAAAAACTTCTTCTTAA TTTCTTTGTTTTTTAGCTTCTTTTAAGTCACCTCTAACAATGAAATTGTGTAGATTCAAAAATAGAATTAATTCGTAATA AAAAGTCGAAAAAAATTGTGCTCCCTCCCCCCATTAATAATAATTCTATCCCAAAATCTACACAATGTTCTGTGTACACT TCTTATGTTTTTTTTACTTCTGATAAATTTTTTTTGAAACATCATAGAAAAAACCGCACACAAAATACCTTATCATATGT TACGTTTCAGTTTATGACCGCAATTTTTATTTCTTCGCACGTCTGGGCCTCTCATGACGTCAAATCATGCTCATCGTGAA AAAGTTTTGGAGTATTTTTGGAATTTTTCAATCAAGTGAAAGTTTATGAAATTAATTTTCCTGCTTTTGCTTTTTGGGGG TTTCCCCTATTGTTTGTCAAGAGTTTCGAGGACGGCGTTTTTCTTGCTAAAATCACAAGTATTGATGAGCACGATGCAAG AAAGATCGGAAGAAGGTTTGGGTTTGAGGCTCAGTGGAAGGTGAGTAGAAGTTGATAATTTGAAAGTGGAGTAGTGTCTA TGGGGTTTTTGCCTTAAATGACAGAATACATTCCCAATATACCAAACATAACTGTTTCCTACTAGTCGGCCGTACGGGCC CTTTCGT
Pttx-3::AP::nlg-1 (pAIY::AP::NLG-1)
ttx-3 promoter
pat-3 Signal peptide
14 SI M. Desbois et al.
Linker
nlg-1 cDNA
unc-54 3’UTR
M. Desbois et al. 15 SI
16 SI M. Desbois et al.
18 SI M. Desbois et al.
Figure S3: Control experiments to demonstrate iBLINC specificity.
A. – C. Epifluorescent micrographs of the head region of transgenic animals
expressing all three iBLINC constructs (A), the postsynaptic
AP::NLG-1/neuroligin with the streptavidin ‘detector’ fusion (B), or the presynaptic
BirA::NRX-1/neurexin with the streptavidin ‘detector’ fusion (C). Scale bar
indicates 20 µm and anterior is to the left in all micrograph panels. The image in
(A) is identical as in Figure 1D and shown for comparison only.
D. Epifluorescent micrograph of the head region of transgenic animals expressing
the NRX-1 fusion with AP (instead of BirA) presynaptically and the NLG-1 fusion
with BirA (instead of AP) also results in a signal albeit with reduced strength.
E. – F. Epifluorescent micrographs of the head region of transgenic animals
expressing the iBLINC constructs using monomeric streptavidin fused to tandem
superfolder GFP (2xsfGFP) as a detector instead of tagRFP (E, (dzEx1330)).
The corresponding detector alone (F, dzIs66)) shows no signal.
G. – H. Epifluorescent micrographs of the head region of transgenic animals
expressing the iBLINC constructs, but secreting the detector from the intestine
using the Pelt-2 promoter instead of the Punc-122 coelomocytes specific
promoter (G, (dzEx1321)). The corresponding detector alone (H, (dzEx1322))
shows no signal.
I. Quantification of transgenic lines as indicated. The percentage of animals
20 SI M. Desbois et al.
Figure S4: Neuroanatomy of AIY, AFD and URX neurons.
A. – B. Epifluorescent micrographs of the head region of transgenic animals
expressing AFD/AIY iBLINC (dzEx1240) and a cytoplasmic marker for AFD
(oyIs17) (a) or AIY (mgIs18)(b) showing juxtaposition of iBLINC signals with
cytoplasmic markers. (B’, C’) Optical sections of the indicated area in (B, C),
demonstrating juxtaposition of both signals.
C. Quantification of animals showing juxtaposition of iBLINC signals with the AIY or
AFD cytoplasmic markers (N=24 and 30, respectively).
D. Epifluorescent images of animals expressing different fluorescent cytoplasmic
markers in URX sensory neurons (magenta) and AIY interneurons (green).
Anterior is to the left and dorsal to the top.
E. Quantification of the percentage of animals showing juxtaposition (defined as no
visible gap between the two neurites in the nerve ring) of URX and AIY neurites
22 SI M. Desbois et al.
Figure S5. Quantification of synapses between AFD sensory neurons and AIY
interneurons.
A. Epifluorescent images of iBLINC expressing animals in one day old adult wild
type animals. Synapses were circled and the area was quantified using ImageJ.
Prior to analysis, images were randomized and analyzed with the investigator
blind to genotype (or age).
B. ‘Pearl chain’ graphs illustrating the sequential patterns of synapses by iBLINC at
the L4 larval stage and in three day old adult animals compared to patterns
obtained from electron microscopic series at the L4 larval stage (JSH) and three
day old adults (N2U), respectively. Each row is an individual animal.
Synapses/punctae were quantified and placed into four different sized bins based
on fluorescent area (or number of sections seen in EM) as indicated by different
sizes and shades. Size units are square pixels or number of sections. iBLINC
animals used for the ‘pearl chain’ graphs are identical as in Figure 3C and shown
24 SI M. Desbois et al.
Figure S6. iBLINC does not obviously compromise AIY functions during locomotory
behaviors.
A. – D. Behavioral assays of locomotory behaviors were performed essentially as
described (TSALIK AND HOBERT 2003), including thrashing rate (A), number of
reversals (B), radial locomotion (C) and body bends/20s (D). The hypomorphic
mutation in the homeobox transcription factor ttx-3(ks5) was used as a positive
control and N2 wild type animals and non-transgenic siblings of the
extrachromosomal iBLINC line (dzEx1240) as negative controls. Statistical
significance compared to N2 and non transgenic siblings is indicated in red or
blue, respectively: ns, not significant; *, P<0.05. Note that both iBLINC animals
and their non-transgenic siblings display a slight reduction of radial locomotion
26 SI M. Desbois et al.
Figure S7. Synaptic loss affects primarily smaller synapses
A. – D. Quantification of the number of synapses by size in each bin/quartile per
animal (0 to 25 %, 25 to 50%, 50 to 75%, 75 to 100%) at the indicated ages: L4
larval stage, 1d-o adult, 3d-o adult, 6d-o adult, or 9d-o adult. Each dot represents
the mean of one animal with the mean of means indicated by a line of each size
and age as indicated. Statistical significance is indicated explicitly or as: *,
M. Desbois et al. 27 SI
References
Altun-Gultekin, Z., Y. Andachi, E. L. Tsalik, D. Pilgrim, Y. Kohara et al., 2001 A regulatory cascade of three homeobox genes, ceh-10, ttx-3 and ceh-23, controls cell fate specification of a defined interneuron class in C. elegans. Development 128: 1951-1969.
Colon-Ramos, D. A., M. A. Margeta and K. Shen, 2007 Glia promote local synaptogenesis through UNC-6 (netrin) signaling in C. elegans. Science 318: 103-106.
Rogers, C., V. Reale, K. Kim, H. Chatwin, C. Li et al., 2003 Inhibition of Caenorhabditis elegans social feeding by FMRFamide-related peptide activation of NPR-1. Nat Neurosci 6: 1178-1185.
Tsalik, E. L., and O. Hobert, 2003 Functional mapping of neurons that control locomotory behavior in Caenorhabditis elegans. J Neurobiol 56: 178-197.