| INVESTIGATION
Powerful and Adaptive Testing for Multi-trait and
Multi-SNP Associations with GWAS and
Sequencing Data
Junghi Kim, Yiwei Zhang, and Wei Pan1for the Alzheimer’s Disease Neuroimaging Initiative2 Division of Biostatistics, University of Minnesota, Minneapolis, Minnesota 55455
ABSTRACTTesting for genetic association with multiple traits has become increasingly important, not only because of its potential to boost statistical power, but also for its direct relevance to applications. For example, there is accumulating evidence showing that some
complex neurodegenerative and psychiatric diseases like Alzheimer’s disease are due to disrupted brain networks, for which it would
be natural to identify genetic variants associated with a disrupted brain network, represented as a set of multiple traits, one for each of multiple brain regions of interest. In spite of its promise, testing for multivariate trait associations is challenging: if not appropriately used, its power can be much lower than testing on each univariate trait separately (with a proper control for multiple testing).
Furthermore, differing from most existing methods for single-SNP–multiple-trait associations, we consider SNP set-based association
testing to decipher complicated joint effects of multiple SNPs on multiple traits. Because the power of a test critically depends on several unknown factors such as the proportions of associated SNPs and of traits, we propose a highly adaptive test at both the SNP and trait levels, giving higher weights to those likely associated SNPs and traits, to yield high power across a wide spectrum of situations. We illuminate relationships among the proposed and some existing tests, showing that the proposed test covers several existing tests as special cases. We compare the performance of the new test with that of several existing tests, using both simulated
and real data. The methods were applied to structural magnetic resonance imaging data drawn from the Alzheimer’s Disease
Neuro-imaging Initiative to identify genes associated with gray matter atrophy in the human brain default mode network (DMN). For
genome-wide association studies (GWAS), genesAMOTL1on chromosome 11 andAPOEon chromosome 19 were discovered by the new test to
be significantly associated with the DMN. Notably, geneAMOTL1was not detected by single SNP-based analyses. To our knowledge,
AMOTL1 has not been highlighted in other Alzheimer’s disease studies before, although it was indicated to be related to cognitive impairment. The proposed method is also applicable to rare variants in sequencing data and can be extended to pathway analysis.
KEYWORDSadaptive association test; ADNI; default mode network; gene-based test; imaging genetics; multiple traits
A
LZHEIMER’S disease (AD) (MIM 104300) is the mostcommon neurodegenerative disease, and every 67 sec,
someone in the United States develops AD (Alzheimer’s
Association 2015a). Currently there is no cure for AD, and most cases are diagnosed in the late stage of the disease. It is projected that the number of Americans of age 65 years and older with AD will increase from 5.1 million in 2015 to 13.5 million in 2050, a growth from an estimated 11% of the
U.S. senior population in 2015 to 16% in 2050, costing.$1.1
trillion in 2050 (Alzheimer’s Association 2015b). To advance
our understanding of the initiation, progression, and
etiol-ogy of AD, the Alzheimer’s Disease Neuroimaging Initiative
(ADNI) was started in 2004 and continues to the present, collecting extensive clinical, genomic, and multimodal
imag-ing data (Shenet al.2014). Many other genetic studies have
been conducted, identifying multiple common and rare vari-ants, shedding light on pathogenic mechanisms of AD (Marei et al.2015; Saykinet al.2015). In particular, the APOEe4 allele
Copyright © 2016 by the Genetics Society of America doi: 10.1534/genetics.115.186502
Manuscript received December 22, 2015; accepted for publication April 2, 2016; published Early Online April 13, 2016.
Supplemental material is available online atwww.genetics.org/lookup/suppl/doi:10. 1534/genetics.115.186502/-/DC1.
1Corresponding author: Division of Biostatistics, MMC 303, School of Public Health,
University of Minnesota, Minneapolis, MN 55455-0392. E-mail: [email protected]. edu
2Data used in preparation of this article were obtained from the Alzheimer’s Disease
has been consistently shown to be associated with AD.
How-ever, only 50% of AD patients carry an APOEe4 allele,
suggest-ing the existence of other genetic variants contributsuggest-ing to risk
for the disease (Karchet al.2014). A recent study indicates
that 33% of total AD phenotypic variance is explained by com-mon variants; APOE alone explains 6% and other known
markers 2%, meaning.25% of phenotypic variance remains
unexplained by known common variants (Ridgeet al.2013).
Hence, as for other common and complex diseases and traits, many more genetic factors underlying late-onset AD are yet to be discovered. One obvious but costly approach is to have a larger sample size. Alternatively, more powerful analysis meth-ods are urgently needed. For example, in contrast to the popular single single-nucleotide polymorphism (SNP)-based analysis, novel gene- and pathway-based analyses may be more powerful in discovering additional causal variants. As
demonstrated by Joneset al.(2010), jointly analyzing
func-tionally related SNPs sheds new light on the relatedness of immune regulation, energy metabolism, and protein degrada-tion to the etiology of AD. The reason is due to the well-known genetic heterogeneity and small effect sizes of individual com-mon variants, as observed from published genome-wide
asso-ciation study (GWAS) results (Manolioet al.2009). To boost
power in identifying aggregate effects of multiple SNPs, it may be promising to conduct association analysis at the SNP-set (or gene) level, rather than at the individual SNP level.
Another strategy is to use multiple endophenotypes, in-termediate between genetics and the disease, for their poten-tial to have stronger associations with genetic variants. In addition to boosting power, the use of intermediate pheno-types may provide important clues about causal pathways to
the disease (Maityet al.2012; Schifanoet al.2013). A recent
GWAS demonstrated the effectiveness of the strategy: some
risk genes such asFRMD6werefirst identified to be
associ-ated with some neuroimaging intermediate phenotypes (e.g.,
hippocampal atrophy) (Shenet al.2014) and then were later
validated to be associated with AD (Honget al.2012; Sherva
et al.2014). A possibly useful but underutilized intermediate
phenotype is the brain default mode network (DMN), con-sisting of several brain regions of interest (ROIs) remaining active in the resting state. Brain activity in the DMN may
explain the etiology of AD (Metinet al.2015) and is a
plau-sible indicator for incipient AD (Damoiseaux et al. 2012;
Greicius et al. 2004; He et al. 2009; Jones et al. 2011;
Balthazaret al.2014). Since there is growing evidence that
genetic factors play a role in aberrant default mode
connec-tivity (Glahnet al.2010), it may be substantially more
pow-erful to detect genetic variants associated with the DMN, a set of multiple intermediate phenotypes, than with AD.
Here we discuss gene-based multitrait analysis, aiming at discovering genes associated with multiple traits such as the DMN. To date, several but not many methods have been
proposed for gene-based multitrait analysis (Maity et al.
2012; Guo et al. 2013; Van der Sluis et al. 2015; Wang
et al.2015). The simplest way is to use the minimumP-value
(minP) test based on the most significant single-SNP–
single-trait association, which, however, may lose power in the pres-ence of multiple weak associations between multiple SNPs and multiple traits. Some methods, such as that in Van der
Sluis et al. (2015) and M-TopQ25Stat (Guo et al. 2013),
utilize only a few top association signals among the pairwise
single-SNP–single-trait associations. Some methods based on
principal components analysis (PCA) or principal compo-nents of heritability (PCH), originally proposed for multiple
SNPs and a single trait (Wang and Abbott 2007; Klei et al.
2008), may be also applied. However, these methods and canonical correlation analysis (CCA) (Tang and Ferreira 2012) make use of only one or a few top components, and thus they share the same weakness of power loss in the pres-ence of multiple associations; furthermore, the number of
principal components (PCs) may be difficult to determine
(Aschard et al. 2014). Another extreme is the burden test
(Shenet al.2010; Guoet al.2013; Mukherjeeet al.2014),
which is powerful in the presence of a dense association
pat-tern, in which most SNP–trait pairs are associated with
al-most equal effect sizes and directions; otherwise,e.g., when
the association directions of some SNP–trait pairs are
differ-ent, it does not perform well (as is well known for analysis of rare variants). A compromise between the above two
ex-tremes is a variance-component test (Maityet al.2012; Wang
et al. 2013), which is more robust to association density/
sparsity and varying association directions. Nevertheless, as shown in the context of multiple rare variants and a single trait
(Panet al. 2014), it may still suffer from power loss in the
presence of more sparse association patterns (i.e., when there
are fewer associated SNP–trait pairs). A fundamental
chal-lenge in multivariate analysis is the lack of a uniformly most powerful test: nonadaptive test may be powerful in some sit-uations, but not in others. Nevertheless, we aim to construct an adaptive test such that it can maintain high power, not neces-sarily highest power, across a wide range of scenarios. In par-ticular, the proposed test is adaptive at both the SNP and trait levels. Its key feature is the use of a weighting scheme to yield robust statistical power no matter whether the true and un-known association pattern is dense or sparse (or in whatever directions), and the weight is determined data adaptively. In addition, some chosen weights correspond to several existing tests, including a burden test and a variance-component test. Therefore, the high power range of the proposed test covers those of the burden test and the variance-component test. Moreover, the proposed test is based on the general framework of the generalized estimating equations (GEE), and hence it is
flexible with the capability to incorporate covariates and
var-ious types of traits (Liang and Zeger 1986). It also avoids a
difficulty in correctly specifying a joint multivariate
distribu-tion or likelihood for a set of multiple traits. Furthermore, we extend the proposed method to pathway analysis, in which it is adaptive to possibly varying gene-level associations.
associated with the DMN. In the GWAS, 277,527 SNPs were
mapped to 17,557 genes, among which genesAMOTL1 on
chromosome 11 andAPOEon chromosome 19 were
discov-ered by the new test to be significantly associated with the
DMN. Notably, gene AMOTL1 was not detected by single
SNP-based analyses. We also illustrate the application of the methods to the ADNI whole-genome sequencing (WGS)
data, although no significant genes were identified,
presum-ably due to a relatively small sample size.
In the following, we briefly review GEE and an existing
method before introducing the new test in Materials and
Methods. In Results, the new and several existing methods
are compared with applications to the ADNI data and simu-lated data mimicking the ADNI data. We end with a short summary of the conclusions.
Materials and Methods
Review
Generalized estimating equations:Suppose for each individ-uali¼1;. . .;n;we observektraitsYi¼ ðyi1;. . .;yikÞ9;q
cova-riateszi¼ ðzi1;. . .;ziqÞ9;and a set of SNPsxi¼ ðxi1;. . .;xipÞ9;
with xij2 f0;1;2g: Denote Xi¼I5xi9 and Zi¼I5ð1;z9iÞ;
whereIis ak3kidentity matrix, and5represents the
Kro-necker product. We model the mean of the phenotypes
EðYijXi;ZiÞ ¼mi;using a marginal generalized linear model
gðmiÞ ¼ZiuþXib¼Hiu (1)
with Hi¼ ðZi XiÞ; parameters u¼ ðu9;b9Þ9; and a link
function gð:Þ:The regression coefficients b¼ ðb11;. . .;
bp1;. . .;b1k;. . .;bpkÞ9 are a pk31 vector, in which bjt
represents the effect of the jth SNP on the tth trait,
while the element ust of u¼ ðu11;. . .;uðqþ1Þ1;. . .;
u1k;. . .;uðqþ1ÞkÞ9 is the effect size of the sth covariate on
thetth trait. Liang and Zeger (1986) proposed estimatingf
andbby solving the GEE
Uu¼
Xn
i¼1
D9iVi21ðYi2miÞ ¼0 (2)
with Di¼@mi=@u9 and Vi¼fAi1=2RwðaÞA1i=2; where f is a
dispersion parameter, Ai¼diagfvðmi1Þ;. . .;vðmikÞg models
the variances with a variance functionvðmiÞ;andRwðaÞis a
working correlation matrix with possibly some unknown
pa-rametersa. Specifically, for quantitative traits (Yi) with the
identity link function (or more generally, for any generalized linear model with a canonical link function), the score vector
Uuand its variance–covariance matrix CovðUuÞare
Uu¼
Uu9;Ub9
9¼X
n
i¼1
ðZi XiÞ9Rw21ðYi2miÞ;
CovðUuÞ ¼
Xn
i¼1
ðZi XiÞ9Rw21ðYi2miÞðYi2miÞ9Rw21ðZi XiÞ:
The covariance matrix can be partitioned according to the
score components foruandb: CovðUuÞ ¼
V11 V12
V21 V22
For
convenience, the working independence model is often used
with Rw as an identity matrixIk3k; as done in this article
unless specified otherwise.
Our primary concern is to test for overall genetic effects
withH0:b¼0;while treatinguas nuisance parameters. To
perform the score test, we evaluate Equation 1 under H0:
Under H0; we have gðmiÞ ¼Ziu; and the estimate of u,
denoted asu;^ is the solution to the generalized score
equa-tionUu;b¼0¼
Pn
i¼1Z9iðYi2miÞ ¼0:The marginal mean is
es-timated bym^i¼gðZiu^Þ21:
For testing SNP-set effects, we consider the
subcompo-nents of the score vector forb:
Ub¼
Xn
i¼1
X9iðYi2m^iÞ: (3)
Ubasymptotically follows a multivariate normal distribution
MN ð0;S~bÞunderH0;whereS~b¼V222V21V1121V12:Ubcan
be written as Ub¼ ðU11;. . .;Up1;. . .;U1k;. . .;UpkÞ9: Each
elementUjtmeasures the association strength between SNP
jand traitkforj¼1;. . .;pandt¼1;. . .;kand is
asymptot-ically proportional tobjtin Equation 1.bjt¼0 implies there is
no association between SNPjand traitk; similarlyUjt¼0 (or
small) indicates no (or weak) association between SNPjand
traitk.
For testingH0;the GEE-Score test statistic is defined by
GEE-Score¼Ub9S~2b1Ub:
Under H0, the GEE-Score statistic asymptotically follows
a central chi-square distribution with pk degrees of
free-dom. When pk is large, this standard score test loses
power for large degrees of freedom. Another way to draw inference, especially convenient when combining the score test with other tests as discussed later, is to simu-late UbðbÞ MN ð0;S~bÞ for b¼1;. . .;B and obtain the null
statistics GEE - ScoreðbÞ¼UðbÞ9
b S~
21
b UbðbÞ:TheP-value can be
cal-culated asPScore¼
PB
b¼1IðGEE-Score#GEE-Scoreð
bÞÞ=ðBþ1Þ;
whereIðÞdenotes the indicator function.
For ease of notation, we suppressband takeU¼Uband
V ¼S~bhereafter.
An adaptive association test for a single SNP:Zhanget al. (2014) proposed a class of sum of powered score (SPU) tests for testing association between an individual SNP and multiple traits, along with its data-adaptive version (aSPU). The SPU tests are a family of association tests based on the (generalized) score vector in the GEE framework, aiming for at least one of them to be powerful in any given situation.
With only a single SNP j, then the score vector reduces to
U¼ ðUj1;. . .;UjkÞ9:The association between the SNP andk
SPUðgÞ ¼X
k
t¼1 ðUjtÞg;
where a candidate integerg$1 is chosen from a preselected
parameter set G; e.g., G¼ f1;2;. . .;8;Ng The statistical
power of an SPU(g) test depends on the choice of g2G:
Whengis an odd integer, the SPU(g) test sums up the
asso-ciation signals across all the traits, retaining high power if all or most of the multiple traits have an almost equal effect size
in the same association direction. A special case is g¼1;
giving a burden test commonly used for rare variants. With
an eveng, the SPU(g) test will be more powerful when some
traits have different association directions. In particular, the SPU(2) test is the same as the sum of squared score (SSU) test (Pan 2011), closely related to multivariate distance matrix regression (MDMR) (McArdle and Anderson 2001), kernel
machine regression (KMR) (Liuet al.2007), and
variance-component tests (Tzenget al.2011). Furthermore, asg
in-creases, the SPU test upweights the more strongly associated traits, while reducing the weights on other ones. In particular,
wheng/N(as an even integer), only the maximum
com-ponent of the score vector is used and the test statistic is
defined as SPUðNÞ ¼maxk
t¼1jUjtj:The SPUðNÞtest is similar
to the UminP test (when the variances of the score
compo-nents are almost equal). To compute the significance of an
SPU test, Monte Carlo (MC) simulations (or alternatively,
permutations) are used; for b¼1;. . .;B; the null score
UðbÞ¼ ðUðbÞ
j1 ;. . .;U
ðbÞ
jk Þ9 is generated from MN ð0;VÞ; from
which the null statistics SPUðgÞðbÞ¼Pkt¼1ðU
ðbÞ
jt Þ g
can be
obtained for eachg. Then theP-value can be calculated as
pg¼ ½PBb¼1IðSPUðgÞ#SPUðgÞ
ðbÞÞ þ
1=ðBþ1Þ:
However, it is not clear how to choose an optimalga priori
for given data. Hence, Zhanget al.(2014) proposed an aSPU
test to extract association evidence from multiple SPU(g)
tests. The statistic of the aSPU test is the minimumP-value
of SPUðgÞs for some candidate values ofg,
aSPU¼min
g2Gpg;
where pg is the P-value of SPUðgÞ:By MC simulations (or
permutations), theP-value of aSPU, along with those of all
SPU(g) tests, can be efficiently calculated based on the same
set of the null statistics in a single layer.
Existing gene-based tests: We compare the proposed test with several existing gene-based tests for multiple traits,
in-cluding multivariate analysis of variance (MANOVA), MDMR with the Euclidean distance (McArdle and Anderson 2001),
multivariate KMR under linear kernel (Maityet al.2012), and
a multivariate functional linear model (MFLM) (Wanget al.
2015). We note that KMR can be derived based on a
random-effects model while MFLM is built on a fixed-effect model.
For implementation, the R package vegan was used for MDMR; R code for KMR and MFLM was downloaded from
the authors’ websites, http://www4.stat.ncsu.edu/maity/
software.html and https://www.nichd.nih.gov/about/org/
diphr/bbb/software/fan/Pages/default.aspx, respectively. Since
KMR (Maity et al. 2012) was computationally slow, it was
excluded from the simulation studies.
New methods
An adaptive test: We introduce a novel gene-based adap-tive sum of powered score test for a set of multiple traits, denoted as aSPUset, by extending the single SNP-based
test of Zhang et al. (2014). Suppose that there are p
SNPs in a gene and k traits of interests. Recall that
U¼ ðU11;. . .;Up1;. . .;U1k;. . .;UpkÞ9is the generalized score
vector of lengthpkin GEE, andVis thepk3pkcovariance
matrix of the score vector; each element of the score, Ujt
quantifies the association between SNP j and trait t. In
practice, the true and unknown association patterns across multiple SNPs and multiple traits are complex: some SNPs may be associated with some traits, but not with other traits; different SNPs may be associated with different sub-sets of the traits with varying association strengths and directions. Since the use of nonassociated SNPs and traits in a test statistic could reduce the power of the test, we may want to give higher weights to more likely associated SNPs and traits. However, how much to optimally overweight these likely associated SNPs and traits depends on the true association pattern, which is unknown. The aSPUset test
employs two positive integer parameters,g1andg2;to
con-trol the degrees of weighting over the SNPs and over the traits, respectively, and the two parameters are chosen data
adaptively. A largerg1puts more weights on the SNPs more
likely to be associated with a given trait, while a largerg2
upweights the traits more strongly associated with the SNPs.
We build the test statistic as follows. For each traitt,Sðg1;tÞ
quantifies the association between the single trait and
multi-ple SNPs, and then SPUðg1;g2Þ combines the single
trait-based statistics:
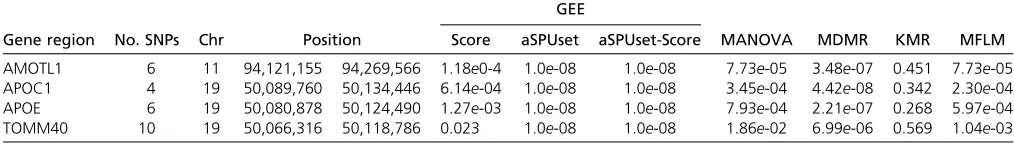
Table 1 P-values of the gene-based association tests for the DMN with the ADNI-1 data
GEE
Gene region No. SNPs Chr Position Score aSPUset aSPUset-Score MANOVA MDMR KMR MFLM
Sðg1;tÞ ¼
Xp
j¼1 ðUjtÞg1
!1=g1
;
SPUðg1;g2Þ ¼
Xk
t¼1
ðSðg1;tÞÞg2:
(4)
Here candidate integers g1$1 and g2$1 are chosen
from two preselected parameter setsG1 andG2:We used
G1¼G2¼ f1;2;. . .;8;Ng;due to the good performance in
our numerical studies.
InSðg1;tÞ;ðUjtÞ
g1can be rewritten by an alternative form
ðUjtÞg1 ¼Ug121
jt Ujt¼wjtUjt:wjt¼U g121
jt is a weight for each
score element, which reflects the association strength (and
direction) between SNPjand traittof the given data. With
g1¼1;the SPU test weights each SNP equally and yields the
highest power if all the SNPs are associated with the trait
t with similar effect sizes and association direction (i.e.,
all positive or all negative). When the subsets of SNPs
are associated with the trait t, or their association
direc-tions are different, SPU(g1¼2;g2) is often more powerful.
As g1 increases, SPU(g1;g2) puts heavier weights on the
SNPs that are more strongly associated with the trait t.
At the end, as the parameter approaches N (as an even
integer), it considers the only most significant SNP; i.e.,
SPUðg1¼N;g2Þ ¼
Pk t¼1ðmax
p j¼1jUjtjÞ
g2:
Similarly,g2controls how much to upweight the traits that
are more likely to be associated with SNPs. SPUðg1;g2¼1Þ
weights all traits equally and performs best when each trait
is equally associated with the SNPs. Similarly, as g2
in-creases, the SPU test overweights larger trait-based
statis-tics Sð:;tÞ; in an extreme case, as g2/N; we define
SPUðg1;g2¼NÞ ¼maxkt¼1jSðg1; tÞj:If one is more interested
in the most significantly associated single-SNP–single-trait pair,
SPUðg1¼N;g2¼NÞ ¼maxj;tjUjtjcan be considered. Using
various combinations ofg1andg2;one can target andfit
dif-ferent association patterns across multiple SNPs and multiple traits, including their varying sparsity levels. As a result, the
SPU(g1;g2) tests cover several existing tests as special cases as
will be shown.
The aSPUset test chooses (g1;g2) data adaptively by
tak-ing the minimumP-value of SPU(g1;g2)s as the test statistic
for candidatesg1 2G1andg22G2;
aSPUset¼min
g1;g2pg1;g2:
To assess the significance of all the SPUðg1;g2Þs and the
aSPUset test, we use either permutations or MC simulations
in a single layer to obtain theirP-values. The
permutation-based method is useful when the covariance matrix (V) is not
easy to estimate (e.g., in a high-dimensional setting) or when
the usual Normal asymptotics may not hold (e.g.,n is not
large compared to pk); in contrast, the simulation-based
method is more restrictive but computationally more effi
-cient. For the permutation-based method, residual terms
resi¼Yi2m^iin Equation 3 are permuted to generate resðibÞ
for b¼1;. . .B; from which the null score vector UðbÞ is
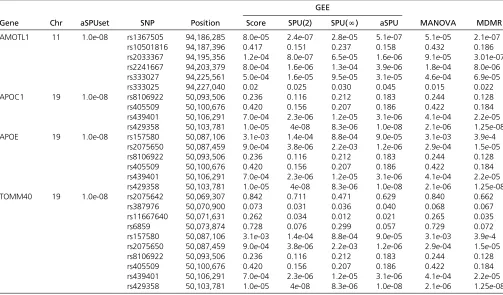
Table 2 P-values of the single SNP-based association tests for the DMN for the significant gene regions (620kb) with the ADNI-1 data
GEE
Gene Chr aSPUset SNP Position Score SPU(2) SPU(N) aSPU MANOVA MDMR
AMOTL1 11 1.0e-08 rs1367505 94,186,285 8.0e-05 2.4e-07 2.8e-05 5.1e-07 5.1e-05 2.1e-07 rs10501816 94,187,396 0.417 0.151 0.237 0.158 0.432 0.186 rs2033367 94,195,356 1.2e-04 8.0e-07 6.5e-05 1.6e-06 9.1e-05 3.01e-07 rs2241667 94,203,379 8.0e-04 1.6e-06 1.3e-04 3.9e-06 1.8e-04 8.0e-06 rs333027 94,225,561 5.0e-04 1.6e-05 9.5e-05 3.1e-05 4.6e-04 6.9e-05 rs333025 94,227,040 0.02 0.025 0.030 0.045 0.015 0.022 APOC1 19 1.0e-08 rs8106922 50,093,506 0.236 0.116 0.212 0.183 0.244 0.128 rs405509 50,100,676 0.420 0.156 0.207 0.186 0.422 0.184 rs439401 50,106,291 7.0e-04 2.3e-06 1.2e-05 3.1e-06 4.1e-04 2.2e-05 rs429358 50,103,781 1.0e-05 4e-08 8.3e-06 1.0e-08 2.1e-06 1.25e-08 APOE 19 1.0e-08 rs157580 50,087,106 3.1e-03 1.4e-04 8.8e-04 9.0e-05 3.1e-03 3.9e-4
rs2075650 50,087,459 9.0e-04 3.8e-06 2.2e-03 1.2e-06 2.9e-04 1.5e-05 rs8106922 50,093,506 0.236 0.116 0.212 0.183 0.244 0.128 rs405509 50,100,676 0.420 0.156 0.207 0.186 0.422 0.184 rs439401 50,106,291 7.0e-04 2.3e-06 1.2e-05 3.1e-06 4.1e-04 2.2e-05 rs429358 50,103,781 1.0e-05 4e-08 8.3e-06 1.0e-08 2.1e-06 1.25e-08 TOMM40 19 1.0e-08 rs2075642 50,069,307 0.842 0.711 0.471 0.629 0.840 0.662
rs387976 50,070,900 0.073 0.031 0.036 0.040 0.068 0.067 rs11667640 50,071,631 0.262 0.034 0.012 0.021 0.265 0.035
rs6859 50,073,874 0.728 0.076 0.299 0.057 0.729 0.072
computed asUðbÞ¼Pn i¼1Xi9resð
bÞ
i :Alternatively, for the
simu-lation method, we simulate the null score vectors
indepen-dently from the null distribution: UðbÞ MN ð0;VÞ for
b¼1;. . .B:
In either case, the null statistics SPUðg1;g2Þð
bÞcan be
cal-culated from the null score vectorsUðbÞforb¼1;. . .;B:
Be-cause all SPU(g1;g2) tests are based on the same null score
vectorsUðbÞ;we just need to simulate one set of null scores
and efficiently compute the null statistics, SPUðg1;g2Þð
bÞ
tests
simultaneously for candidate g1;g2’s. Then the P-value of
SPUðg1;g2Þis
pg1;g2¼
1þPBb¼1
ISPUðg1;g2ÞðbÞ$jSPUðg1;g2Þj
Bþ1 :
We can also simultaneously and efficiently compute the
P-value of the aSPUset test based on the same set of the
null statistics being used for the SPU tests. Note that
for each SPUðg1;g2Þð
bÞ;
we can calculate its P-value
as pðbÞ
g1;g2¼ ½Pl6¼bðIðSPUðg1;g2Þ
l
$SPUðg1;g2Þð
bÞÞ þ1=B:
Denote its minimum aspðbÞ¼ming
1;g2p
ðbÞ
g1;g2:Then the
signif-icance of the aSPUset test is obtained as
PaSPUset¼
PB
b¼1IpðbÞ#jaSPUsetj
þ1
Bþ1 :
Extensions:As shown by Zhanget al.(2014), in some but not all situations, the GEE-Score test may perform better than the aSPU test for a single SNP and multiple traits; the opposite is true too. Hence, to take advantage of both tests, we combine
them by taking their minimum P-value to form a new test
statistic,
aSPUset-Score¼minðPaSPUset;PScoreÞ: (5)
ItsP-value can be calculated using simulations or
permuta-tions as for aSPUset. The null statistic GEE-Score(b)is obtained
from the same scoreUðbÞthat is used for SPUðg1;g
2Þð
bÞ:
Hence
the null statistics for SPUðg1;g2Þð
bÞ
and GEE-Score(b)can be
computed simultaneously.
We can also consider a variance-weighted version of the SPU and aSPUset tests, called the SPUw and aSPUw-set, respectively.
Each diagonal element of the covariance matrix (V) corresponds
to the variance of the individual score elementUjt;denote the
variance ofUjtasVjt:The SPUw test is defined with the statistic
SPUwðg1;g2Þ ¼
Xk
t¼1
" Xp
j¼1
Ujt . ffiffiffiffiffiffi
Vjt p g1
#1=g1 8
< :
9 = ;
g2 :
The aSPUw-set test statistic is defined as the one taking
the minimumP-value of the multiple-SPUwðg1;g2Þ tests in
the same way as that for aSPUset and SPUðg1;g2Þ:The SPUw
and aSPUw-set tests are invariant to the scale of each trait and hence may be useful when it is unclear how to standardize multiple traits that are in different scales. However, standardizing the traits (such that their sample variances are all equal to one)
may or may not be beneficial; often, the power of the unweighted
SPU tests and that of the weighted ones are similar as shown
before in other contexts (Panet al.2014; Zhanget al.2014).
Relationships with other methods:The SPU tests are closely related to some existing tests, covering some as special cases.
Guoet al.(2013) proposed a set of nonparametric methods
for gene-based multiple-trait association analysis, called M-MeanStat, M-MaxStat, and M-TopQ25Stat. Each of
the methods of Guo et al. (2013) is built on a generalized
Kendall’st, which quantifies the pairwise association between a single SNP and a single trait. Comparing two sets of statistics,
M-MeanStat vs.SPUwð2;2Þand M-Maxvs.SPUwðN;1Þ, we
see their equivalence as described inAppendix A.
It is obvious that the SPU(1,1) test is a burden test, which is
optimal if its implicit assumption that each SNP–trait pair is
equally associated (with the same association direction) holds. The SPU(2,2) test has connections to several other
tests. Zhang et al.(2014) showed that when testing on a
single SNP, the SPU(2,2) test under the GEE working inde-pendence model is equivalent to MDMR with the Euclidean distance. However, for testing multiple SNPs, the equivalence
does not hold (Appendix B). KMR with the linear kernel has the same test statistic as SPU(2,2) if the working correlation
matrixRwof the latter in GEE is correctly specified as the true
correlation matrix ofYi[i.e.,Rw¼CorrðYijH0Þ]; seeAppendix
Cfor derivation. This illustrates theflexibility of our proposed
test under GEE, in contrast to the stronger modeling assump-tion in KMR. Since KMR can be derived based on a random-effects model while the burden test is formulated based on a
fixed-effects model, our proposed method can be regarded as
combining results from bothfixed- and random-effects models.
As is shown in our numerical studies, the GEE-Score test and MANOVA performed similarly; we establish the equivalence
between the GEE-Score test and MANOVA with the Pillai–
Bartlett trace (Appendix D). Muller and Peterson (1984)
dis-cussed the close relationships among four versions of MANOVA
(i.e., with the Pillai–Bartlett trace, Hotelling–Lawley’s trace,
Wilk’sl, and Roy’s largest root), each of which can be written
as a function of generalized canonical correlations (CCA). Hence the GEE-Score test is directly related to MANOVA and CCA.
Pathway analysis: We extend the adaptive test for
associ-ation analysis of a single trait and a pathway (i.e., a set of
genes) (Pan et al. 2015) to that of multiple traits and a
pathway. The main idea is to allow adaptive weighting at the gene level, in addition to at the SNP and trait levels.
Given a pathway Swith jSjgenes and a single traitt, we
partition the score vector according to the genes in S as
U¼ ðU19t;. . .;Uj9Sj;tÞ9 with a subvector for gene g (with hg
SNPs) as Ugt¼ ðUg;1;t;. . .;Ug;hg;tÞ9: Denote SPUðg1; g; tÞ
and SPUpathðg1;g2;tÞ as the gene-specific SPU and the
pathway-based SPU test statistics for a single traitt,
respec-tively. Define a new test statistic GEE-SPUpathðg1;g2;g3Þas
the pathway analysis for multiple traits,
SPUðg1;w1;g;tÞ ¼
Xhg
j¼1
w1;g;jUg;j;t g1h
g !1=g1
;
SPUpathðg1;g2;w1;w2; tÞ
¼ X
jSj
g¼1
w2;gSPU
g1;w1;g;g;t g2
!1=g2
;
GEE-SPUpathðg1;g2;g3;w1;w2Þ
¼X
k
t¼1
ðSPUpathðg1;g2;w1;w2;tÞÞg3;
where the three scalarsg1;g2;g3.0 are specified to control
the degrees of weighting the SNPs, genes, and traits,
respec-tively; w1¼ ðw19;1;. . .;w19;jSjÞ9 gives gene-specific weights
for the SNPs in gene g as w1;g¼ ðw1;g;1;. . .;w1;g;hgÞ9; and
w2 ¼ ðw2;1;. . .;w2;jSjÞ9gives gene-specific weights for each
gene in the pathway S. These weights are specified based
on some prior knowledge on the importance of the genes and SNPs; without prior knowledge, we can simply use an equal weight 1 on each gene and each SNP, as used in our
later simulations. We employedg1 2G1¼ f1;2;. . .;8gand
g2;g3 2G2¼G3¼ f1;2;4;8gin later simulations.
Finally, a new adaptive test for pathway analysis, denoted
the GEE-aSPUpath test, is defined as
GEE-aSPUpath¼ min
g12G1;g22G2;g32G3
pg1;g2;g3;
wherepg1;g2;g3 is theP-value of the GEE-SPUpathðg1;g2;g3Þ
test. The simulation or permutation procedure for generating
the null statistics and calculating P-values for all the
GEE-SPUpath and GEE-aSPUpath tests is similar to that for the GEE-aSPUset test.
Due to the limited space, we will not discuss the pathway-based tests in the sequel; some simulation results are
pre-sented in Supplemental Materials,File S4.
Data availability
The authors state that all data necessary for confirming the
conclusions presented in the article are represented fully within the article. The R code for the proposed tests and
simulations is available in Supplemental Materials,File S5.
An R package GEEaSPU is to be uploaded to CRAN.
Results
Real data example
ADNI data:Data used in the preparation of this article were obtained from the ADNI database (adni.loni.usc.edu). The ADNI was launched in 2003 by the National Institute on Aging (NIA), the National Institute of Biomedical Imaging and Bio-engineering (NIBIB), the Food and Drug Administration
(FDA), private pharmaceutical companies, and nonprofit
organizations, as a $60 million, 5-year public–private
part-nership. The primary goal of ADNI has been to test whether
Table 3 P-values of the gene-based association tests with the ADNI-GO/2 and ADNI-1/GO/2 data
Data Gene region No. SNPs Chr GEE
Position Score aSPUset aSPUset-Score MANOVA MDMR MFLM
ADNI-GO/2 AMOTL1 13 11 94,481,507 94,629,918 0.723 0.896 0.940 0.698 0.716 0.638 APOE 13 19 45,389,277 45,432,652 0.083 0.042 0.056 0.097 0.366 0.974 ADNI-GO/2 with identical
SNP sets of ADNI-1
AMOTL1 6 11 — 0.639 0.552 0.576 0.638 0.918 0.638
APOE 6 19 — 0.308 0.019 0.024 0.292 0.065 0.292
ADNI-1/GO/2 with identical SNP sets of ADNI-1
AMOTL1 6 11 — 1.0e-08 1.0e-08 1.0e-08 1.0e-08 1.0e-08 1.0e-08
serial MRI, positron emission tomography (PET), other bio-logical markers, and clinical and neuropsychobio-logical assess-ment can be combined to measure the progression of mild cognitive impairment (MCI) and early AD. Determination of
sensitive and specific markers of very early AD progression is
intended to aid researchers and clinicians to develop new treatments and monitor their effectiveness, as well as lessen the time and cost of clinical trials. The Principal Investigator of this initiative is Michael W. Weiner, VA Medical Center and University of California, San Francisco. ADNI is the result of efforts of many co-investigators from a broad range of aca-demic institutions and private corporations, and subjects
have been recruited from.50 sites across the United States
and Canada. The initial goal of ADNI was to recruit 800 subjects but ADNI has been followed by ADNI-GO and
ADNI-2. To date these three protocols have recruited.1500
adults, ages 55–90, to participate in the research, consisting
of cognitively normal older individuals, people with early or late MCI, and people with early AD. The follow-up duration
of each group is specified in the protocols for ADNI-1, ADNI-2,
and ADNI-GO. Subjects originally recruited for ADNI-1 and ADNI-GO had the option to be followed in ADNI-2. For
up-to-date information, seewww.adni-info.org.
GWAS with ADNI-1 data: One objective of ADNI is to elu-cidate genetic susceptibility to AD. We conducted a gene-based multitrait analysis for ADNI-1 data, by using gray matter volumes in the 12 ROIs corresponding to the DMN as inter-mediate phenotypes. The DMN is a network of brain regions that are active when an individual is at wakeful rest, which includes inferior temporal, medial orbitofrontal, parahippo-campal, precuneus, and posterior cingulate ROIs (Greicius
et al. 2004). Importantly, DMN activity distinguishes
cogni-tively impaired patients such as with Alzheimer’s, attention
deficit hyperactivity disorder (ADHD), or bipolar disorder from
healthy controls (Greicius et al. 2004; Buckneret al. 2008;
Medaet al.2014; Metinet al.2015). The gray matter
volu-metric measures related to the DMN were extracted from the ADNI-1 baseline data.
We included all SNPs with minor allele frequency
(MAF) $ 0.05, with genotyping rate.90%, and surviving
the Hardy–Weinberg equilibrium test at a significance
thresh-old of 0.001. After all rounds of quality control, 519,286 SNPs remained, among which 277,527 SNPs were mapped to 17,557 genes. To consider SNPs in promoter or regulatory regions for each gene, we included SNPs upstream and
down-stream within 20 kb of each gene. Subjects with.10% missing
genotypes were excluded, and only non-Hispanic Caucasians
whose 12 gray matter volumes in the DMN were all measured at baseline were included, resulting in 144 patients with AD, 311 subjects with MCI, and 180 healthy elderly controls. For covariates, gender, years of education, handedness, age, and intracranial volume (ICV) measured at baseline were included. To demonstrate the applicability and power of our ap-proach, we applied MANOVA, MDMR (McArdle and Anderson
2001), KMR (Maityet al.2012), MFLM (Wanget al.2015) and
GEE-based tests, GEE-Score, and aSPUset and aSPUset-Score tests. The number of MC simulations or permutations for each
method was set atB¼103at the beginning, but was increased
toB¼108 if an obtainedP-value was , 5=B;which ensured
the identification of the genes at the genome-wide significance
level (P-value ,2:831026 with a Bonferroni adjustment).
When any obtained P-value was,1.0e-8, we reported it as
1.0e-8. The P-values of permutation-based aSPUset and of
simulation-based aSPUset agreed well (with a Pearson corre-lation of 0.98), and thus we reported only permutation-based
results. For MFLM, we usedb-smooth basis functions with the
Pillai–Bartlett trace as a representative.
The aSPUset and MDMR tests uncovered two loci associ-ated with the DMN. Table 1 lists the genes with the highest
significance levels. GenesAMOTL1 (on chromosome 11) and
APOC1,APOE(on chromosome 19) were identified by both
aSPUset and MDMR, but not by other tests, whileTOMM40
(on chromosome 19) was detected only by aSPUset.AMOTL1
is known to be involved in cell adhesion and cell signaling
(Hamatani et al. 2004). A recent study using a
pathway-enrichment strategy showed that the genes involved in neu-ronal cell adhesion and cell signaling are overrepresented in
schizophrenia and bipolar disorder (Medaet al.2014). Anney
et al. (2008) identifiedAMOTL1as a gene associated with
ADHD. The gene was also highly expressed in thalamus, a brain region implicated in the cognitive impairment of early
stage Huntington’s disease (Schmouth et al.2013). Three
genes (APOC1, APOE,TOMM40) in chromosome 19 could
not be readily discerned due to their physical closeness,
al-though their gene sizes (i.e., the numbers of SNPs) varied.
The P-values of MDMR became less significant as the gene
size increased, while the aSPUset was robust to the number of
SNPs. This locus containingAPOEis well known to be related
to Alzheimer’s disease and cognitive impairment disorder
(Seshadriet al.2010; Kambohet al.2012; Liuet al.2014).
Table 2 lists the SNPs included in the significant genes. We
applied several single SNP-based tests for association with the default mode network. For each method, the permutation
or simulation number was increased up to 108 to satisfy the
genome-wise significance level. As shown in Table 2, none of
Table 4 P-values of the gene-based tests for rare variant–DMN association with the ADNI sequencing data
Filtering criteria Gene region No. SNPs Chr Position aSPUset MANOVA MFLM
MAF ,0:05 AMOTL1 536 11 94,481,507 94,629,918 0.298 0.176 0.148
APOE 153 19 45,389,277 45,432,652 0.104 0.837 0.476
MAF ,0:01 AMOTL1 265 11 94,481,507 94,629,918 0.835 0.193 0.151
the SNPs in geneAMOTL1was significant, suggesting that a strong association signal was retained only in the gene level, rather than in the SNP level. On the other hand, SNP rs429358
contained in three genes (APOC1,APOE,TOMM40) was highly
significant with aP-value of 1.0e-8. These results lend support
to the proposed aSPUset test’s potential to be able to recover
both multiple weak effects and single strong effects, due to its adaptiveness.
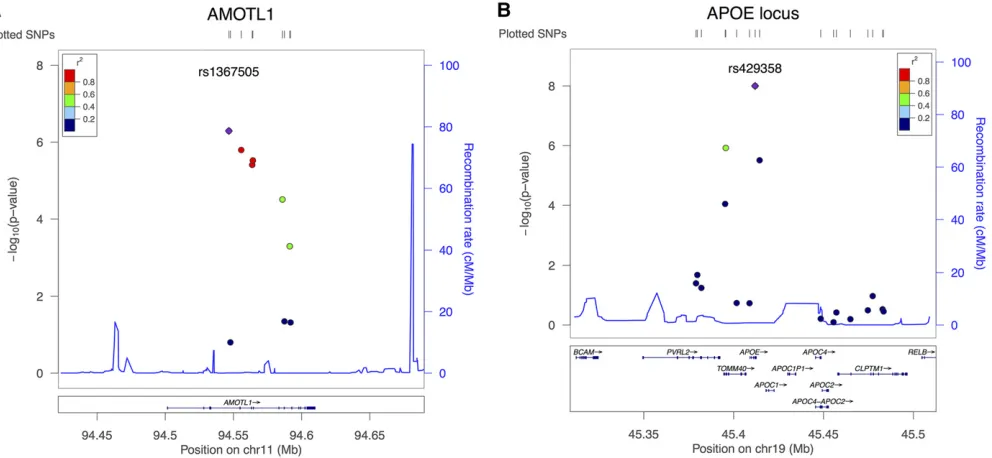
We explored each identified locus in detail in Figure 1 and
Figure 2. In Figure 1, a LocusZoom plot (Pruimet al.2010)
illustrates local linkage disequilibrium (LD),
recombina-tion patterns, and P-values obtained from the single
SNP-based aSPU test for the DMN. Figure 2 illustrates the
association analyses for genes AMOTL1 andAPOE,
respec-tively. First, we obtained P-values from the univariate test
between each SNP and each individual trait composing the DMN, and then we applied the SNP-based test (aSPU) be-tween each SNP and DMN (12 traits). Finally, we applied the aSPUset test at the gene level for the DMN. The SNPs
contained in AMOTL1showed strong LD (Figure 1A), and
their aggregate effects turned out to be significant at the
gene level (Figure 2A). Among the SPUðg1;g2Þtests applied
withg1;g22 f1;. . .;8;Ng;SPU(3,2) showed the minimum
P-value, implying that weak effects were aggregated for an
overall association. In Figure 2B, only one variant (rs429358)
inAPOEwas significant, but the significance level of aSPUset
did not diminish in the gene-level analysis. In testingAPOE,
theP-values of SPU(2,1), SPU(4,1), SPU(6,1), SPU(8,1), and
SPU(N;1) were tied and the most significant; this suggested
that one SNP (rs429358) dominated in the gene level across all the traits.
Since the proposed test is based on combining all possible
single-SNP–single-trait association pairs, if one wants to
identify which pairs contribute most to an overall association,
one can simply examine the significance levels of the univariate
single-SNP–single-trait association tests. For example, Figure 2,
A,a and B,a, illustrates the contribution of each SNP–trait
pair forAMOTL1 andAPOE:In the geneAMOTL1;the SNP–
trait pairs, (rs1367505, R-InferiorTemporal), (rs2033367, R-InferiorTemporal), and (rs333027, L-InferiorParietal),
were ranked highest; forAPOE, the top three significant pairs
were (rs429358, R-Precuneus), (rs2075650, L-Precuneus), and (rs429358, L-InferiorParietal).
As shown in File S1, we conducted a single SNP-based
GWAS scan for the ADNI-1 data. Interestingly, no SNP was
significant from univariate single-SNP–single-trait analyses
as shown inFile S1, Figure A and Figure B. Furthermore, only
one SNP, rs429358, was significant in single SNP-based
mul-titrait analyses as shown inFile S1, Figure C and Figure D. In
contrast, two loci (AMOTL1andAPOE) were uncovered by
gene-based multitrait analyses by our proposed new test (File S1, Figure E and Figure F). In all analyses, covariates consid-ered included gender, years of education, handedness, age, and ICV measured at baseline. Taken together, these results clearly demonstrated the advantage and power gain of our proposed gene-based multitrait analysis.
Validation with ADNI-GO/2 data:Using the ADNI-1 data as
the discovery sample, our GWAS identified two loci associated
with the DMN. To validate the results, each method was
applied to the two genes AMOTL1 and APOE, using the
ADNI-GO/2 data as the validation sample (with n¼754).
We applied the same SNP-filtering criteria as applied to
ADNI-1. Table 3 presents the P-values obtained from each
method; no significant association was identified. Due to
dif-ferent genotyping arrays, ADNI-GO/2 data contain difdif-ferent sets of SNPs from those of ADNI-1; we imputed missing SNPs that were originally included in the analysis of ADNI-1, based
on the reference samples of HapMap 3 with MaCH (Liuet al.
2013), to apply each method to the identical SNP sets of
ADNI-1. The aSPUset and aSPUset-Score tests identified gene
APOEwithP-values of 0.019 and 0.024, respectively, which
passed the significance threshold of 0.05/2 as shown in Table
3, but geneAMOTL1was not significant by any test.File S2,
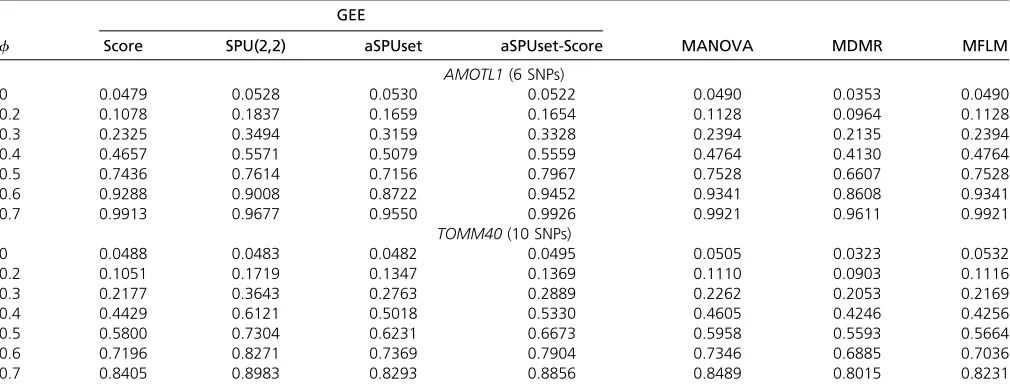
Table 5 Simulation setup 1: type I errors (f¼0) and power (f6¼0) under varying genetic effect sizes
GEE
f Score SPU(2,2) aSPUset aSPUset-Score MANOVA MDMR MFLM
AMOTL1(6 SNPs)
0 0.0479 0.0528 0.0530 0.0522 0.0490 0.0353 0.0490
0.2 0.1078 0.1837 0.1659 0.1654 0.1128 0.0964 0.1128
0.3 0.2325 0.3494 0.3159 0.3328 0.2394 0.2135 0.2394
0.4 0.4657 0.5571 0.5079 0.5559 0.4764 0.4130 0.4764
0.5 0.7436 0.7614 0.7156 0.7967 0.7528 0.6607 0.7528
0.6 0.9288 0.9008 0.8722 0.9452 0.9341 0.8608 0.9341
0.7 0.9913 0.9677 0.9550 0.9926 0.9921 0.9611 0.9921
TOMM40(10 SNPs)
0 0.0488 0.0483 0.0482 0.0495 0.0505 0.0323 0.0532
0.2 0.1051 0.1719 0.1347 0.1369 0.1110 0.0903 0.1116
0.3 0.2177 0.3643 0.2763 0.2889 0.2262 0.2053 0.2169
0.4 0.4429 0.6121 0.5018 0.5330 0.4605 0.4246 0.4256
0.5 0.5800 0.7304 0.6231 0.6673 0.5958 0.5593 0.5664
0.6 0.7196 0.8271 0.7369 0.7904 0.7346 0.6885 0.7036
Figure A illustratesP-values from single SNP-based testing after adjusting for covariates; SNP rs429358 was associated
with the DMN (P-value 1.9e-3) by passing the
Bonferroni-adjusted significance level of 0.05/12.File S2, Figure B
pre-sentsP-values for the two candidate gene regions based on
the ADNI-GO/2 data; the methods include the univariate
single-SNP–single-trait test, the single SNP-based multitrait
aSPU test, and the gene-based multitrait aSPUset test. We should mention possible sample differences between ADNI-1 and ADNI-GO/2 cohorts. The ADNI-1 cohort includes three subject groups consisting of 25% patients with AD, 50% subjects with MCI, and 25% cognitively normal (CN) subjects;
in contrast, the ADN-GO/2 study assigns 754 subjects intofive
groups: 20% CN, 12% significant memory concern (SMC),
35% early mild cognitive impairment (EMCI), 17% late mild cognitive impairment (LMCI), and 16% AD. At least the propor-tions of the CN subjects and patients with AD in the two cohorts are different, which might lead to different association results. Finally, we combined the two cohorts to form ADNI-1/GO/
2 with a larger sample size (1400 subjects) and obtained the
P-values from the tests for the two candidate gene regions.
The two genes were highly significantly associated with the
default mode network as shown in Table 3.
Gene-based rare variant analysis of the ADNI sequencing data: The proposed method was applied to analysis of rare variants with the ADNI WGS data, consisting of 254 and 500 subjects from ADNI-1 and ADNI-GO/2, respectively. In total, 26,142 genes were included for analyses; all variants inside a gene and those located 25 kb of upstream and downstream of the gene were mapped to the gene. Five covariates were adjusted: gender, years of education, handedness, age, and ICV. Due to the low frequency of rare variants, the asymptotic
assumption for some tests may not hold; we modified each
method to avoid using asymptotics. For MANOVA, rather than
using the usualFdistribution, we permuted residuals (under
the null model) to estimate its null distribution; for aSPUset and MFLM, similarly the permutation-based method was ap-plied. We included all rare variants within each gene region; the number of variants within each region ranged from 3 to 750. Sometimes permutation-based MANOVA suffered from
rank deficiency when constructing the test statistic and could
not be applied to 600 genes; MFLM also failed for some
genes due to rank deficiency.
First, we included only rare variants (with MAF,0.01)
and then, both rare and low-frequency variants (with MAF,
0.05). No gene passed the genome-wide Bonferroni-adjusted
significance threshold of 2:831026:The results for each set
of rare variants are illustrated inFile S3, Figure A and Figure
B. MFLM was problematic with an inflation factor1.5 in
both analyses.
Given that two gene regions were significantly associated
with DMN in the previous GWAS analysis, it would be of interest to see whether the rare variants in the two genes were
associated. Table 4 reports theP-values for the two candidate
genes. No significant associations were detected. File S3,
Figure C depicts the P-values from single trait-based tests,
including SKAT, SKAT-O, T1 (a burden test for rare variants
with MAF , 0.01), T5 (a burden test for rare and
low-frequency variants with MAF,0.05), minP, and aSPU tests
(Wuet al.2011; Panet al.2014). T1 and T5 are equivalent to
the SPU(1) test with MAF thresholds 0.01 and 0.05,
respec-tively. The minP test is similar to the SPU(N) test.
Simulations
Simulation setups: We evaluated the performance of our method along with several existing methods in simulation studies. The simulated data mimicked the association
struc-tures for the two genes (AMOTL1 on chromosome 11 and
TOMM40on chromosome 19) and the DMN in ADNI-1 data.
Two factors were considered: association effect size (setup 1) and sparsity of association patterns (setup 2). For setup 1, various effect sizes were created by scaling the regression
co-efficient estimates obtained from a multivariate linear model
(MLM)fitted to the original data. On each gene, an MLM was
fitted to the ADNI-1 data, including the covariates (zi), SNPs
(xi), and DMN (Yi). For covariates, we included gender,
edu-cation, handedness, age, and ICV as in the original data
anal-ysis. Denote the parameter estimates in an MLM as follows:G0
is a vector for intercepts;G¼ ðgjtÞis ap3kmatrix, in whichgjt
represents the effect size of SNPjon traitt; the elementhqt
in matrixH¼ ðhqtÞstands for theqth covariate effect on the
tth trait; andPis the covariance estimate for the multivariate
error term. To maintain the true correlation structures
among genotype scoresxi¼ ðxi1;. . .;xipÞ9andfive covariates
zi¼ ðzi1;. . .;zi5Þ9;we sampled pairsðxi;ziÞfrom the ADNI-1
data in each simulation. The multiple traits for subjectiwere
generated from a multivariate normal distribution:
Table 6 Simulation setup 2: power under varying sparsity levels of association pattern
AMOTL1þnull SNPs
GEE
No. total SNPs No. causal SNPs No. null SNPs Score aSPUset aSPUset-Score MANOVA MDMR MFLM
6 6 0 0.7436 0.7156 0.7967 0.7528 0.6607 0.7528
12 6 6 0.5332 0.6495 0.6923 0.5427 0.4904 0.5228
18 6 12 0.4160 0.6149 0.6336 0.4291 0.3884 0.3882
30 6 24 0.2950 0.4495 0.4617 0.3055 0.2819 0.2872
60 6 54 0.1813 0.3120 0.3150 0.1981 0.1756 0.2124
Yi MN
G0þfG9xiþH9zi; X
: (6)
Herefwas a scaling parameter controlling the effect sizes of
the SNPs (xi): withf¼0;the null hypothesis held and type I
error rates were evaluated; atf¼1;the effect sizes were set
to be equal to the estimated ones from the ADNI-1 data. For setup 2, we varied the sparsity level of the association
structure. At afixedf¼0:5;we increased the gene size by
adding some null SNPs to geneAMOTL1. For the null SNPs,
the genotype data adjacent toAMOTL1were used. As before,
ðxi;ziÞpairs were sampled from the ADNI-1 data. Throughout
simulations, 10,000 replicates were used for each setup and
the tests were conducted at the significance levela¼0:05:
Type I error and power:All the tests showed type I error rates controlled under the nominal level of 0.05 (Table 5). Of note, MDMR resulted in conservative type I error rates. In setup 1
(Table 5), as the association effect size (f) decreased, the
aSPUset and aSPUset-Score tests were more powerful than other tests, suggesting the potential usefulness of the pro-posed tests in identifying causal SNPs with weak effects. Since MFLM was proposed to reduce the dimensionality of the SNP data, it might not be desirable to use MFLM here; it might perform better with larger numbers of SNPs.
In setup 2 (Table 6), the aSPUset and aSPUset-Score yield-ed higher power than other tests as the proportion of the null SNPs in the SNP set increased. Throughout the simulations,
the GEE-Score test performed similarly to MANOVA, confi
rm-ing their equivalence.
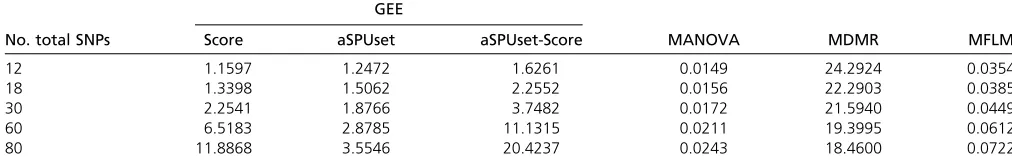
Computational time: We reported the computational re-quirement of each method in Table 7 by taking the average computation time for simulation setup 2. MANOVA was
computationally most efficient, followed by MFLM. As the
number of SNPs increased, the GEE-Score test and the aSPUset-Score test became computationally more demand-ing, but still feasible.
Conclusions
We have presented a highly adaptive association test for multiple traits and multiple genetic variants. From the GWAS analyses of the ADNI-1 data (File S1), we observed its poten-tial power gains in identifying cumulative weak effects of
multiple associated SNPs in gene AMOTL1 with multiple
traits, which were undetectable by several other gene-based
tests and single SNP-based tests. Given that most common variants have only weak effects for complex diseases and traits, developing testing strategies to improve power in iden-tifying multiple SNPs with weak effects is very important. Our proposed method is developed along this direction. Further-more, due to its adaptiveness, it also retains power in the presence of only one or a few associated SNPs (or traits), as
shown for theAPOEgene with the ADNI-1 data (while
sev-eral existing gene-based tests failed to capture this). Our pro-posed adaptive test is in contrast to most of the existing tests, which may be powerful in one or more situations, but not across a wide range of situations. In practice, since the true association pattern for a given gene and traits is unknown, it is unclear which nonadaptive test should be used; it will be convenient and promising to apply an adaptive test such as our proposed one.
We emphasize the potential power gain with the use of multiple traits, especially of intermediate phenotypes for a
complex disease such as AD (Mukherjee et al.2014; Chen
et al. 2015). However, since it is unknown how many of,
and in what association patterns, the multiple traits are as-sociated with a gene (or a set of SNPs), a straightforward use of any multivariate test may lose, not gain, power. Again, the availability of a powerful and adaptive test such as our pro-posed one will largely facilitate its easy and effective use in practice.
Finally, we summarize the use of our proposed tests and make some recommendations. To assess an overall associa-tion between a set of SNPs and a set of traits, we recommend
the use of theP-value of the aSPUset test. If it is significant,
one can check the individualP-values of the SPUðg1;g2Þtests
to shed some light on the underlying association pattern. If a
larger g1 (org2) leads to a more significantP-value of the
SPU test, it suggests a more sparse association pattern; that is, perhaps one or a fewer number of the SNPs (or traits) is or are
associated. Furthermore, one can examine theP-value from
the univariate test for each SNP–trait pair to identify which
SNP–trait pairs contribute most to the overall association. For
choosing candidate values ofg1andg2;based on our limited
experience, we suggest usingG1¼G2 ¼ f1;2;. . .;8;Ngby
default, although an optimal choice depends on the situation;
using a too large or too small setG1orG2will lead to loss of
power. A general guidance, taking G1 as an example (and
similarly for G2), is to useG1¼ f1;2;. . .;C1;Ngsuch that
the SPUðC1;g2Þtest gives aP-value almost equal to that of
SPUðN;g2Þ;a larger number of SNPs may require a larger
Table 7 Mean computing times (in seconds) for simulation setup 2
GEE
No. total SNPs Score aSPUset aSPUset-Score MANOVA MDMR MFLM
12 1.1597 1.2472 1.6261 0.0149 24.2924 0.0354
18 1.3398 1.5062 2.2552 0.0156 22.2903 0.0385
30 2.2541 1.8766 3.7482 0.0172 21.5940 0.0449
60 6.5183 2.8785 11.1315 0.0211 19.3995 0.0612
value ofC1:In addition, if some large univariate associations
between various SNP–trait pairs are likely to be in opposite
directions, only even integers are needed inG1andG2;if it is
knowna priorithat large univariate associations are mainly
in one direction, then using only odd integers may be most powerful; otherwise, both even and odd integers should be used. Given the relationships among the tests, we recom-mend the use of our proposed aSPUset and aSPUset-Score tests, although MFLM may also perform well for large genes; further evaluations are needed.
Acknowledgments
The authors are grateful to the reviewers for constructive comments. This research was supported by National Insti-tutes of Health (NIH) grants R01GM113250, R01HL105397, and R01HL116720 and by the Minnesota Supercomputing Institute. J.K. was supported by a University of Minnesota Informatics Institute MnDRIVE fellowship. Data collection
and sharing for this project were funded by the Alzheimer’s
Disease Neuroimaging Initiative (ADNI) (NIH grant U01 AG024904) and Department of Defense (DOD) ADNI (DOD award W81XWH-12-2-0012). ADNI is funded by the National Institute on Aging, by the National Institute of Bio-medical Imaging and Bioengineering, and through generous
contributions from the following: Alzheimer’s Association;
Alzheimers Drug Discovery Foundation; Araclon Biotech; BioClinica, Inc.; Biogen Idec, Inc.; Bristol-Myers Squibb Company; Eisai, Inc.; Elan Pharmaceuticals, Inc.; Eli Lilly and Company; EuroImmun; F. Hoffmann-La Roche Ltd.
and its affiliated company Genentech, Inc.; Fujirebio; GE
Healthcare; IXICO Ltd.; Janssen Alzheimer Immunotherapy Research & Development, LLC.; Johnson & Johnson Phar-maceutical Research & Development, LLC.; Medpace, Inc.; Merck & Co., Inc.; Meso Scale Diagnostics, LLC.; NeuroRx Research; Neurotrack Technologies; Novartis
Pharmaceuti-cals Corporation; Pfizer, Inc.; Piramal Imaging; Servier;
Synarc, Inc.; and Takeda Pharmaceutical Company. The Ca-nadian Institutes of Rev December 5, 2013 Health Research provides funds to support ADNI clinical sites in Canada. Private sector contributions are facilitated by the Foundation for the National Institutes of Health (www.fnih.org). The grantee organization is the Northern California Institute for Research and Education, and the study is coordinated
by the Alzheimer’s Disease Cooperative Study at the
Univer-sity of California, San Diego. ADNI data are disseminated by the Laboratory for Neuro Imaging at the University of South-ern California.
Literature Cited
Alzheimer’s Association, 2015a Alzheimer’s disease facts andfi g-ures. Alzheimers Dement. 11: 332–384.
Alzheimer’s Association, 2015b Changing the trajectory of Alzheimer’s disease: how a treatment by 2025 saves lives and dollars. Avail-able at:http://www.alz.org/documents_custom/trajectory.pdf.
Anney, R. J., J. Lasky-Su, C. O’Dúshláine, E. Kenny, B. M. Neale et al., 2008 Conduct disorder and ADHD: evaluation of con-duct problems as a categorical and quantitative trait in the international multicentre ADHD genetics study. Am. J. Med. Genet. B Neuropsychiatr. Genet. 147B(8): 1369–1378. Aschard, H., B. Vilhjalmsson, C. Wu, N. Greliche, P. E. Morangeet al.,
2014 Maximizing the power in principal components analysis of correlated phenotypes. Am. J. Hum. Genet. 94(5): 662–676. Balthazar, M., M. Weiler, B. Campos, T. Rezende, B. Damasceno
et al., 2014 Alzheimer as a default mode network disease: a grey matter, functional and structural connectivity study. Neu-rology 83(10): P6.324.
Buckner, R. L., J. R. Andrews-Hanna, and D. L. Schacter, 2008 The brain’s default network: anatomy, function, and relevance to disease. Ann. N. Y. Acad. Sci. 1124: 1–38.
Chen, C. H., Q. Peng, A. J. Schork, M. T. Lo, C. C. Fan et al., 2015 Large-scale genomics unveil polygenic architecture of human cortical surface area. Nat. Commun. 6: 7549.
Damoiseaux, J. S., W. W. Seeley, J. Zhou, W. R. Shirer, and G. Coppolaet al., 2012 Gender modulates the APOEe4 effect in healthy older adults: convergent evidence from functional brain connectivity and spinalfluid tau levels. J. Neurosci. 32: 8254– 8262.
Glahn, D. C., A. M. Winkler, P. Kochunov, L. Almasy, R. Duggirala et al., 2010 Genetic control over the resting brain. Proc. Natl. Acad. Sci. USA 107(3): 1223–1228.
Greicius, M. D., G. Srivastava, A. L. Reiss, and V. Menon, 2004 Default mode network activity distinguishes Alzheimer’s disease from healthy aging: evidence from functional MRI. Proc. Natl. Acad. Sci. USA 101: 4637–4642.
Guo, X., Z. Liu, X. Wang, and H. Zhang, 2013 Genetic association test for multiple traits at gene level. Genet. Epidemiol. 37(1): 122–129.
Haase, R. F., 2011 Multivariate General Linear Models. SAGE Publications in Partitioning the SSCP, Measures of Strength of Association, and Test statistics. SAGE Publications, Thousand Oaks, CA, pp. 59–103.
Hamatani, T., T. Daikoku, H. Wang, H. Matsumoto, and M. G. Carter et al., 2004 Global gene expression analysis identifies molecular pathways distinguishing blastocyst dormancy and ac-tivation. Proc. Natl. Acad. Sci. 101(28): 10326–10331. He, Y., Z. Chen, G. L. Gong, and A. Evans, 2009 Neuronal
net-works in Alzheimer’s disease. Neuroscientist 15: 333–350. Hong, M. G., C. A. Reynolds, A. L. Feldman, M. Kallin, J. C. Lambert
et al., 2012 Genome-wide and gene-based association impli-cates FRMD6 in Alzheimer disease. Hum. Mutat. 33: 521–529. Jones, D. T., M. M. Machulda, P. Vemuri, E. M. McDade, G. Zeng et al., 2011 Age-related changes in the default mode network are more advanced in Alzheimer disease. Neurology 77(16): 1524–1531.
Jones, L., P. A. Holmans, M. L. Hamshere, D. Harold, V. Moskvina et al., 2010 Genetic evidence implicates the immune system and cholesterol metabolism in the aetiology of Alzheimer’s dis-ease. PLoS One 5: e13950.
Kamboh, M. I., F. Y. Demirci, X. Wang, R. L. Minster, and M. M. Carrasquillo et al., 2012 Genome-wide association study of Alzheimer’s disease. Transl. Psychiatry 15(2): e117.
Karch, C. M., C. Cruchaga, and A. M. Goate, 2014 Alzheimer’s disease genetics: from the bench to the clinic. Neuron 83(1): 11–26. Klei, L., D. Luca, B. Devlin, and K. Roeder, 2008 Pleiotropy and principal components of heritability combine to increase power for association analysis. Genet. Epidemiol. 32: 9–19.
Liang, K., and S. Zeger, 1986 Longitudinal data analysis using generalized linear models. Biometrika 73: 13–22.
Liu, E. Y., M. Li, W. Wang, and Y. Li, 2013 MaCH-Admix: geno-type imputation for admixed populations. Genet. Epidemiol. 37(1): 25–37.
Liu, G., L. Yaoc, J. Liu, Y. Jiang, G. Maet al., 2014 Cardiovascular disease contributes to Alzheimer’s disease: evidence from large-scale genome-wide association studies. Neurobiol. Aging 35(4): 786–792.
Maity, A., P. F. Sullivan, and J. Y. Tzeng, 2012 Multivariate phenotype association analysis by marker-set kernel machine regression. Genet. Epidemiol. 36: 686–695.
Manolio, T. A., F. S. Collins, N. J. Cox, D. B. Goldstein, L. A. Hindorffet al., 2009 Finding the missing heritability of com-plex diseases. Nature 461: 747–753.
Marei, H., A. Althani, M. El Zowalaty, M. A. Albanna, C. Cenciarelli et al., 2015 Common and rare variants associated with Alz-heimer’s disease. J. Cell. Physiol. 231: 1432–1437.
McArdle, B. H., and M. J. Anderson, 2001 Fitting multivariate models to community data: a comment on distance-based re-dundancy analysis. Ecology 82: 290–297.
Metin, B., R. M. Krebs, J. R. Wiersema, T. Verguts, R. Gasthuys et al., 2015 Dysfunctional modulation of default mode net-work activity in attention-deficit/hyperactivity disorder. J. Abnorm. Psychol. 124(1): 208–214.
Meda, S. A., G. Ruao, A. Windemuth, K. O’Neil, C. Berwiseet al., 2014 Multivariate analysis reveals genetic associations of the resting default mode network in psychotic bipolar disorder and schizophrenia. Proc. Natl. Acad. Sci. USA 111(19): E2066– E2075.
Mukherjee, S., S. Kim, V. K. Ramanan, L. E. Gibbons, and K. Nho et al., 2014 Gene-based GWAS and biological pathway analy-sis of the resilience of executive functioning. Brain Imaging Be-hav. 8: 110–118.
Muller, K. E., and B. L. Peterson, 1984 Practical methods for computing power in testing the multivariate general linear hypothesis. Comput. Stat. Data Anal. 2: 143–158.
Pan, W., 2011 Relationship between genomic distance-based regression and kernel machine regression for multi-marker association testing. Genet. Epidemiol. 35(4): 211–216. Pan, W., J. Kim, Y. Zhang, X. Shen, and P. Wei, 2014 A powerful
and adaptive association test for rare variants. Genetics 197: 1081–1095.
Pan, W., I. Kwak, and P. Wei, 2015 A powerful pathway-based adaptive test for genetic association with common or rare vari-ants. Am. J. Hum. Genet. 97: 86–98.
Pruim, R. J., R. P. Welch, S. Sanna, T. M. Teslovich, P. S. Chines et al., 2010 LocusZoom: regional visualization of genome-wide association scan results. Bioinformatics 26: 2336–2337. Ridge, P. G., S. Mukherjee, P. K. Crane, and J. S. Kauwe,
2013 Alzheimer’s disease: analyzing the missing heritability. PLoS One 8: e79771.
Saykin, A. J., L. Shen, X. Yao, S. Kim, K. Nhoet al., 2015 Genetic studies of quantitative MCI and AD phenotypes in ADNI: prog-ress, opportunities, and plans. Alzheimers Dement. 11: 792–814. Schaid, D. J., S. K. McDonnell, S. J. Hebbring, J. M. Cunningham, and S. N. Thibodeau, 2005 Nonparametric tests of association of multiple genes with human disease. Am. J. Hum. Genet. 76: 780–793.
Schifano, E. D., L. Li, D. C. Christiani, and X. Lin, 2013 Genome-wide association analysis for multiple continuous secondary phenotypes. Am. J. Hum. Genet. 92: 744–759.
Schmouth, J. F., M. Castellarin, S. Laprise, K. G. Banks, R. J. Bona-guro et al., 2013 Non-coding-regulatory regions of human brain genes delineated by bacterial artificial chromosome knock-in mice. BMC Biol. 11: 106.
Seshadri, S., A. L. Fitzpatrick, M. Arfan Ikram, A. L. DeStefano, and V. Gudnasonet al., 2010 Genome-wide analysis of genetic loci associated with Alzheimer’s disease. JAMA, 303(18): 1832– 1840.
Shen, L., S. Kim, S. L. Risachera, K. Nho, S. Swaminathan et al., 2010 Whole genome association study of brain-wide imag-ing phenotypes for identifyimag-ing quantitative trait loci in MCI and AD: a study of the ADNI cohort. Neuroimage 53: 1051–1063.
Shen, L., P. M. Thompson, S. G. Potkin, L. Bertram, L. A. Farrer et al., 2014 Genetic analysis of quantitative phenotypes in AD and MCI: imaging, cognition and biomarkers. Brain Imaging Behav. 8(2): 183–207.
Sherva, R., Y. Tripodis, D. A. Bennett, L. B. Chibnik, P. K. Crane et al., 2014 Genome-wide association study of the rate of cog-nitive decline in Alzheimer’s disease. Alzheimers Dement. 10: 45–52.
Tang, C. S., and M. A. R. Ferreira, 2012 A gene-based test of association using canonical correlation analysis. Bioinformatics 28(6): 845–850.
Tzeng, J. Y., D. Zhang, M. Pongpanich, C. Smith, M. I. McCarthy et al., 2011 Studying gene and gene-environment effects of uncommon and common variants on continuous traits: a marker-set approach using gene-trait similarity regression. Am. J. Hum. Genet. 89: 277–288.
Van der Sluis, S., C. V. Dolan, J. Li, Y. Song, P. Sham et al., 2015 MGAS: a powerful tool for multivariate gene-based genome-wide association analysis. Bioinformatics 31(7): 1007–1015.
Wang, K., and D. Abbott, 2007 A principal components regression approach to multilocus genetic association studies. Genet. Epi-demiol. 32: 108–118.
Wang, X., S. Lee, X. Zhu, S. Redline, and X. Lin, 2013 GEE-based SNP set association test for continuous and discrete traits in family-based association studies. Genet. Epidemiol. 37: 778– 786.
Wang, Y., A. Liu, J. L. Mills, M. Boehnke, A. F. Wilson et al., 2015 Pleiotropy analysis of quantitative traits at gene level by multivariate functional linear models. Genet. Epidemiol. 39(4): 259–275.
Wessel, J., and N. J. Schork, 2006 Generalized genomic distance-based regression methodology for multilocus association analy-sis. Am. J. Hum. Genet. 79: 792–806.
Wu, M. C., S. Lee, T. Cai, Y. Li, M. Boehnke et al., 2011 Rare variant association testing for sequencing data using the se-quence kernel association test (SKAT). Am. J. Hum. Genet. 89: 82–93.
Zapala, M. A., and N. J. Schork, 2012 Statistical properties of multivariate distance matrix regression for high-dimensional data analysis. Front. Genet. 3: 190.
Zhang, Y., X. Xu, X. Shen, and W. Pan, 2014 Testing for associa-tion with multiple traits in generalized estimaassocia-tion equaassocia-tions, with application to neuroimaging data. Neuroimage 96: 309– 325.