ABSTRACT
SHATTUCK, DOMINICK C. Measuring the Relationship between Individual and Contextual Variables with Technology Implementation: Analyses of Year Three - IMPACT Project. (Under the direction of Denis Gray, Committee Chairperson; Jason Osborne, Jason Allaire and Roger Mitchell.)
The field of educational technology is continually looking to more precisely understand the relationship between leadership, technology-related beliefs, technology resources, supportive environment and technology implementation in classrooms. Previous research has identified relationships between these factors. However, the types of predictors examined, the quality of the dependent variables used and the sophistication of the statistical tools used have sometimes been lacking. This research evaluated these factors within the context of the IMPACT project a three-year technology-enrichment
intervention. Utilizing the last year of the data from this project, this cross-sectional study used structural equation modeling (SEM) to investigate the causal relationship between leadership, beliefs, technology resources, supportive environment and
Measuring the Relationship between Individual and Contextual Variables with Technology Implementation: Analyses of Year Three - IMPACT Project
by
Dominick C. Shattuck
A dissertation submitted to the Graduate Faculty of North Carolina State University
in partial fulfillment of the requirements for the Degree of
Doctor of Philosophy
Psychology Raleigh, North Carolina
2009
APPROVED BY:
_________________________ _________________________
Roger Mitchell Jason Osborne
_________________________ _________________________
Jason Allaire Denis Gray
DEDICATION
This dissertation is dedicated to three women and a country that helped me to mature, albeit begrudgingly sometimes: Marilyn Shattuck, Lela Breitbart, Kristen Shattuck and Ethiopia.
BIOGRAPHY
Dominick Shattuck was born and raised in Fitchburg, Massachusetts. His experiences varied from manual laborer, to school teacher, to scientist. In each position, he has found interest in the people he met and their communities. The Psychology in the Public Interest program at NC State provided the perfect fit of scientific foundation and interventions with social implication for Dominick’s goals. Friends, teachers, coaches and family can claim stake in his success.
ACKNOWLEDGMENTS
A few paragraphs cannot adequately acknowledge the number individuals who supported me and influenced the completion of this dissertation. There are a few who had monumental influence in the completion of this degree.
One afternoon my wife and I sat to look at graduate school programs. At that time, I found it intimidating to leave my job as a teacher and enroll in school for the first time in over 10 years. Kristen didn’t see this as a problem. She convinced me that I was ready and encouraged me to figure out exactly how to make graduate school a reality. And she was right. Since enrolling at NC State, her support has been essential and it enabled me to complete this program. During this time, we did not let life outside of academia stop. The recent years have been a whirlwind of growth: marriage, trips overseas, two houses, two kids and two dogs. Kristen also had to endure my intermittent stress about SAS coding, deadlines and learning how to become a student all over, all again. Simply put, this dissertation is as much a reflection of her sacrifices as my own.
Unbeknownst to them, my daughters, Harper and Marney, have given me the additional push to complete this dissertation and reminded me that life shouldn’t stop for graduate school. I’m looking forward to not having to think about this document in the evenings or on the weekends. I couldn’t imagine having a better reward than more time to spend with you both to watch you grow into beautiful intelligent women.
My committee members provided me with encouragement and support throughout my graduate school experience, the dissertation process and into a professional career.
v
During graduate school each of these individuals was accessible to discuss my questions about academia, or personal concerns. Working with Dr. Allaire provided me with a
statistical foundation and sounding board for the decisions in this dissertation. His ability to explain processes and procedures using language that was easiest for me to understand enabled me to utilize the statistical concepts in this document. Dr. Mitchell’s health education course and discussions about the course materials helped to steer me into my present professional career. Other conversations about Manny Ramirez and the Red Sox, road races and life outside of school helped me to understand the balance that is needed to succeed in multiple environments. Dr Osborne provided me with the opportunity to use the experience that I had coming into graduate school (education/teaching) in a research setting. This change of gears enabled me to make the transition within a setting that was extremely familiar. Most importantly, the position allowed me to make mistakes, figure them out with Amy Overbay and learn from them. Writing my dissertation on data collected from that project was important for my success in graduate school.
TABLE OF CONTENTS
LIST OF TABLES ... viii
LIST OF FIGURES ... ix
PRESENT STATE OF TECHNOLOGY IN AMERICAN SCHOOLS...1
Achievement ...6
Summary ...14
LITERATURE REVIEW ...18
Technology Implementation & Leadership ...20
Training & Beliefs ...27
Implementation ...39
Summary and Study Objectives ...71
METHODS ...75
Research Objectives and Hypotheses ...75
Research Design ...79
Setting, Intervention and Population...79
The IMPACT Evaluation Effort ...80
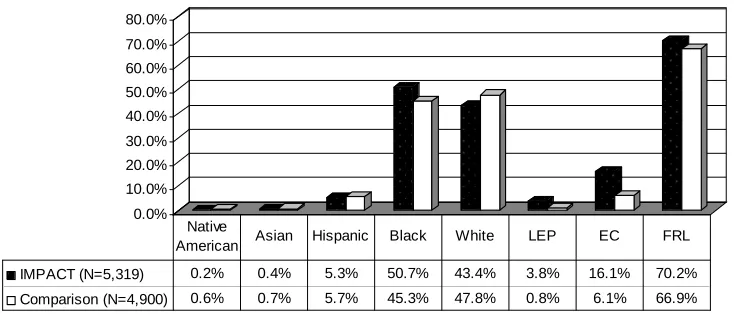
Participants ...81
IMPACT Treatment ...85
Technology Facilitator & Media Coordinator ...86
Flexible Scheduling & Collaboration ...87
Staff Development ...89
Media Technology Advisory Committee...90
Measurement ...91
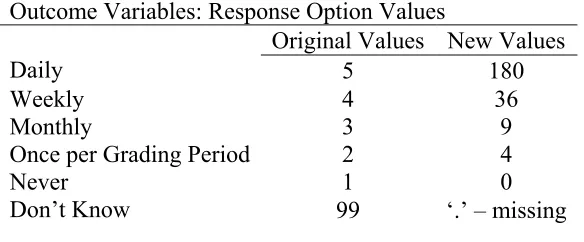
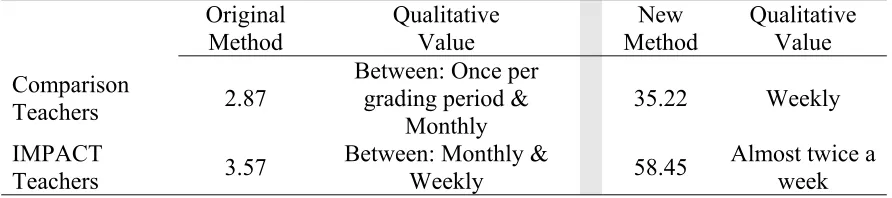
Outcome Variables ...91
Endogenous Variables ...97
Beliefs ...97
Resources ...98
Supportive Environment for Technology Use ...100
Parceling & SEM ...102
STNA Subscale Reliabilities ...104
Exogenous Variables ...105
IMPACT Treatment ...105
Demographics ...106
Leadership ...106
Summary ...108
RESULTS ...110
Descriptive Statistics ...110
SEM Analyses ...113
DISCUSSION ...122
Study Limitations ...127
Conclusion ...130
REFERENCES ...131
APPENDICES ...140
APPENDIX A ...141
APPENDIX B ...142
APPENDIX C ...143
APPENDIX D ...144
APPENDIX E ...145
APPENDIX F...146
APPENDIX G ...147
LIST OF TABLES
Table 1. Sample Population: Owens, Magoun, Anyan (2000) ...25
Table 2. Variables from Redmann & Kotrilk (2004) ...64
Table 3. Implementation of Technologies: Shattuck (2006) ...70
Table 4. Teachers Retained, Year One – Year Three ...84
Table 5. Outcome Variables: Response Option Values ...92
Table 6. Scale Score Examination ...93
Table 7. Student Technology Use: Mean Scale Scores ...94
Table 8. Internal Consistency Reliability Scores for STNA Subscales ...105
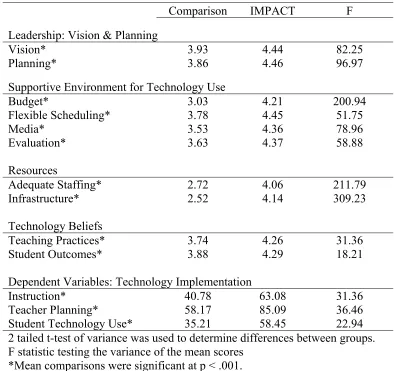
Table 9. Subscale Mean Score Comparisons: IMPACT & Comparison Teachers ...111
Table 10. SEM Statistics: Complete Sample and Group Comparisons ...117
Table 11. SEM Statistics: Comparative Models ...119
Table 12. SEM Multiple Group Analyses: Reduced Model Regression Weights and Loadings ...121
v
LIST OF FIGURES
Figure 1. Technology Acceptance Model ...55
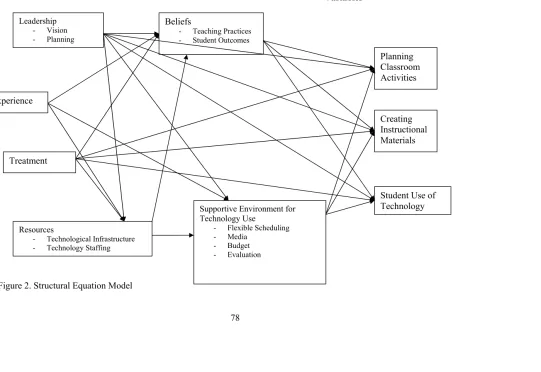
Figure 2. Structural Equation Model ...78
Figure 3. IMPACT Research Design ...80
Figure 4. IMPACT & Comparison: Teacher Grade Levels ...83
Figure 5. IMPACT & Comparison Teachers: Years of Experience ...83
PRESENT STATE OF TECHNOLOGY IN AMERICAN SCHOOLS John Dewey proclaimed that schools are dynamic social institutions, which are asked to provide students with “a process of living and not a preparation for future living” (Dewey, 1897). This seamless transition from educational setting to adult life requires the ability to problem solve in multiple areas as well as utilize tools necessary for success. Recently, computers, the internet and several technology-based “gadgets” have become the hard-technology tools that many legislators, administrators and teachers are attempting to incorporate into classroom curricula to facilitate Dewey’s process of living.
Related to this challenge, recent findings by the US Department of Education (2003) stated that 91% (53 million) of children in nursery school through grade 12 use computers and 59% use the Internet. They reported that students’ use of technology begins early in their academic careers, as 80% of kindergarteners and 97% of students in grades 9-12 use computers and large proportions of these students use the Internet. Investigating the role of schools as it relates to the students’ technology capacity, this report states that schools help bridge the digital divide that finds most minority students unable to access computers. Furthermore, about 46% of students use the internet to complete school assignments. These statistics reveal that computers and the internet are two instructional technologies that are already used by many American students.
The relevance of technology resources and their implementation in schools is far-reaching. The federal No Child Left Behind legislation (Education, 2000) mandates technology literacy for students and calls for more empirical methodologies when
designing school research projects. States have addressed technology education by providing resources in the form of technology, manpower and training for teachers at various rates, but the effects of these initiatives are far from conclusive.
In an attempt to clarify the scope of the issue of technology education, Meade & Dugger (2004) conducted a national survey to assess the efforts of state legislatures. Using a sample of all fifty states and the District of Columbia they distributed a four question survey to state supervisors regarding how they account for technology education within the framework for their state. The results revealed that thirty-eight states are including technology in their state educational framework (up 8 states from 2001) and five of those states indicated that technology education was part of a career preparation framework. Five other states indicated that technology was delivered to students as part of core subject classes. In a change from a 2001 survey, the researchers found that all fifty states responded that technology education was a requirement (or that the
requirement is pending) for their students either at the state level or within their local school administrative area.
The integration of technology into the state policies reflects the rising value that is being placed on technology within schools, but other data point to factors that may
complicate the process of successfully integrating technology into school curricula. Meade and Dugger (2004) also addressed the application of national technology standards with state supervisors. Their results show that forty-one states are using
s.
within schools.
standards1. However, Meade and Dugger (2004) also looked at the number of technology education teachers within each state and found that there was a decrease across the nation when comparing their data with findings from other recent survey They did not speculate on the reasons behind this decrease, which could stem from a reprioritization of personnel
The complex nature of the value of technology in schools can also be underscored by examining the resources actually available to teachers and students across the US. The May, 2004 issue of Education Week (edweek.org, 2005) reported that across the U.S. for every one school computer connected to the internet, there are 4.3 students. At the classroom level, that number increases to 8.4 students for every computer connected to the internet. This difference is likely attributed to computer labs in the US schools that are used by classes or groups of students at a time and teachers’ computers. They continue to report that 92% of the schools in the US have internet access and of those schools 74% of the teachers use the internet for instruction. These rates further emphasize the importance placed on computers and technology within schools by shedding some light on the resources allocated, but they do not reflect the entire picture of technology usage. Despite the seemingly high rate of technology availability, Peck, Cuban and Kirkpatrick (2002) reported that in 1999 the typical teacher provides students with fewer than 10 opportunities to use computers during a school year.
1 These standards are either the adoption of Standards for Technology Literacy (ITEA, 2000/2002) or the
application of standards developed from this basis
The mosaic of research surrounding implementation of technology in schools has been developing, but with a number of caveats. Currently, the available research has investigated smaller-scale initiatives, and has been fragmented by a narrow focus. Also, research-design variability makes it difficult to apply findings across environments. These differences have limited our understanding of the process related to technology adoption and implementation in schools.
Research conducted on this topic diverges into several areas. Some researchers have investigated Instructional Technology (IT) in-general, looking at the overall impact of various technological interventions in schools and attempt to quantify their effects on achievement. Other researchers drilled down to understand the integration of a particular technology on the performance of students who used that technology. There are also researchers who are interested in not only students’ access to technology, but how teachers integrate various technologies into their curricula and what processes are more effective. This variation in the literature leaves the field of educational technology research without a clearly agreed-upon operational definition of technology (also called Information Technology – IT).
IT is defined in different ways, depending on the aims of the research. In this study, the researcher has elected to use the Commission on IT’s (1970) definition of what this term entails:
…the media born of the communications revolution which can be used for instructional purposes along side the teacher, textbook, and
blackboard…[as well as]…a systematic way of designing, carrying out,
and evaluating the total process of learning and teaching in terms of specific objectives, based on research in human learning and
communications, and employing a combination of human and nonhuman resources to bring about more effective instructions. (p. 27)
This study uses a more comprehensive definition of IT because the literature reviewed below reveals that there is a great degree of disparity with regard to the precise nature of this term. Following the development of research in IT over time this definition may need to change, but the realities of the interplay between technology, instructional methodology and student perceptions of technology need to be considered when re-defining this term. This is an ever evolving process as technology rapidly advances and becomes more interactive, more interconnected and more accessible.
Earle (2002) suggested that “the prevailing public perspective incorporates IT as a synonym for computer technology.”(p. 33). He continued by comparing the present push for IT to the federal funding of televisions for schools (40 years ago) and how little attention was paid to instructional design and technological processes. A review of the literature reveals that IT scholars and practitioners have battled the conceptual separation between technology and the process of its implementation, but have failed to effectively measure the outcomes associated with technology-enriched instruction. Literature presented below provides some insight on how the relationship between technology and student achievement has been debated through the measurement of achievement and technology integration.
The body of literature surrounding IT also varies considerably in the technology policies it promotes, with some variation occurring across studies that provide anecdotal evidence (but lack structured investigation) and research performed in a structured manner. One way in which to get a better understanding of this literature is through the review of meta-analyses. Below, several of these literature syntheses and one national study are reviewed to provide a broad understanding of the relationship between IT and student achievement.
Achievement
Early efforts to measure student achievement gains focused on three things: students’ access to technology, students’ motivation to engage in the learning process and teachers’ perceptions of student gains (Earle, 2002). Critics of this process (Trotter, 1997) argued that the technology provided no guarantee that students’ achievement levels would increase, or that there was a great deal of variability in the results from these studies (Viadero, 1997). More recently, examples such as Valdez, McNabb, Foertsch, Anderson, Hawkes, & Raack (2000) suggest that student achievement is enhanced in several ways when technology is appropriately integrated into the curriculum. Despite the debate on the effect of technology integration, these issues are seldom investigated with scientific rigor.
Another question that has surfaced in the literature surrounding IT is whether achievement measures appropriately measure change as it relates to technology.
Standardized test scores have become subject to various criticisms by teachers and school administrators for their lack of depth and inability to capture a true reflection of the students’ levels of achievement. The criticisms of these tests as they relate to IT are no different. McNabb, Hawkes and Rouk (1999) argued that standardized tests fail to measure levels of creativity and critical thinking that students develop through their technology use. These authors contend that the added complexities of technology-based learning were not measured by current standardized tests. Missing these integral
elements of the learning procedure created a devaluation of the process that students experienced through learning with technology. Furthermore, students who were learning through the utilization of technology were at some disadvantage when forced to complete a paper and pencil version of a standardized test (Russell, 1999). This inability to
accurately measure achievement is a disservice to the efforts of teachers who have repeatedly reported large gains in the levels of student interest and attitudes toward lessons enhanced through the use of technology.
One consideration of IT and its integration into curricula is the level of active involvement that students have with the technology as opposed to the orchestration of technology performed by their teachers: does integrating IT into classrooms refer to students’ use of technology, or the way that the classroom experience is mediated through a teacher-led presentation of content via IT? Identifying what a particular IT requires of students and teachers is important in proceeding with research in this area. As mentioned above, some applications of technology can provide students with new and unmeasured competencies while others applications, such as rudimentary application of an interactive
whiteboard, simply require students to passively receive information. Defining effective integration will be important for the field of research. This study tests the relationships between contextual factors and technology implementation, which includes teachers’ behaviors specific to the following three areas planning, material creation, and student use of technology.
Richard Clark (1983) provided an early analysis of literature in the field of IT. His focus was to summarize the research (meta-analyses and current research)
surrounding the effectiveness of various educational media. Clark wrote that previous research showed marginal positive effects for different media. His review led him to conclude that the novelty of the medium and the variation of instruction are what account for the existing evidence for the effects of various media on learning gains. In his own words, Clark states, that “…it was not the medium that caused the change but rather a curricular reform that accompanied the change. The best current evidence is that media are mere vehicles that deliver instruction but do not influence student achievement any more than the truck that delivers our groceries causes changes in our nutrition” (p. 445).
Clark argues that there are natural differences in the method in which content is delivered across classrooms in the studies included in the meta-analyses and this
confounding factor inflates effect sizes. Furthermore, he suggests that the novelty of the medium, whether television or computer assisted instruction, diminishes over time. He advises strongly against future media comparison research stating that researchers confuse medium with method of instruction. Clark mentions how public expectations of
media [technology] are a driving force behind any and all school improvements which makes it difficult for schools to turn away from adopting these new technologies.
During the late 1980s, two meta-analyses were performed on the topic of Computer Based Instruction (CBI), which was used to supplement more conventional teaching methods in some schools (Kulik & Kulik, 1991; Kulik, 1994, as referenced from Schacter, 1999). This form of IT was envisioned as a method to reduce costs within schools and provide every student with personal interactive attention. These studies are frequently cited in the literature in support of various instructional technologies.
The first meta-analysis (Kulik & Kulik, 1991) found an overall moderate effect size of .30 with variation in this effect size when looking further at details of the studies involved (published/not published, variation in the instructor, length of study). The second study (Kulik, 1994, as cited in Schacter, 1999) improved upon the initial meta-analysis by including 500 studies (from 254), but it did not provide increased support for this form of IT2. Results were reported in the form of percentile gain on tests of
achievement (not certain how consistently achievement was measured) from 50th to 64th (this number is down from 66th percentile in the 1991 study).
Kulik & Kulik (1991) describe situations in which CBI was appropriately compared to typical instruction at the beginning of the article. The authors put forth parameters for the articles used in their reviews, demanding that there be an actual comparison between a CBI class and a conventionally taught class, an appropriate rate of attrition, and fair teaching by instructor. The authors also mentioned their consideration
2 I focused on the Kulik & Kulik (1991) article because I didn’t have access to Kulik, (1994).
of sampling differences between comparison groups, but provide little further detail on this issue.
Due to the nature of the literature reviewed, they measured attitudes toward computers as well as student achievement. Yet the task of measuring student
achievement was challenging for the authors because of the lack of consistent procedures. They concluded that to include a study as measuring achievement it would simply need to provide quantitative results. They do not mention the inclusion of a pre-score for
students or any type of measurement that would imply comparative growth between the groups. Instead, using the procedures of meta-analyses, outcomes were re-coded as effect sizes (they calculated the difference between the mean scores for the two groups divided by the standard deviation of the control group). Kulik and Kulik (1991 & 1994) used a large body of literature to show that there was a moderate effect of CBI
technology and as a result this article is cited frequently through the literature and meta-analyses as an early example of the relationship between IT and student achievement, albeit a minimal effect and one that is frequently questioned on the grounds of research methodology.
Both Kulik and Kulik (1991) and Clark (1983) provided examples of the fishbowl effect, which plagued the implementation of instructional technologies in its infancy. Criticisms have always been plentiful for interventions that come with a high price-tag and may (depending on the measure) only provide minimal results despite the cultural push to use them in schools. This conundrum persists today as researchers of educational technology face the same challenges of appropriate measurement of outcomes, lack of
random assignment for groupings and the suggestion that findings are ungeneralizable, not to mention the social pressures of our culture and the challenge of being current in the rapidly evolving world of technology.
One comprehensive study of the effects of technology, in general, was provided by Sivin-Kachala (1998, as cited in Schacter). Using 219 studies from 1970-1990, he made a general assessment of technology across school domains. He found that students in technology-rich environments experienced positive effects in all subject areas through all grade levels and including special needs children. This article and Kulik and Kulik (1991) provide an attempt at developing an all-inclusive approach to meta-analyzing articles.
A comparison of nearly 200 articles was conducted by Waxman, et al. (2003) to examine the relationship between IT and student achievement. Using a rigorous method of article identification and qualification, only 42 articles were included in their final synthesis. Despite their efforts, they stated that the studies included had a large difference in their definition of technology and their measures used to assess student achievement. Their overall effect size was .41 (CI .18 - .64, p < .05) indicating a small
positive effect (Cohen, 1988).
The Waxman et al. review attempted to apply five comprehensive standards of technology application that are related to dramatic improvements for education of all students: joint productivity, language development, contextualization, challenging activities, and instructional conversation. Unfortunately, there was not enough
consistency in the literature to support the application of these categories. Instead, the
authors were limited to categorizing studies by whether they influenced cognitive outcomes, affective reaction to technology, or changed student behavior as when using technology. The effect sizes for each of these categories were as follows: Cognitive (ES = .45), Affective (ES = .46), Behavioral (ES = -.09). Their efforts showed that
technology improved cognitive and affective outcomes, but that behavior was negatively influenced.
The article identification and elimination procedure performed by Waxman et al. (2003) provides evidence of the variety of objectives and methods that can be taken by researchers. Limitations related to research within educational settings fall solely on the researchers’ shoulders. Working within school settings, teachers and administrators may perceive their efforts as disruptive to school activities, creating additional burden to teachers and potentially compromising the confidentiality of student grades/scores. Addressing these concerns creatively may enable researchers to implement more appropriate designs and provide results that are more generalizable. Lewis (1999) suggested that to provide better research methodology in IT literature, teachers would have to be “encouraged to be researchers in their own right, or collaborators in research.” He continued to imply that research in this field must employ the paradigm that can best answer the questions that need to be answered using creative methods. Although some researchers may not enthusiastically support Lewis’ notion of teachers becoming researchers, his call for creative efforts to improve the field of literature is both reasonable and necessary.
Over the last twenty years the state of educational technology has evolved, but more effective means of implementation have not developed at the same pace. Cuban (1999) concludes thtat the advice from experts in the field is contradictory and changing with the latest and greatest advancements in technology. Technology implementation is a pressing issue, but previous research focus, sampling issues and the designs often limit the ability to generalize the findings.
The role of teachers within technology-rich classrooms was elaborated on by Becker (1999)who found that teachers who implement technology more frequently are more likely to fit a constructivist methodology (see Vygotsky, 1978). He presented a relationship between teacher attitudes toward Internet resources, the school’s phase of integrating resources, and subject taught. Becker’s approach to this area of interest was to pair the idea of technology implementation with the teacher’s use of constructivist
methodology.
Implementing a constructivist methodology in a classroom requires teachers to take into consideration the interests of students when developing lessons, enabling a number of activities to occur at the same time within a classroom and facilitating group work that encourages personal experiences and opinions. Alone, constructivist
methodologies require a great amount of planning time and effort. Becker examined whether there were links between teachers using this methodology in conjunction with higher computer usage rates.
Looking at 152 schools within the National School Network he found relatively more technology than in average schools, more participation in technology initiatives
developed within the schools and more schools that had a climate that supported
curricular and instructional change. Becker (2000) sampled 441 teachers and found that teachers who reported regular use of computers with students over a three year period were almost twice as likely to report having made constructivist-oriented changes in their practice as were teachers who did not use computers. These findings imply that using computers in the classroom promotes more constructivist activities.
Becker (2000) also mentions that where teachers are personally comfortable and moderately skilled with computers and provided ample time and resources, computer activities flow seamlessly alongside other learning tasks and are becoming a valuable and well-functioning instructional tool. At the same time, Becker’s research supports the idea that technology is being implemented at generally low levels across school subjects and with inconsistent methodological support.
Summary
This review of key research and meta-analyses of IT provide evidence of the limitations and strengths of the field. The low to moderate effect sizes of the meta-analyses reviewed above support Clark (1983) and Valdez et al.’s (2000) assumption that the effects attributed to technology may need further clarification. The influence of clarifying methods in the literature was only provided in a small number of generalizable articles included in Waxman et al.’s (2003) meta-analysis (42 articles). Considering general changes in pedagogy over time in combination with the influx of various
educational technologies, measuring teaching activities is like attempting to hit a moving target.
Previously, pedagogical practice was centered on teacher-based activities. Today, with the increasing procurement of computers and internet access, technology-driven activities in schools are changing the role of the teacher. Regarding this general relationship, Tornatzky and Fleischer (1990) wrote, “The balance of physical and behavioral elements in any given technology is subject to readjustment.” This evolution requires teachers to integrate the internet and new technologies into classroom activities as well as redefine their role in the educational process. This reevaluation influences the level of teachers’ commitments and is reflected in their attitudes toward the technology.
In an attempt to show the relationship between teacher and technology, Zhao and Frank (2003) explain the communal benefits of technology integration at the teacher and student levels:
When a teacher uses computers for her own purposes it benefits her directly at the micro level as an organism, perhaps making her more efficient or engaging her interest. On the other hand, students are the common resource of the system. Thus, when a teacher facilitates student uses of computers, she contributes more directly to systemic value, which may have less direct and immediate personal benefits…student uses benefit everyone in the school, whereas teacher uses benefit the individual teacher. (p. 814)
Considering instructional technologies in a more systematic manner, this field of research would benefit from revisiting previous discussions about what qualifies as IT. As research in the area evolves and the technologies show increased capacity to connect and interact, the definition of what qualifies as IT may change. Ideally, this change will be accompanied by changes in effective teaching as was found by Becker (1999). Overhead projectors or filmstrips, tools that were once considered advanced, are now disregarded in this field for more state of the art interactive technologies such as
hypermedia and simulation programs for students. Revisiting the definition of IT enables researchers to provide more appropriate expectations of what the technologies should entail when properly integrated. When this has been accomplished, the technologies can be assessed for their effectiveness. Until the terminology is discussed and generally agreed upon the field will continue to draw conclusions from blanket definitions and include inappropriate technologies and teaching strategies in its assumptions.
Developing an appropriate definition for IT will enable researchers to then evaluate the technologies in a more systematic and generalizable manner. Of course educational research will be challenged by typical hurdles such as budget constraints and enrollment of appropriate control groups, but a more standardized definition of the technologies will provide two things for this field of research. First, it will foster debate about what qualifies as technology. Identification of various instructional tools as technologies and gradating them will enable researchers to measure the difference between novelty and capacity building through true technology/student interaction. Although the novelty of some technologies will fade (i.e., overhead projector, basal
17
readers) their interaction capacity with students may remain the same. Explaining how and why technologies are more in vogue with students will begin to assist in identifying Clark’s (1983) attribution of novelty.
Second, a more appropriate definition of IT will assist in more effectively identifying the teaching activities accompanying each technology. This will result in a more holistic approach to researching IT. This development is necessary, because few studies actually measure change in teachers’ behaviors before and after the arrival of a technology.
Educational technology has merited a great deal of attention by academics, legislators, parents and school administrators. As this field develops, our understanding of it becomes more fragmented as a result of the assortment of research designs used and increasing pressures put on schools to show tangible outcomes related to the financial commitments within school budgets. Cuban (1985) refers to the issues surrounding technology education as the acknowledgement of a practical dilemma, which forces
LITERATURE REVIEW
Implementation of physical technologies comes with social-structural
considerations. The process of structural reorganization for an innovation facilitates the embedded use of technology within a school and is reflective of both the technology itself as well as the changes in social networking (Cooper, 1998; Damanpour, 1987; Tornatzky and Fleisher, 1990). Becker and Ravitz (2001) predict that computers’ importance will rise over the next ten years, yet the method of integrating technology into school
curriculum is a complex, poorly-understood undertaking (Cooper, 1998). Ten years ago, mainframes, school websites, and web-quests were not issues that school administrators and district heads considered, but today they are asked to integrate visionary technology policies with curriculum initiatives to continually replenish the supply of infrastructure for their schools. In conjunction with the reconfiguration of school-wide policies is a procedural change in the classroom.
Previously, pedagogical practice was centered on teacher-based activities. Today, with the increasing availability of computers and internet access, technology-driven activities in schools are changing the role of the teacher, which parallels scholarly advocacy for student-centered learning approaches. Regarding this general relationship, Tornatzky and Fleischer (1990) wrote, “The balance of physical and behavioral elements in any given technology is subject to readjustment” (p. 17)? This evolution requires teachers to integrate the Internet and new technologies into classroom activities as well as redefine their role in the educational process. This reevaluation influences the level of teachers’ commitments and is reflected in their attitudes toward technology.
To establish an understanding of the literature centered on the relationship among teachers, their attitudes toward technology, and their level of technology implementation, electronic databases were employed extensively. In October of 2007, three databases, ERIC, PSYCH INFO, and Web of Science, were used to search for relevant articles using combinations of five keywords: “teachers,” “attitudes,” “technology,” “computers,” and “implementation.” Initial results from this search included a large number of studies related to the keywords in various ways, but only a limited number of studies directly relevant to the topic of interest. Empirical studies were later evaluated to include a treatment group of teachers and an evaluation of technology implementation.
As mentioned above, there are myriad subtopics associated with this process, and with this diversity comes a vast array of research methods. Included below are articles that describe and assess technological interventions. The articles discussed in the
following review were organized around two criteria: first their methodological strengths, and second, their relationship to the variables that will be tested in this study. Generally, the studies found for this literature review did not provide strong examples of optimal research design. The designs of the studies vary in their data collection methods, but all are descriptive analyses. Below, seven of the thirteen study designs are cross-sectional. Six of the studies are prospective examinations of a group that has received one of many technological interventions. One of these prospective studies makes comparisons between the treatment group and other groups who received a lesser technological
intervention. Therefore, the studies have been organized to represent their academic rigor
in combination with their relevance to this study’s objectives--measuring technological implementation in classrooms.
As a result, the first section of this literature review focuses on the research that investigates technology implementation in general as well as looking at the role schools’ leadership plays in this process. Studies emphasizing educational technology training and beliefs about technology are presented next. These studies suggest that teachers who received appropriate training are likely to change their beliefs about technology. Third, studies that have implementation as an outcome variable are presented. These studies examine the relationship between the dependent variable (technology implementation) and independent variables such as access to technology, teachers’ openness to change, contextual factors, perceived usefulness, supportive environment, and training.
Technology Implementation & Leadership
Leadership is often cited as a critical factor in the success or failure of technology interventions. Given this fact, journals focusing on the role of leadership in education were included in this literature review. In fact, the journal “Educational Leadership” was independently searched using the following terms: “technology” and “empirical.” This effort resulted in one article, “Let’s Test the Power of Interactive Technology” by Alfred Bork (1986). Bork’s article discusses methods for investigating the possibility that computer technologies can improve education in the US. One point that is made in this article is that an empirical approach should be used for these purposes. This theme is common in much of the educational technology literature in general and as stated above,
the grant that funded the IMPACT intervention was based on these principles: Title II D of the No Child Left-Behind Act (Education, 2000).
The search undertaken for this study did provide one article that was helpful in providing a description of what contributed to some teachers learning about a particular technology. Using the qualitative grounded theory approach to data collection, Granger, Morbey, Lotherington, Owston and Wideman (2002) used interview data from personnel at all levels (administrative, teachers, students) of four schools to identify factors that contribute to Information and Computer Technology (ICT) implementation. Specifically, this research focused on two questions: What factors contributed and deterred teachers from implementing ICT? How did teachers interact with ICT in practice?
Initially, researchers began performing interviews at sixty schools across Canada, but for the purposes of this paper selected only those schools which were engaging in innovative practices. The final four schools provided two learning environments
qualified as having large English as a Second Language (ESL) populations. Each school began instruction in Kindergarten and their populations were similar, but the top grades in each of the schools were not consistent (5, 6, 8, and 9). It was assumed that different ages of student populations will provide unique challenges related to technology
implementation and appropriateness of technology.
Qualitative codes were developed from three main coding stems: Ways of
Learning, Individual Characteristics, and Environmental Factors. Ways of Learning was defined as both formal and informal learning opportunities. Individual Characteristics incorporated educational background, experience, technology skill levels, beliefs and
goals, and resistance to technology. Environmental Factor codes were attributed to those structural elements such as logistics of time and resources, community climate (as it relates to the teacher administrative relationship, and teacher student/parents
relationships).
Granger, et al. (2002) found that when logistical organization is lacking, implementation is hard to achieve for teachers. Time and technical expertise were two specific logistical considerations identified by the participants in this study. Teachers said that it was helpful to have the freedom to explore new lessons within a relaxed atmosphere in which they could take risks with the delivery of their subject matter. Administrative roles were cited as providing access to situations where teachers could collaborate on lessons, especially when the administrative team (particularly principals) had a clear goal, or “vision” about technology use within their school.
The authors suggested three necessary conditions for ICT implementation: first, teachers must have access to technological resources, which includes technical support to trouble shoot problems that may arise. Second, there must be a clear and stated
commitment from administrative team leaders and teachers within the school to
implement ICT methods. This includes the opportunity for teachers to take risks when implementing technology-rich lessons. Third, school communities need to be able to identify and implement ICT use that best benefits their particular school community. Although national programs may assist in bringing different technologies to these schools, the teachers and administrative teams at the particular schools should identify those technologies most appropriate for their school community.
Pasapia (1994) investigated four technology intensive schools using observations and interview data to identify the determinants of successful use of technology. The school in this qualitative research included one rural high school, a suburban middle school, an urban elementary school and an urban middle school. Each school included had to meet three criteria. First, they were required to be considered technology rich-environments. Second, they needed to have a “backbone” of network availability (connected to some network). Third, their school-wide curriculum objectives stated that they needed to use technology to support higher order thinking skills. Teachers and administrators in these four schools were solicited for information on this topic in a cross-sectional data collection. No details about the timing of the data collection were provided in the paper.
After reviewing these data, Pasapia found that in these four schools there were several determinants for successful implementation. He found that the schools needed to have a high tolerance for change. This adaptability is relevant to technological change (in the time of this article, 1994) because of the newness of computer and technology integration. Few schools had pioneered technology integration in this manner, never mind incorporated educational technology in their school-wide objectives. One overarching component in many of the determinants found in Pasapia’s research is the role of principals and other, less formal, leaders. The list of determinants is long and includes both enablers and deterrents to implementing technology.
Teachers reported that technological leadership could have come from system level leaders, principals, or a group of innovative colleagues. These educational
technology leaders presented a vision on how technology should be integrated into their educational activities that influenced the overall expectations for teachers. Pasapia also found that their technology purchases and decisions were driven by instructional needs and based upon a strong rationale for purchasing. This avoids whimsical purchases based on unfounded need for technology.
Leadership was also responsible for the development of a comprehensive plan which needs to account for the many challenges as the technology becomes more complex. This plan will help when making purchasing decisions and when identifying resources to provide for the needed technological support affiliated with educational technology (such as technology facilitators). Pasapia’s research found that school leadership enables both the opportunity for collaboration between teachers, but also the needed additional planning time for teachers new to technology integration and the training affiliated with implanting a new technology.
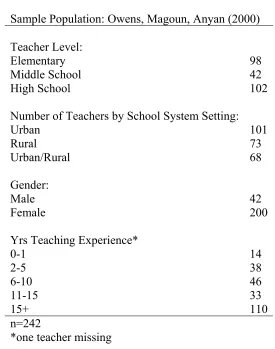
Owens, Magoun, & Anyan (2000) surveyed 242 teachers (48% return rate) in three separate school districts (two in California, one in Texas) using the Teachers’ Attitudes toward Technology (TAT) instrument to measure attitudes. Table 1 provides the descriptive breakdown of this sample.
Table 1
Sample Population: Owens, Magoun, Anyan (2000) Teacher Level:
Elementary 98
Middle School 42
High School 102
Number of Teachers by School System Setting:
Urban 101
Rural 73 Urban/Rural 68 Gender:
Male 42
Female 200 Yrs Teaching Experience*
0-1 14 2-5 38 6-10 46 11-15 33 15+ 110 n=242
*one teacher missing
Using semantic differential response options the TAT scale used was comprised of ten subscales investigating the utility of the following technologies: email (teacher and student), Multimedia (teacher and student), productivity using technology (teacher and student), World Wide Web (teacher and student), usefulness of email for the classroom and usefulness of computers. This semantic differential scale used a 1 – 7 and 1 – 5 range where 1 was least favorable and 7 (or 5) was most favorable. During analysis, both scales were centered on zero providing scores ranging from -3 to +3 and -2 to +2. The
authors used Friednam’s nonparametric two-way analysis of variance by ranks test to make comparisons between the demographic groups and their mean attitude scores.
They found that there were significant rank differences (p < .01) in the teachers’ attitudes toward technology among the three types of school districts with urban having the most positive attitudes, rural having the second most positive, and urban/rural district having the third most positive attitudes. Examining grade differences, there was a near significant difference (p = .08) in attitudes toward technology (rankings: 1st - middle school, 2nd - high school, 3rd - elementary school). A significant difference in attitudes was present across the years of teaching experience that revealed teachers with 0 – 1 and 11 – 15 years of experience had the most positive attitudes toward technology. Of the specific subscales, no statistical tests were performed identifying differences between levels and across the demographic subgroups simultaneously, but email’s usefulness in the classroom was by far the lowest.
This article provides a nice cross-sectional and descriptive representation of teachers’ attitudes toward technology. Unfortunately, they did not attempt to nest the teacher-level data at the schools-level. This may have been the result of the small number of schools under investigation, but the specific number of schools was not
provided in the article. Also, examining this sample there was an apparent over sampling of women. This may not be actual situation, but data was not presented suggesting that the actual gender imbalance in these school systems was reflected in the sample, or that it followed a larger trend.
Training & Beliefs
Wetzel (2001) looks to identify three different ways in which technology is implemented through planning, creating instructional materials, and using technology based tools and tasks with students. Wetzel’s study focuses on a technology
implementation model: ST3AIRS. The ST3AIRS model that is based on a list of inclusive technology facilitative components including; Staff development, Time to learn to how to implement technology; Qualified trainers of technology implementation; Transition time that enables teachers to try technology out, among others. Wetzel failed to elaborate on whether the teachers who provided data were working within schools that were receiving any particular infusion of technology, or what the model means to his study. The
ST3AIRS model lists components that have been discussed in the field of IT literature, though the terminology differs from study to study
Wetzel (2001) intended to study those influential factors associated with the implementation of instructional technology and how instructional technology influenced teachers’ pedagogy. To do this he used an “empirical multiple case-design” that
examined five middle school science teachers in one suburban Virginian school for one year. This methodology included three interviews and used a “dominant – less dominant qualitative quantitative approach to limiting associations” (Creswell, 1994). Wetzel suggests that this study used a limited, yet highly in-depth interview approach and analysis to develop a richer picture that would only be replicated by adding more
subjects. The results represent more of a limited and not such a highly in-depth picture of the process related to technology implementation for these teachers.
The five teachers studied worked within a suburban Virginia middle school of 750 students (70% White, 20% Black, 5% Hispanic, 5% other). All teachers taught science and were five of the nine science teachers in this particular middle school. They averaged 22.8 years of teaching experience (lowest number of years teaching was 11) and four of the five were White. Wetzel did not report gender and it is assumed that they were all male. It is clear that this sampling of science teachers hardly represents the complexity of implementing technology within school settings. Wetzel did not preface his article by stating that he was interested in how “experienced” teachers implemented technology. This would have been more appropriate. Also, since the teachers are all from the same subject area, it is hard to expand the results of this study beyond science, which Wetzel will suggest below.
Wetzel found that four of the five teachers concerns about implementation of technology decreased over the year. Despite this drop in concerns, he reported that the teachers all had concerns about access to technology although their participation in the process (what specific process is not defined in the results) reduced their concerns (not specified). He also found that teachers reported changing to a more student-centered teaching approach and that they were more supportive of technology use in the
classroom. Lastly, Wetzel found that collaboration among teachers in the study and the researcher instilled a sense of partnership that resulted in a successful change in
pedagogy. This final outcome is somewhat confusing as this study was not described as action research and the role of the researcher was assumed as objective. The researcher’s role should have been more clearly defined.
What can be taken from this study is the finding that teachers changed their pedagogy through this intervention (whatever that was exactly) to a more student- centered methodology. This study looks to specify the ways in which teachers change their behavior by looking at three very clear uses of technology in their preparation, creation and implementation of instruction. Wetzel’s failed to operationalize these constructs limits the findings. There is a need for the clear definition of outcomes that are relevant to technology implementation in classrooms.
A large portion of the studies in the educational technology implementation literature focus on a particular subject area. Math and Science classes are the two most abundant topics of this niche. Gningue (2003) adds to this literature by researching the effects of long-term versus short-term technology training for math teachers. His results section is limited to the six item survey administered before and after treatment to the subjects is the focus of his results section.
Gningue uses a small sample of both middle and high school math teachers in his study and breaks them into two groupings: long-term (6 middle and 6 high school) and short-term (11 middle school only) training. His sampling is problematic because he compares two groups from dissimilar grade levels. The long-term training took place in a university course that lasted a traditional semester of 15 weeks (or 45 hours). The short-term training took place within the subjects’ middle school and consisted of 3 workshops, lasting 7 hours. Both trainings included instruction on various technologies. The long term training focused on two: T183 graphing calculator and the Geometer’s Sketchpad,
while the short-term training addressed these two technologies plus Virtual Tiles (an Algebra manipulative).
As you can see from the items below, Gningue primarily looked at whether the use of a graphing calculator is viewed favorably or unfavorably, instead of conducting a comprehensive investigation about teacher attitudes toward technology. Relying on the individual items from this survey, Gingue limits his ability to look at the teachers’ overall attitude about relative technologies. His study examines only the favorable/unfavorable attitudes of the teachers regarding graphing calculators and avoids several of the other technologies. It would be helpful to have a more comprehensive look at teacher attitudes in this instance, mostly to make distance-relative relationships between the technologies they are using, graphing calculators, and the mathematics subject that they teach. The survey was administered in its entirety to the teachers in the short-term treatment before the workshop and after the conclusion of the workshop on the second day.
For those teachers in the long-term treatment, it was administered at the beginning and the end of the semester. Gnigue analyzed the responses of the teachers in each treatment group using t-test analysis of pre and post scores. It is assumed that the small sample size limited the author’s ability to perform more robust statistical analyses of the data. Below is a summary of his findings as they relate to the specific items listed above.
Gningue’s examined the two groups attitudes toward calculators specified use to check workand noted that the participants’ attitudes became more positive, but that only the attitudes of participants who received long-term training showed a statistically significant change (p = .027). Although, when combining all of the participants in this
study, the attitude change retains statistical significance (p = .032). This greater exposure to training may be further investigated to learn more about the effects of familiarity with attitude changes. The second finding that he makes looks specifically at the use of graphing calculators as a tool to solve problems. Here the participants changes in attitudes are not statistically significant, in fact, the short-term group’s mean response rate was exactly the same both before and after treatment. This could reflect a number of possibilities, one of which is that teachers entered the training with high levels of
familiarity and skill on graphing calculators. The article did not elaborate on this point. Results for Gningue’s third research question showed a tiny increase in the long-term subjects’ mean response and a negative change from the short-term group. It would have been helpful to have more information regarding the treatment which the teachers
participated in as teaching “the experimental nature” of mathematics was not stated as a major objective of the treatment. Also, this may reflect a number of things including a misunderstanding of the question. His fourth item is negatively worded and asks whether a graphing calculator enhances student learning and understanding of concepts in math and science. Although neither group’s change in attitudes was statistically significant and the short-term training group’s mean score decreased. Teachers in the long-term training did not see the calculator as enhancing the standard practice of learning mathematics, which reflects that despite their training and presumed understanding of how to incorporate the tool into their class activities, they did not feel that it adds anything to the process of learning mathematics. His fifth item on the survey asked whether students lacked the ability to work on a graphing calculator. Although responses
from both groups of teachers reflected a positive shift, only the long-term training group’s responses reflected statistically significantly change (p = .043). The difference between the two groups may be attributed to the elaboration of techniques for calculator integration in the long-term training, equating a difference in treatment. His last question asked whether or not students taught to use technology will rely on the technology and lose their ability to think. Both groups showed a decrease in their mean response to this item, but neither groups change was statistically significant. It is important to note that the item does not specify “calculators,” but instead focuses their response on technology in general. This reflects that the trainings received by the teachers not only provided familiarity with a particular technology, calculators, but it also may have influenced teachers’ attitudes toward technology in general according to the change in attitude. One area in which Gnigue should extend this study is the examination of training efficacy for the short-term participants. Recognizing the negative change in participants’ attitudes for student use and the potential experimental use of the graphing calculator, as well as, no real change in the overall difference in attitude or using a calculator as a problem solving tool may reflect an issue in the training that was provided for the short-term participants.
Gningue’s findings attempt to address the issue of appropriate technology training for teachers within the framework of mathematics and the use of graphing calculators. Following the trainings provided, teachers’ attitudes toward calculators as a
complementary teaching tool became increasingly positive. This technology specific training also affected their mean scores toward technology in general (although not statistically significant). The occurrence of negative changes in teacher responses could
reflect that the training was viewed as ineffective by the teachers who participated. This is something that should be examined more closely by Gningue.
Gningue examines the effect of short-term versus long-term training on the teachers’ attitudes of graphing calculators in the classroom. Two important findings of this study are related to the overall attitude changes of training participants and the specific attitude change related to student use of the graphing calculator in the group that received the long term training. As mentioned above, although not statistically
significant, teachers’ attitudes toward technology in general shifted positively as a result of their calculator training regardless of the training duration. Gningue’s mean scores support Beyerback, Walsh & Vannatta’s (2001) study on the effects of training as it relates to attitudes toward technology. These studies place pragmatic comprehensive training at the core of technology implementation.
Beyerbach, Walsh & Vannatta (2001) examined four areas related to a
programmatic change in a university teacher training program. These researchers looked at the impact of specific technology infusion activities on pre-service teachers, their perceived proficiency using technology, perceptions about the treatment, and beliefs regarding the importance of education technology as a teaching tool.
This study followed two cohorts of pre-service teachers through their completion of a teacher training program and used an action research approach to optimize the applicability of activities for appropriate teacher technology training. This research uses a pre-post design which compares similar groups with large sample sizes. Due to the action research approach of the researchers, the treatment was not implemented at the
same time and was also not implemented consistently due to the researchers’ interests in tailoring the treatment to the subjects based on the feedback.
The first cohort began with students who enrolled in three classes (N=60) during the Spring semester with the second cohort encompassing all students entering into the teacher-training program in the Fall semester (8 classes, N=300). Pre-treatment surveys were administered to all subjects involved in the study and complemented an action research approach which utilized focus groups to create thematic frameworks and
consistent analysis of post surveys administered following the completion of courses and specified activities within those courses. For the two years of this study, analyses of all data were conducted by the faculty who instructed courses and worked within this
department. This could lead to some bias on the part of the researchers and may force the results to be considered somewhat anecdotal in nature. Furthermore, surveys were
completed by faculty involved, but are not discussed upon within this paper.
It is important to recognize the implications of the action research approach when trying to understand the consistency of treatment within this study. Continuous feedback through surveys, focus groups and faculty discussions prompted continuous refinement of the treatment and enabled the activities to become more directed toward the goals and objectives established during the project’s creation. Utilizing a variety of measures within this study is a great source of enrichment to the data that is presented. Pre-post surveys were administered to pre-service teachers to measure technology proficiency, use/integration, perceived barriers, training preferences, and impact of grant activities. The surveys used were generated for the objectives of developing the teacher training and
were also used as descriptive statistics for this paper. Although the findings in this paper are highly supported by qualitative anecdotes, the statistical analysis for this study are limited to descriptive figures. There was no reporting of validity or reliability statistics for the surveys (Vannatta & Reinhart, 1999).
After collecting data on the two cohorts, Beyerbach and Walsh provide four findings. Their findings are based on a complementary paper by related authors Vannatta & Reinhart (1999), which provides results of their surveys. Another paper/presentation provided by Vannatta (1999) was not available..
First, Beyerback, et al. conclude that following completion of the program that was focused on appropriate technology usage, pre-service teachers have a better framework to conceptualize the use of technology in the classroom. Students rated the degree to which specific activities had an impact on their understanding of technology integration. The majority of students rated five of the activities provided as having significantly contributed to their understanding. This finding was corroborated by the focus group of students used, but not to the same extent. Some of the focus group
participants still viewed technology activities as add-ons to regular curricula (Vannatta & Reinhart, 1999). The authors identified this discrepancy; “Students understood the concept of integration, but had trouble expressing a vision of a technologically rich classroom” (p. 116). This may reflect the sample of pre-service teachers as limited in their experiences with actual classroom environments. The impact on the student sample is seen below in other conclusions reached by Beyerbach, et al. (2001).
Second, Beyerback, et al. claimed that the pre-service teachers have a better understanding of how to incorporate technology in a constructivist environment.
Following course activities which centered on the implementation of technology-related activities, the pre-service teachers reported that this exposure increased their
understanding of technology integration. The pre-service teachers rate poster sessions of
technology-rich lessons (90%), Power Point demonstrations by instructors (60%) and observing the process of developing technology-rich lessons (60%) highest in assisting in their understanding of technology integration. These analyses provide a reaction from
the pre-service teachers, which does not necessarily translate to classroom
implementation. Initially, it was proactive to provide the pre-service teachers with training necessary to implement the methods above, but these results were limited by their inability to project success for the students within actual classrooms. Influences upon the students within their professional school setting may not promote technology usage or provide appropriate resources. Nonetheless, the project provided aggressive training for students.
Third, Beyerback, et al. concluded that pre-service teachers are better able to use technology in an empowering manner. As a construct, empowerment is often difficult to qualify. In the structure of this study, it may be best summarized as each student’s level of confidence in implementing a technology rich lesson. Utilizing the action research approach of this project, the researchers found that tailoring the project to the feedback of the pre-service teachers resulted in a significant increase in technology empowerment. The students involved in this study felt strongly that they could effectively implement
technology in their future classroom instruction. The researchers measure empowerment by the perceived ability of the pre-service teachers’ reported understanding of
instructional methods of technology integration. Their findings are supported by anecdotal evidence from the qualitative components of this study (focus groups & open-ended questionnaires). The researchers included the following examples of student teacher reactions to the training they participated in:
‘I thought the teacher would assign a paper and the students would type it,’ and ‘I only used technology for word processing and e-mail’ were
characteristic statements. Students said their vision of technology had ‘drastically changed.’ They saw technology as ‘breaking down barriers of geography.’ They commented on using technology as a resource for professional development, for example, ‘I found resources for lesson plans and learning centers.’ Students commented that they had a growing
repertoire of technology infusion techniques including Internet use, spread sheets, database presentation and multimedia software, subject specific software, and list-serves. They described how this expanded their vision of activities they might use to support their own students' learning (p. 37).
On the perceived competence item, the scores rose from 15.9% to 68.9% (p < .001), which is consistent with the goals of the year two participants. Similar to the last finding, the focus was on the pre-service teachers’ perceptions of competence without application in an actual classroom. There is no direct relationship to implementation