ENERGY CONSUMPTION GUIDE
Saving energy in schools
A guide for headteachers, governors,
premises managers and school energy managers
■
Reduce energy costs and
environmental impact
■
Compare energy performance
with benchmarks
■
Implement an energy efficiency
action plan
1
INTRODUCTION
3
Energy management
3
Good housekeeping
3
What are benchmarks?
3
2
HOW DOES YOUR SCHOOL COMPARE?
4
The benchmarks
4
Factors affecting energy consumption
4
3
AN ENERGY ACTION PLAN
6
Action plan
6
The school energy manager
6
Getting started
7
Key factors
7
4
WHERE ENERGY IS USED
7
Consumption patterns
7
Fossil fuels
7
Electricity
8
5
MONITORING
9
Where energy is wasted
9
Monitoring
9
Fuel prices and climate
9
Hours of use
9
6
FURTHER ASSISTANCE
1 0
REFERENCES AND FURTHER READING
1 1
1 INTRODUCTION
This Guide suggests ways to improve energy efficiency in schools. It is written for individuals with responsibility for the day-to-day running of a school, purchasing of fuel and long-term planning and budgeting for energy costs. The Guide will, therefore, benefit headteachers, governors, premises managers and energy managers. The Guide explains the benefits of being energy-efficient. It outlines where energy is used in schools and where savings can be achieved. It provides information by which the energy performance of a school can be compared against benchmarks for similar schools. This will give an indication of the level of savings that might be achievable. Benchmarks are given for energy consumption and energy cost.
Sources of further help, together with references and suggested further reading are shown on pages 6, 10 and 11.
ENERGY MANAGEMENT
All schools are responsible for managing their energy, although it is likely that most schools have historically given little attention to controlling energy costs. Changes brought about in the funding and management of schools present an opportunity to give energy management a higher priority. Energy is one area where costs can be reduced, while maintaining or even improving the school environment. Apart from reducing energy expenditure and conserving non-sustainable resources, being energy-efficient also reduces emissions of carbon dioxide (CO2), a contributor to
climate change.
GOOD HOUSEKEEPING
The way in which staff and pupils use a school can have a significant effect on its energy bill. By adopting good housekeeping practices, such as
switching off lights when not required, closing windows and regular checking of heating control settings, energy costs can be cut by at least 10%. Potential savings range from a few hundred pounds a year in a small primary school to several thousand pounds in a large comprehensive school. Savings from good housekeeping measures should be the first aim, as they do not involve any capital expenditure and yield immediate results.
WHAT ARE BENCHMARKS?
Benchmarks provide representative values against which you can compare the school’s actual energy performance. Comparison with benchmarks of annual energy use per square metre of floor area or cost per pupil will permit an assessment of energy efficiency to be made and enable remedial action to be taken.
This Guide introduces good practicebenchmarks based on data from an energy survey
commissioned by BRECSU in 1997 as part of the Department of the Environment, Transport and the Regions’ (DETR’s) Energy
Efficiency Best Practice programme. The survey was based on the 1995/96 energy records of over 2000 schools from 18 local education authorities.
Good practicebenchmarks set an energy performance value equalled or bettered by the top 25% of performers in the 1997 survey.
By adopting good
housekeeping habits
energy costs can be
cut by at least 10%
2 HOW DOES YOUR SCHOOL COMPARE?
THE BENCHMARKS
Table 1 is intended to help you make a quick assessment of your school’s energy efficiency by comparing your energy costs and consumption levels with the benchmarks on a £/pupil and kWh/m2basis. The £/pupil performance indicator
was chosen because school funding is generally allocated as £/pupil.
The benchmarks are designed to encourage the lower 75% to make improvements, aiming towards the good practicebenchmarks, while also
suggesting that the top 25% of performers should not be complacent. Wherever a school stands in comparison to the good practicebenchmarks, there will always be room for improvement.
FACTORS AFFECTING ENERGY CONSUMPTION
If the school’s energy performance differs greatly from the benchmarks, don’t become too alarmed. Consider the reasons for the differences, which are not necessarily a direct reflection of the school’s energy efficiency.
The 1997 survey identified five factors that significantly influenced energy consumption.
■ Occupancy levels. In general, the more efficiently a school utilises its space, the lower its energy costs per pupil. For example, where there has been a decline in pupil numbers, the average heated area per pupil will increase and so energy costs per pupil will inevitably rise. It will not always be possible to close off classrooms or buildings, but where it is, such actions can lead to valuable energy savings. DfEE’s publication BB82[3]provides useful data
to analyse use of space.
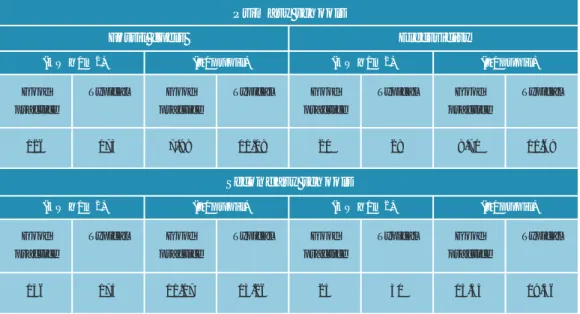
Table 1 Benchmarks for energy consumption (calculated from the 1997 survey) based on mean costs of 1p/kWh for fossil fuels and 7p/kWh for electricity
Good Typical Good Typical Good Typical Good Typical practice practice practice practice
126 173 7.98 11.18 20 28 8.70 11.69
Good Typical Good Typical Good Typical Good Typical practice practice practice practice
136 174 11.07 15.26 24 30 15.53 19.56
Primary schools
Fossil fuels Electricity
(kWh/m2) (£/pupil) (kWh/m2) (£/pupil)
Secondary schools
(kWh/m2) (£/pupil) (kWh/m2) (£/pupil)
There are also benchmarks for CO2emissions, expressed as carbon (C) for consistency
with other data. For example, the good practicebenchmark for emissions from fossil fuels and electricity in primary schools is 9.8 kgC/m2(equivalent to
35.9 kgCO2/m2), and for secondary schools 10.9 kgC/m2(40 kgCO2/m2). The
Department for Education and Employment’s (DfEE’s) BB87[1]gives target values for
CO2for both new and existing schools.
Definitions
Good practicebenchmarks represent the energy performance of the top 25% of schools in the 1997 survey.
Typical benchmarks are the average energy performance of all schools in the 1997 survey.
The benchmarks take into account the regional weather differences and have been adjusted for a baseline of 2400 degree days[2].
HOW DOES YOUR SCHOOL COMPARE?
■ Additional facilities. Additional facilities, such as swimming pools and sports halls, will result in a significant increase in energy consumption. Guidance on energy use and costs can be found in Energy Consumption Guide 51, ‘Energy efficiency in sports and recreation buildings: a guide for owners and energy managers’[4].
Typically, a 20% increase in the school’s overall energy consumption can be experienced.
■ Age of school. The influence of this is less pronounced. Whenever your school was built, there are schools of a similar age that come into the top 10% of the energy performance and others that come into the bottom 10%. However, a higher than average proportion of the better energy performers are newer schools.
■ Hours of use. Extending the hours of use will increase energy consumption. For example, two hours a day for extra curricular activities or for community schemes is likely to increase annual energy costs by about 10%.
■ Size of school. It has been shown that larger schools tend to be more energy-efficient. The larger-sized junior schools (over 400 pupils) can use 25% less energy per pupil than equivalent small junior schools (less than 200 pupils). This is probably due to the effects of higher pupil densities.
A school with catering facilities may have the fuel used in the kitchen included in the rest of the school’s energy consumption. Typically, this will result in an increase in energy consumption of between 7% and 10%.
So, if you have a small, old school with high levels of extra curricular use, you are likely to have higher than ‘typical’ energy costs. Conversely, if your school is large and modern you should expect to have lower than ‘good practice’ energy costs.
A more sophisticated method (ie the normalised performance indicator (NPI) method) for assessing the energy efficiency of your school is explained in the Introduction to Energy Efficiency booklet – ‘Building Energy Efficiency in Schools – A guide to a Whole School Approach’[5]. It gives a more accurate rating of
energy efficiency and is the method commonly used by local authorities that have energy management units (EMUs). If the NPI approach is adopted, you should still use the benchmarks in this Guide.
The NPI method takes account of the fact that energy consumption is affected by the external climate, so energy consumption will vary on a regional and annual basis. The recognised way of accurately comparing one year’s energy performance with another is to use degree days[2]. The baseline for the benchmark calculations
in this Guide is 2400 degree days.
?
How does your
school compare
Fuel tariff s
Although more favourable tariffs can result in lower cost, this, by itself, does not lead to improved energy efficiency. Lower costs should result from lower consumption.
3 AN ENERGY ACTION PLAN
ACTION PLAN
You can start reducing the energy costs of your school by implementing an ‘energy action plan’. Although the plan will vary from school to school, it is likely to consist of actions and activities to monitor energy use, analyse data, identify areas of high consumption, implement good housekeeping measures and recommend energy efficiency improvements. An ‘energy survey’ should be considered for inclusion in the energy action plan. This involves going round the school and making a list of energy-consuming equipment and its use.
THE SCHOOL ENERGY MANAGER
Newly designated school energy managers can readily make significant energy savings when the school buildings or boilers are in a poor state. The worse things are, the easier it may be to find ways to improve them. Savings of 10-15% are readily achievable in most schools and it is not unknown for a conscientious manager, teacher or governor, acting as energy manager, to reduce a school’s energy bill still further[6,7].
Wherever your starting point, improvement is always possible by:
■ motivating staff and pupils to adopt good housekeeping practices
■ ensuring that the heating system is running at optimum efficiency and that there is a regular programme of checking thermostats and time switch settings, boiler maintenance and so on
■ identifying where investment can achieve worthwhile energy savings, eg more energy-efficient light fittings, or zoning and better controls for the heating system.
Headteacher School energy manager Caretaking staff Energy monitors
Checklist for implementing a successful energy action plan
■ Gain the support of the headteacher and governors.
■
■
■ Appoint a ‘school energy manager’. This could be a school administrator, bursar, school manager, teacher, caretaker, governor or interested parent.
■
■
■ Secure the cooperation of the caretaking staff. Their experience is
important in the setting up and execution of an energy action plan.
■
■
■ Nominate pupils to act as energy monitors in each class. They will be responsible for turning off lights and equipment, closing windows, etc.
■
■
■ Involve the whole school. This may take the form of project work, theatre groups, poster competitions, etc to increase energy awareness
among pupils and staff.
■
■
■ Identify and secure support and funding.
■
■
GETTING HELP TO IMPLEMENT YOUR ENERGY ACTION PLAN
Local education authority (LEA)
Under local management of schools (LMS), most schools remain dependent on their LEA for capital investment. Schools should work with the authority to identify energy efficiency investment opportunities that meet the LEA’s financial criteria.
Energy Saving Trust (EST)
EST is a non-profit company set up by the government and the energy companies. The EST is currently running a ‘Schools Cashback’ scheme, whereby schools can qualify for a rebate on installed energy efficiency measures (details are available from CREATE).
EST, 21 Dartmouth Street London SW1H 9BP
Tel 0171 222 0101. Fax 0171 654 2444
The Centre for Research, Education and Training in Energy (CREATE)
CREATE is the national co-ordinating body for energy education. Apart from managing the EST’s Cashback scheme it produces literature, equipment and software for schools; and also provides a free enquiry service for pupils, teachers and managers.
CREATE, Kenley House
25 Bridgeman Terrace, Wigan WN1 1TD Tel 01942 322271
New Deal for Schools (NDS)
The government’s New Deal for Schools (NDS) programme currently offers an opportunity for schools to make bids for funding energy efficiency measures. Details from your LEA or DfEE.
DfEE, Architects and Building Branch Level 7, Caxton House, 6-12 Tothill Street Westminster, London SW1H 9NE Tel 0171 273 6237
AN ENERGY ACTION PLAN
4 WHERE ENERGY IS USED
Figure 1 Typical distribution of energy costs: blue tints – fossil fuels
red tints – electricity (1992 figures adjusted to reflect 1997 fuel prices)
CONSUMPTION PATTERNS
Plotting the consumption of separate fuels for each month throughout a calendar year is a useful and practical way to identify trends in energy use, and may also give clues as to where energy efficiency improvements can be made.
Start as you mean to continue by making sure that the meter readings are taken on the same date of each month. Plot the consumption levels (kWh or units) for each of the 12 months. Although the graphs will be unique for your school building, understanding their shape can help you reduce fuel consumption and energy costs.
FOSSIL FUELS
■ the efficiency of any controls (find out what user controls there are and check that they are set properly)
■ building design (a well-insulated school will consume less energy than a poorly insulated building)?
You would expect fossil fuel consumption to increase during the winter months due to demand for heating. January is likely to show the
maximum consumption, when the school is occupied for most of the month and the heating is on. You would also expect ‘troughs’ during out-of-term periods. However, although the shape of the graph may be as expected, you could
GETTING STARTED
The job of the school energy manager is to compare energy consumption with benchmarks, analyse where energy is being used and try to identify areas where energy costs might be reduced. Check how much the school spends on each fuel and consider how it is used. For most schools it is not possible to establish from fuel bills the breakdown use of each fuel. Figure 1 illustrates a typical energy cost distribution in a school. However, it is realistic to establish from meter readings the heating and lighting costs by examining the seasonal variations in consumption. By comparing consumption in the summer term, when heating is switched off and lighting should take advantage of available daylight, with the peak demand in the winter you can identify from the difference the additional energy consumption required to heat and fully light the school.
KEY FACTORS
The split between heating, hot water, lights, etc will vary markedly from one school to another and will depend on many factors. Of key importance are:
■ design
■ the efficiency of the heating plant, lighting system, etc
■ how well the school is insulated
■ how diligent the staff and pupils are at good housekeeping
WHERE ENERGY IS USED
the consumption for June, when the school is occupied but the heating is switched off. Use this reading as being the base load throughout the year, so that any consumption above this figure in any month can be assumed to be for heating. Now compare the month showing the highest fossil fuel consumption (probably January) with the base load. For an efficient building the base load will be typically 10-20% of the highest consumption. A higher percentage than this is indicative of a high base load, in which case it is likely that the system is operating inefficiently, with either distribution losses, poor control measures, or simply poor housekeeping leading to high energy consumption.
Similarly, if the graph shows a fairly constant high consumption level throughout the coldest months, it is likely that the heating system and controls require investigating. If these prove to be satisfactory then the building’s insulation is likely to be inadequate. At this stage, consult the county architect’s department for advice.
The overall aim should be to reduce fossil fuel consumption by lowering the size of the base load and improving on control measures.
By plotting a graph for the year following the implementation of any improvements to the building or boiler system, you will quickly see whether the measures are effective.
ELECTRICITY
Since lighting makes the highest demand on supplies, you would expect the graph to show increased electricity consumption during the winter months. Don’t expect a dramatic fall during the spring and summer as lighting tends to be on longer than may be actually needed. Bear in mind that pumps for the heating system will also add to the winter electricity consumption.
The base load for electrical consumption takes account of corridor lighting, IT and other office equipment, apart from electrical consumption of equipment used for curricular activities. You can safely assume that the electrical base load is the level of consumption for the same month as the fossil fuel base load.
For an efficient building, the base load will be typically 20% of the highest electrical consumption. A higher percentage than this indicates excessive consumption by lighting, caused, for example, by poor control.
As for fossil fuel consumption, the objective should be to reduce the size of the base load; Good Practice Guide 259[8]offers some good housekeeping
advice that may help.
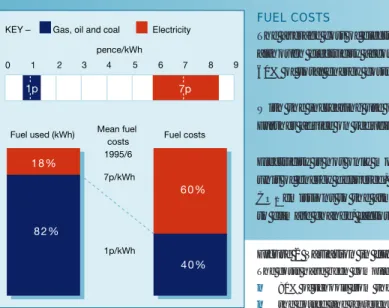
Remember, although the graph for electricity consumption is ‘flatter’ than that for fossil fuels, each unit of consumption is seven times the cost of the equivalent unit of fossil fuels (figure 2).
FUEL COSTS
The average cost of electricity in the 1997 survey was seven times that of gas, oil or coal. So although electricity accounts for just 18% of energy consumption, it is responsible for over 60% of total energy costs.
With the increasing use of information technology (IT), electricity costs are rising fast. Further advice on reducing electrical consumption is given in GPG 259[8].
Electricity is not only more expensive to purchase than fossil fuels. Compared to gas, for a unit of energy delivered, electricity contributes around two-and-a-half times the amount of CO2emissions to the atmosphere during its generation by power stations. CO2contributes
to climate change, factors of which are the greenhouse effect and global warming.
Figure 2 Variation in fuel costs
The costs have been compiled from data collected from the 1995/96 school year.
■ 80% of schools from the survey fall within the coloured bands (data excludes 10% of each extreme).
5 MONITORING
WHERE ENERGY IS WASTED
It is worthwhile undertaking a regular energy walk-round, to check for any maintenance problems, unnecessary waste and future investment opportunities. For this, it is best to ask the headteacher (or deputy), bursar or school administrator, the school energy manager (if different), the caretaker and perhaps an energy specialist from the local authority to discuss plans. See Good Practice Guide 57, ‘Conducting an energy walk-round. A guide for school energy managers, headteachers and governors’[9].)
MONITORING
Measuring energy consumption by taking meter readings is an essential part of managing energy costs. Regular monitoring can be useful to:
■ check fuel bills are correct when authorising payment
■ measure changes in consumption due to the introduction of new plant and equipment or energy-awareness campaigns
■ establish typical weekly or monthly
consumption of electricity, gas, coal, water, etc so that you can spot abnormal consumption
■ check if spending is consistent with budget allocation.
The first step is to find the meters and establish the purpose of each one. Remember that caution may need to be exercised, for example, when meters are housed in areas that are unsuitable for pupils to enter. There may be several electricity meters for different tariffs, ‘head’ meters (used for payment) and sub-meters (to check how much fuel is used in a part of the school). For example, many school kitchens have a sub-meter to enable fuel for catering to be costed separately. Check that meter reference numbers correspond with those on the fuel bills. Start a regular meter-reading programme and consider organising a supervised rota of school pupils to help.
The total deregulation of the gas and electricity markets means that consumers are no longer limited to purchasing gas and electricity from their regional supply or distribution companies. Many schools are already benefiting from deregulation, including most secondary schools. Deregulation creates competition between the supply companies and provides the consumer with greater purchasing options. Schools should take advantage of this situation, by securing the most appropriate tariff or contracts. It is advisable to seek professional help when negotiating for a better tariff structure. Avoid the danger of lower costs per kWh leading to complacency and, even worse, resulting in increased consumption levels. Cheaper tariffs should be used to cut energy costs in conjunction with energy efficiency measures and good housekeeping.
HOURS OF USE
The effect of extending the hours of use of a school can be seen in figure 3. The normal hours of use of your school are not likely to vary much from one year to the next. However, with LMS, more schools are hiring out their buildings. Taking weekly meter readings will allow the average energy cost for the school to be calculated. This can then be used to estimate the amount to charge to cover the cost of heating and lighting during the extra hours of use.
When the heating system is controlled within different areas (zoned), only provide out-of-hours heating to the areas being used, not to the whole school.
FURTHER ASSISTANCE
BRECSU
BRECSU is responsible for implementing the DETRs’ Energy Efficiency Best Practice programme in buildings. BRECSU produces a range of free publications aimed at supporting both energy education and energy management in schools and runs a number of workshops and other events. See the back page of this Guide for contact details and page 11 for suggested further reading.
DEPARTMENT FOR EDUCATION AND EMPLOYMENT (DfEE)
Architects and Building (A&B) Branch of the DfEE provides professional advice on premises-related policies, carries out field work and provides advice and guidance related to good practice in the design and use of school premises.
A&B produces a range of publications including Building Bulletin 70, ‘Maintenance of Mechanical Services’, Managing School Facilities Guides: Guide 1 ‘Saving water’; Guide 2 ‘Swimming pools’; Guide 3 ‘Saving energy’; Building Bulletin 73, ‘A guide to energy efficient refurbishment’, Building Bulletin 79 ‘Passive Solar Schools’; Building Bulletin 83 ‘Schools Environmental Assessment Method’; and Building Bulletin 87 ‘Guidelines for Environmental Design in Schools’. A publication list is available from: Architects and Building Branch, Level 7, Caxton House,
6-12 Tothill Street, Westminster, London SW1H 9NF. Tel: 0171 273 6237.
ENERGY HELPLINE
The Environment and Energy Helpline provides a range of advice on energy efficiency. Operated by DETR, the Helpline provides advice on how to save money and improve efficiency. The service is free and, although primarily aimed at small and medium businesses, can help schools with energy problems. The Helpline phone number is 0800 585794.
THE CENTRE FOR SUSTAINABLE ENERGY (CSE)
CSE promotes energy efficiency and sustainable energy planning by working with schools, carrying out research work and by providing a wide range of publications, advice and training facilities. CSE, B-Bond Warehouse, Smeaton Road Bristol BS1 6XN. Tel 0117 929 9950.
GROUNDWORK
Esso Young Energy Savers is one of Groundwork’s 30 national regeneration and education
programmes. Specifically trained Groundwork personnel assist groups of primary schools to enhance their teaching of energy awareness and to use pupil’s knowledge to improve energy management at school and in the home.
Groundwork National Office, 85-87 Cornwall Street Birmingham B3 3BY. Tel 0121 236 8565.
USING LOCAL AUTHORITY RESOURCES
Good records and an understanding of how your school uses energy may help you secure help from the local authority. It is also in your interest to ensure that the authority takes the opportunity to incorporate extra insulation, or install energy-efficient equipment as part of any repair or refurbishment work.
Ask your local authority if it has negotiated any bulk purchase fuel arrangement. Try to ensure that your school can still take advantage of such arrangements following LMS, as these can be highly beneficial. Many local authorities have an energy
management unit (EMU) to advise them on the efficient use of energy in local authority buildings, including schools. The precise role of EMUs differs from authority to authority. Many are adapting to meet new needs arising out of LMS.
REFERENCES AND FURTHER READING
REFERENCES
[1] Department for Education and Employment.BB87 ‘Guidelines for environmental design in schools’ (revision of Design Note 17). DfEE, London, 1997 [2] Department of the Environment,
Transport and the Regions. Fuel Efficiency Booklet 7, ‘Degree Days’. DETR, London, 1993
[3] Department for Education and Employment. BB82, ‘Area guidelines for schools’. Architects and Building Branch, DfEE, London, 1996
[4] Department of the Environment, Transport and the Regions. Energy Consumption Guide 51, ‘Energy efficiency in sports and recreation buildings: a guide for owners and energy managers’. DETR, London, 1996
[5] Department of the Environment, Transport and the Regions.Introduction to Energy Efficiency 1, ‘Building Energy Efficiency in Schools. A guide to the Whole School Approach’. DETR, London, 1996 [6] Department of the Environment,
Transport and the Regions. Good Practice Guide 39, ‘Managing energy in schools. A guide for headteachers and governors’. DETR, London, 1991
[7] Department of the Environment, Transport and the Regions. Good Practice Guide 45, ‘Managing energy in schools. A guide for school caretakers’. DETR, London, 1992 [8] Department of the Environment,
Transport and the Regions. Good Practice Guide 259, ‘Saving electrical energy in schools – good housekeeping for lighting, IT and other curriculum-based equipment’. DETR, London (in development) [9] Department of the Environment,
Transport and the Regions. Good Practice Guide 57, ‘Conducting an energy walk-round.
The following Best Practice programme
publications are available from BRECSU Enquiries Bureau. Contact details are given on the back cover.
Energy Consumption Guide
17 Saving energy in schools. The local authority chief officer’s guide to energy efficiency
General Information Leaflets
16 Using solar energy in schools
32 Passive solar design. Netley Abbey Infant School 33 Passive solar design. Looe Junior and Infant
School
General Information Report
47 Controlling energy use in buildings
Good Practice Case Studies
73 Energy efficiency in schools: potential benefits of boiler replacement
94 Energy efficiency in schools. Building Energy Management Systems
95 Energy efficiency in schools – local controls for heating and lighting
100 A teacher as the focus for energy efficiency 101 Energy efficiency in schools – some simple
energy conservation measures 185 ‘Out-of-hours’ use of schools
Good Practice Guides
118 Managing energy use. Minimising running costs of office equipment and related air-conditioning 145 Maintaining the efficient operation of heating
and hot water systems in schools
173 Energy efficient design of new buildings and extensions – for schools and colleges 233 Energy efficient refurbishment of schools
THERMIE maxibrochure
DETR ENERGY EFFICIENCY BEST PRACTICE PROGRAMME DOCUMENTS
New Practice: monitors first commercial applications of new energy efficiency measures.
Future Practice: reports on joint R&D ventures into new energy efficiency measures.
General Information: describes concepts and approaches yet to be fully established as good practice.
Fuel Efficiency Booklets: give detailed information on specific technologies and techniques.
Visit the website atwww.energy-efficiency.gov.uk For further information on:
Buildings-related projects contact: Enquiries Bureau
BRECSU
BRE
Industrial projects contact: Energy Efficiency Enquiries Bureau