Lucrări ştiinŃifice Zootehnie şi Biotehnologii, vol. 41 (1) (2008), Timişoara
THE EVOLUTION OF THE MAIN DEMOGRAPHIC
PHENOMENA IN ROMANIA
EVOLU
ł
IA PRINCIPALELOR FENOMENE
DEMOGRAFICE ÎN ROMÂNIA
ORBOI MANUELA-DORA *
*Faculty of Farm Management, Timişoara, Romania
The trends of the main demographic phenomena provide useful information about
the future evolution of the number and age structure of Romania’s population. The mutations in the social-economic structure of the country have led to a dynamic territorial mobility of the population; at the same time, they have direct consequences upon the socio-demographic structure of the population. In the past years, demographic migration has become a common fact. The young and mature population migrates from the rural to the urban environment, motivated by the living and working conditions in the urban centers. Consequently, the remaining rural inhabitants are mostly old-aged. The aging of the rural population is also caused by a series of demographic and social-economic factors. The economic effects of the demographic evolution will be seen in time and will bring about changes in the various subpopulations (school children, fertile population, inhabitants able to work).
Key words: demography, birth rate, death rate, migration
Introduction
Romania is Europe’s twelfth country in point of size. It covers an area of
238.391 km2 and lies in the south-east of Central Europe. The country’s population
decreased from 22.41 million inhabitants in 2001 to 21.58 million inhabitants in
2006. The average density also decreased from 94.0 inhabitants/km2 in 2001 to
90.5 inhabitants/km2 in 2006.
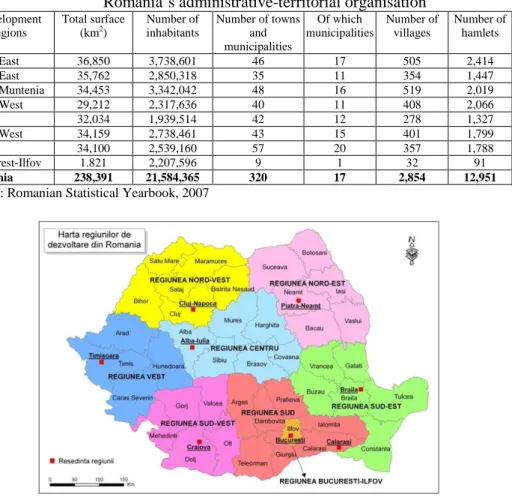
Romania’s territory is divided into hamlets, villages, towns, municipalities and counties. In each county, the local authorities are represented by county councils, local, municipal, town and village councils. (Table 1)
Eight development regions were set as territorial units, each made up of 4-7 counties by the voluntary association of the county councils. These regions represent the framework for the development, implementation and evaluation of the regional development policy and the economic and social cohesion programmes through which it is carried out (Figure 1).
Region 1 - North-East - the largest region, covering 36.850 km2 (15.46% of
Suceava and Vaslui. It borders with Ukraine in the north, Galati and Vrancea Counties in the south (the South-East Region), the Republic of Moldova in the east, Maramures, Bistrita (the North-West Region), Mures, Harghita and Covasna (The Central Region) in the west.
Table 1
Romania’s administrative-territorial organisation
Development regions
Total surface
(km2) inhabitants Number of Number of towns and municipalities
Of which municipalities
Number of villages
Number of hamlets
North-East 36,850 3,738,601 46 17 505 2,414 South-East 35,762 2,850,318 35 11 354 1,447 South-Muntenia 34,453 3,342,042 48 16 519 2,019 South-West 29,212 2,317,636 40 11 408 2,066 West 32,034 1,939,514 42 12 278 1,327 North-West 34,159 2,738,461 43 15 401 1,799 Center 34,100 2,539,160 57 20 357 1,788 Bucharest-Ilfov 1.821 2,207,596 9 1 32 91 Romania 238,391 21,584,365 320 17 2,854 12,951
Source: Romanian Statistical Yearbook, 2007
Figure 1 – Romania’s Development Regions
Region 2 - South-East – borders with the North-East Region in the north, the Central Region in the west, the South Muntenia and the Bucharest-Ilfov Regions in the south-west, Bulgaria in the south, the Republic of Moldova, Ukraine and the Black Sea in the east. It covers 35,762 km² or 15% of the country area and is the second region in size. It consists of the following counties: Braila, Buzau, Constanta, Galati, Tulcea, and Vrancea.
Region 3 - South-Muntenia has an area of 34.453 km2 (14.45% of the
West.
Region 4 - South-West – covers 29,212 km2 and consists of five counties:
Dolj, Olt, Valcea, Mehedinti and Gorj. Generally speaking, it coincides with the old historical region Oltenia within its natural borders: the Danube in the south, the Olt (Romania’s third longest river) in the east, the Carpathians (the Transylvanian Alps) in the north and west.
Region 5 - West - lies on a surface of 32,034 km2 (13.4% of the country’s
area) and is made of Arad, Caras-Severin, Hunedoara and Timis Counties. It is part of the Danube-Cris-Mures-Tisa Euroregion (DCMT), which consists of the four mentioned countries, three Hungarian counties (Bács-Kiskun, Békés and Csongrád) and the autonomous region Vojvodina in Serbia.
Region 6 - North-West covers an area of 34,159 km² and represents 14.3% of the country’s surface. It consists of six counties: Bihor, Bistrita-Nasaud, Cluj, Maramures, Satu Mare and Salaj. It has a strategic geographic position, as it is the gate to Romania from the European Union and Ukraine. Within the national territory, it neighbours the West Region (Banat) in the south, the Central Region (Transylvania-Centre) in the south-east and the North-East Region (Northern Moldavia) in the east.
Region 7- Center, total area 34,100 km2 (14.31% of the Romanian
territory), includes Alba, Brasov, Covasna, Harghita, Mures and Sibiu Counties. It lies within the Carpathians curvature, on the upper course of the Mures and the Olt rivers.
Region 8 - Bucharest-Ilfov, is made of Bucharest – the capital of the country – and Ilfov County. It lies in the central part of the Romanian Plain, on an
area of 1,821 km2, of which 13.1% is the administrative territory of Bucharest and
86.9% belongs to Ilfov County. The two entities are the smallest territorial units of Romania.
Demographically speaking, the main factors that influence the size and the structure of the population are the birth rate, the death rate and the migration. The birth rate is the number of new-borns per one thousand inhabitants in a year. The death rate is the number of the deceased of all age categories per one thousand inhabitants in a year. The natural growth is the difference between the number of the new-borns and the number of the deceased in a year. Migration represents the changes in the population’s domicile.
Materials and Methods
Results and Discussions
The economic and social changes that have taken place in Romania since the 1990’s have led to major changes in the demographic phenomena, and the number and the structure of the population. The constant decrease in Romania’s population has several causes, such as low birth rate, high death rate, and internal and intense external migration. In 2006, Romania had 21,584,365 inhabitants, 96,609 less than 2002. The population has decreased in all the development regions of the country (Table 2).
Table 2 Romania’s population and density in 2002, 2004 and 2006
Development regions Total population Density (inhabitants/km
2)
2002 2004 2006 2002 2004 2006 Romania 21,680,974 21,673,328 21,584,365 90.9 91.2 90.5 North-East 3,674,367 3,738,601 3,732,583 99.7 101.6 101.3 South-East 2,848,219 2,850,318 2,837,834 79.6 79.9 79.4 South-Muntenia 3,379,406 3,342,042 3,312,342 98.1 97.5 96.1 South-West 2,330,792 2,317,636 2,293,895 79.8 79.7 78.5 West 1,958,648 1,939,514 1,927,229 61.1 60.8 60.2 North-West 2,740,064 2,738,461 2,730,132 80.2 80.4 79.9 Center 2,523,021 2,539,160 2,530,818 74.0 74.6 742 Bucharest-Ilfov 2,226,457 2,207,596 2,219532 1,222.17 1,211.7 1,218.9
Source: Romanian Statistical Yearbook, 2005, 2007
On July 1 2006, the North-East was the first of the eight regions as regards population, with 3,732,5583 inhabitants (17.29% of the total population) and a
density of 101.3 inhabitants/km2, which is more than the national average. On the
last place was the West Region with 1,927,229 inhabitants and 60.2
inhabitants/km2, far below the national average of 90.5 inhabitants/km2.
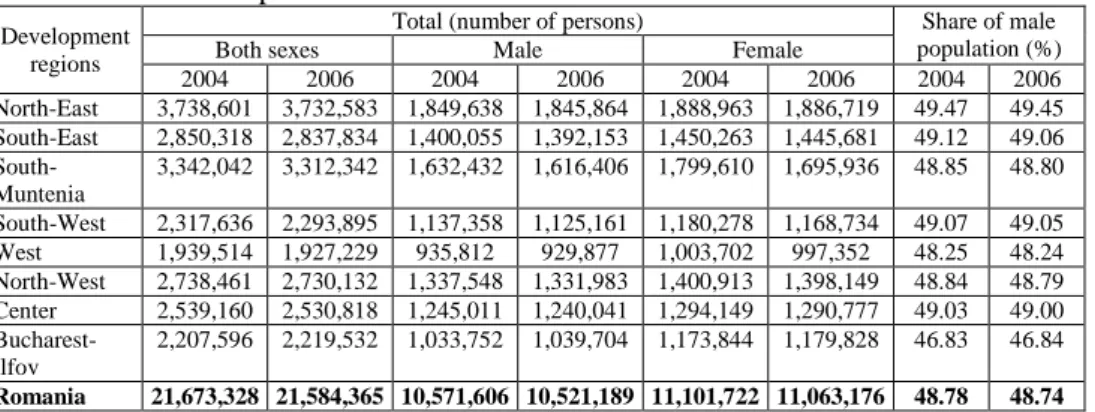
As far as the structure of population on sexes is concerned, on July 1 2006, the male share of the population was smaller than the female one, a situation common to all development regions. In the Bucharest-Ilfov Region, both the male and the female population increased. (Table 3)
Table 3
Population structure on sexes in 2004 and 2006
Development regions
Total (number of persons) Share of male population (%) Both sexes Male Female
2004 2006 2004 2006 2004 2006 2004 2006 North-East 3,738,601 3,732,583 1,849,638 1,845,864 1,888,963 1,886,719 49.47 49.45 South-East 2,850,318 2,837,834 1,400,055 1,392,153 1,450,263 1,445,681 49.12 49.06
South-Muntenia
3,342,042 3,312,342 1,632,432 1,616,406 1,799,610 1,695,936 48.85 48.80
South-West 2,317,636 2,293,895 1,137,358 1,125,161 1,180,278 1,168,734 49.07 49.05 West 1,939,514 1,927,229 935,812 929,877 1,003,702 997,352 48.25 48.24 North-West 2,738,461 2,730,132 1,337,548 1,331,983 1,400,913 1,398,149 48.84 48.79 Center 2,539,160 2,530,818 1,245,011 1,240,041 1,294,149 1,290,777 49.03 49.00
Bucharest-Ilfov
2,207,596 2,219,532 1,033,752 1,039,704 1,173,844 1,179,828 46.83 46.84
Romania 21,673,328 21,584,365 10,571,606 10,521,189 11,101,722 11,063,176 48.78 48.74
Concerning the distribution on the two residential areas, significant differences were noticed among the eight regions in 2006. In the South-East, West, North-West, Central, and Bucharest-Ilfov regions, most of the population lived in urban areas, whereas in the North-East, South-Muntenia and South-West regions the population was mainly rural. In all regions, the share of the male urban population was higher than that of the female urban population. The female population is predominant both in the rural areas and the whole country (Table 4).
Table 4
Population per sexes and residential areas in 2004, 2006
Development regions
Urban (number of persons) Rural (number of persons) Both sexes Male Female Both sexes Male Female 2004 2006 2004 2006 2004 2006 2004 2006 2004 2006 2004 2006
Romania 11,895,598 11,913,938 5,704,297 5,704,872 6,191,301 6,209,066 9,777,730 9,670,427 4,867,309 4,816,317 4,910,421 4,854,110
North-East 1,629,448 1,629,250 786,640 784,991 842,808 844,259 2,109,153 2,103,333 1,062,998 1,060,873 1,046,155 1,042,460 South-East 1,582,142 1,573,520 764,327 758,251 817,815 815,269 1,268,176 1,264,314 635,728 633,902 632,448 630,412
South-Muntenia
1,384,906 1,379,073 667,090 662,689 717,816 716,384 1,957,136 1,933,269 965,342 953,717 991,794 979,552
South-West 1,094,772 1,092,922 531,500 529,591 563,272 563,331 1,222,864 1,200,973 605,858 595,570 617,006 605,403 West 1,235,006 1,223,730 590,761 584,553 644,245 639,177 704,508 703,499 345,051 345,324 359,457 358,175 North-West 1,444,677 1,449,635 694,722 696,026 749,955 753,609 1,293,784 1,280,497 642,826 635,957 650,958 644,540 Center 1,524,022 1,513,670 736,379 730,602 787,643 783,068 1,015,138 1,017,148 508,632 509,439 506,506 507,709
Bucharest-Ilfov
2,000,625 2,052,138 932,878 958,169 1,067,747 1,093,969 206,971 167,394 100,874 81,535 106,097 85,859
Source: Romanian Statistical Yearbook, 2005, 2007
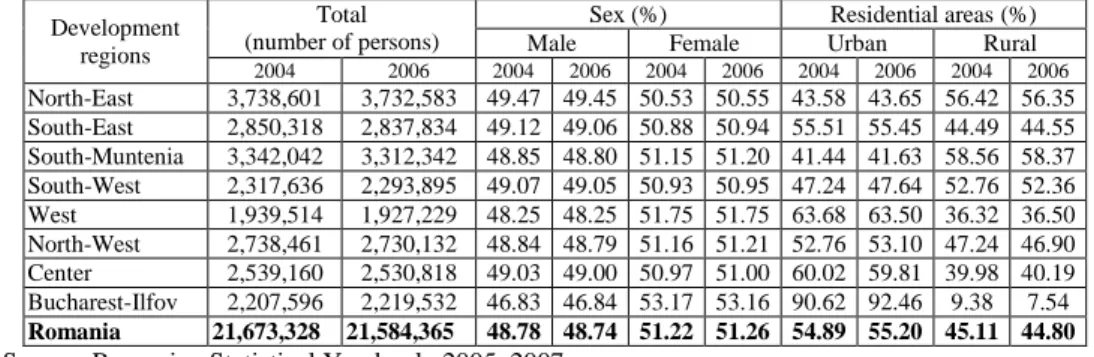
Table 5 presents the large difference between the urban population (55.20%) and the rural one (44.80%) at the national level in 2006. The urban population is increasing, while the rural one is decreasing: South-East – urban population 55.45%, rural population 44.55%, West – urban population 63.50%, rural population 36.50%, Central – urban population 59.81%, rural population 40.19%), Bucharest-Ilfov - urban population 92.46%, rural population 7.54%
Table 5
Population of regions per sexes and residential areas in 2004, 2006
Development regions
Total (number of persons)
Sex (%) Residential areas(%) Male Female Urban Rural 2004 2006 2004 2006 2004 2006 2004 2006 2004 2006 North-East 3,738,601 3,732,583 49.47 49.45 50.53 50.55 43.58 43.65 56.42 56.35 South-East 2,850,318 2,837,834 49.12 49.06 50.88 50.94 55.51 55.45 44.49 44.55 South-Muntenia 3,342,042 3,312,342 48.85 48.80 51.15 51.20 41.44 41.63 58.56 58.37 South-West 2,317,636 2,293,895 49.07 49.05 50.93 50.95 47.24 47.64 52.76 52.36 West 1,939,514 1,927,229 48.25 48.25 51.75 51.75 63.68 63.50 36.32 36.50 North-West 2,738,461 2,730,132 48.84 48.79 51.16 51.21 52.76 53.10 47.24 46.90 Center 2,539,160 2,530,818 49.03 49.00 50.97 51.00 60.02 59.81 39.98 40.19 Bucharest-Ilfov 2,207,596 2,219,532 46.83 46.84 53.17 53.16 90.62 92.46 9.38 7.54 Romania 21,673,328 21,584,365 48.78 48.74 51.22 51.26 54.89 55.20 45.11 44.80
Source: Romanian Statistical Yearbook, 2005, 2007
The low birth rate in our country has certain particularities. The main factors that have reduced it are economic and social. The structure of the employment population has changed considerably and this has led to a greater territorial and professional mobility and a longer instruction period.
market, the difficulty in finding a house are serious obstacles for many couples in starting a family. Most young couples do not have children or postpone having them. This decision is determined by the cultural and psychological background and by the economic and social life of the family.
In 2006, 219,483 children were born, 95,263 less than in 1990, but 3,222 more than in 2004. In 2006, the birth rate was 10.2 new-borns per 1,000 inhabitants, lower than 1990 (3.6‰) and 2004 (10,0‰). In 2006, 258,094 people died, 796 less than 2004 and 11,008 more than in 1990. The general death rate was 12.0 deaths per 1,000 inhabitants. In 2004, it was 11.9‰ an in 1990 it was 6‰ (Table 6).
Table 6 Natural migration/movement of population in Romania in 2006
Development regions
Rates per 1,000 population Still births
Deceased before 1 year of
age Live birth Deaths Natural
increase Marriages Divorces
Romania 10.2 12.0 -1.8 6.8 1.51 5.2 13.9 North-East 11.6 10.8 0.8 6.5 1.54 4.3 15.3 South-East 9.9 11.3 -1.4 6.5 1.82 6.5 13.9
South-Muntenia
9.5 13.1 -3.6 6.1 1.56 5.7 15.7
South-West 8.6 13.0 -4.4 6.4 1.17 4.0 16.1 West 9.5 12.9 -3.4 7.3 1.73 6.4 12.4 North-West 10.5 12.2 -1.7 6.8 1.39 5.3 14.1 Center 10.7 11.4 -0.7 6.2 1.49 5.9 12.6
Bucharest-Ilfov
10.2 11.5 -1.3 9.3 1.35 3.5 9.3
Source: Romanian Statistical Yearbook, 2007
In 2006, the natural growth was –1.8 per 1,000 inhabitants. It had a positive value only in the North-east region: 0.8 per thousand inhabitants. The low birth rate is the result of the economic conditions in general and the lack of medical services in particular, mainly in the rural areas.
In 2006, the highest infant death rate was in the South-West Region: 16.1 deaths (infants less than one year old) per thousand inhabitants, compared to the national average of 13.9. This may be explained by the high level of poverty mainly in the rural areas and the poor education about health and minimum hygiene.
The difference of the death rates between sexes has been the same in the past years, a fact best reflected in life expectancy. It has been noticed that both at the national level and in the residential areas, life expectancy is seven years longer for the female population (Table 7).
In Romania, in 2004-2006, life expectancy was 72.22 years. In these years, life expectancy for women was 75.80, while for men it was only 68.74. Life expectancy is higher in the urban areas than in the rural ones: 72.98 – 71.23.
migration, the urban-rural flow (28.12%) is larger than the rural-urban flow (22.54%), but smaller than the urban-urban flow (30.18%).
Table 7
Average life span per sexes and residential areas in 2004-2006 (years)
Development regions Per sexes
Per residential areas Urban Rural
Total Male Female Total Male Female Total Male Female North-East 72.39 68.86 76.11 73.12 69.71 76.53 71.68 68.09 75.69 South-East 72.35 68.78 76.10 72.95 69.43 76.49 71.42 67.80 75.47 South-Muntenia 72.07 68.45 75.85 72.72 69.31 76.11 71.48 67.72 75.57 South-West 72.00 68.85 75.27 72.97 70.03 75.94 70.91 67.64 74.49 West 71.46 68.17 74.76 71.69 68.42 74.91 71.04 67.73 74.53 North-West 71.38 68.01 74.86 72.15 68.78 75.51 70.50 67.11 74.18 Center 72.48 68.88 76.24 73.26 69.62 76.90 71.34 67.78 75.33 Bucharest-Ilfov 73.98 70.42 77.28 74.24 70.73 77.44 71.35 67.35 75.59 Romania 72.22 68.74 75.80 72.98 69.56 76.34 71.23 67.69 75.13
Source: Romanian Statistical Yearbook, 2007
In 2006, although the national migration balance was zero, the West (+4,196), North-West (+730) and Bucharest-Ilfov (+10,269) regions were the only regions with a positive migration balance.
Together with domestic migration, external migration is a very important factor for the population structure. The changes in the Romanian political and social system has made it possible for the population to immigrate in the EU states, USA and Canada.
The national statistics indicate the most legal emigrants have had a high education and qualification level, thus proving the selective character of the immigration policy in the destination countries.
Conclusions
The decrease of the population in the past twelve years has been caused mainly by the negative natural growth, a consequence of the higher death rate, the smaller birth rate and the migration to other parts of the country or abroad. Although in the last years there has been some concern regarding health improvement and providing health care services, the trends of the death rate are not encouraging at all.
The urban population is concentrated in the developed urban centers. The migration from cities to villages is the result of the people’s necessity to provide for their basic needs, not only because the industrial sector in which they worked (situated mainly in the urban areas) is now undergoing a massive reorganisation process, but also because the farmland is being restored, as stipulated by law.
population is also caused by a series of demographic and social-economic factors. The most important factor that has caused a reduction of the rural population is migration, a complex demographic, social and economic phenomenon with major implications in the evolution of the number of rural inhabitants and the rural demographic structure. Another demographic factor with a major impact on the dynamics of the rural population and communities in the region was the negative natural growth.
The economic effects of the demographic evolution will be seen in time and will bring about changes in the various subpopulations (school children, fertile population, inhabitants able to work). They will be felt after 2005, when the generations born after 1990, small in number, will be part of the population fit for work.
Bibliography
1. xxx (2005), The Romanian Statistical Yearbook, National Institute of
Statistics, Bucharest.
2. xxx (2007), The Romanian Statistical Yearbook, National Institute of Statistics, Bucharest.
3. xxx (2004), The Projection of Romania’s Population on the Territorial
Profile until 2025, National Institute of Statistics, Bucharest.