PRELIMINARY STUDY: COMPARISON OF TWO DIFFERENT
METHODS IN RECURVE ARCHERY
Lau Jiun Sien 1, Rosniwati Ghafar 1*, Mohd Asri Ariffin 1, Mardhiah Mohamed 2, and Mohd Hafezi Mat Zain1
1 School of Health Sciences, Universiti Sains Malaysia, Health Campus,
Kubang Kerian, Kelantan, Malaysia
2 Rehabilitation Medicine Unit, Hospital Universiti Sains Malaysia, Kubang Kerian,
Kelantan, Malaysia
*Email: [email protected]
(Received 16 January 2016; accepted 23 February 2017; published online 27 July 2017)
To cite this article: Sien, L. J., Ghafar, R., Ariffin, M. A., Mohamed, M., & Mat Zain, M. H. (2017). Preliminary study: comparison of two different methods in recurve archery. Movement,
Health & Exercise, 6(2), 97-119. http://dx.doi.org/10.15282/mohe.v6i2.92
Link to this article: http://dx.doi.org/10.15282/mohe.v6i2.92
Abstract
it can be concluded that the BEST method is able to improve the participants’ performances.
Keywords: Recurve archery; motion analysis
Introduction
Archery is a non-contact, static sport that requires archers to possess muscular strength, upper body endurance and high levels of stability (Mohamed & Azhar, 2012). In earlier days, archery was a necessity for survival and self-defence especially while hunting. Nowadays, archery can be considered as a modern sport, which is considered as accessories for the active lifestyle.
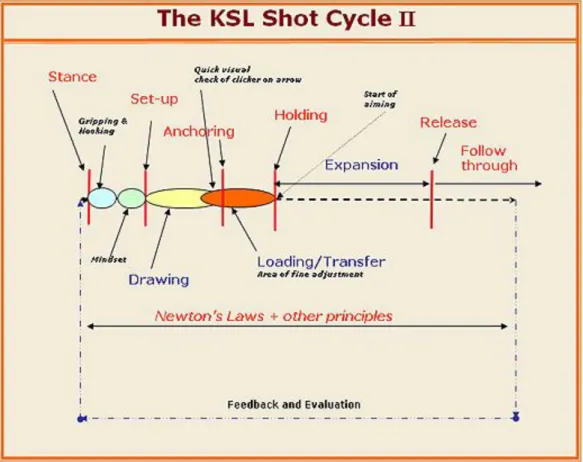
Around the world, there are some variations in the archery techniques used by the coaches and archers. Olympic recurve archery techniques can be described into a few components that include the archer drawing the bow by pulling the arrow tip towards the clicker, holding it in full draw position, and aiming. Finally, the archer pulls the arrow through the clicker and releases the arrows to shoot (Edelmann-Nusser et al., 2006). The most fundamental techniques are separated into six phases that are bow hold, drawing, full draw, aiming, release and follow through (Nishizono et al., 1987). Each of these phases is represented by a stable sequence of movements, and is ideal for researchers to study each phase in detail. According to F.I.T.A manual, the recurve archery techniques includes 10 steps that are stance, setup, hooking, grip, drawing the bow, anchor, full draw, extending, release and follow through (FITA, n.d.). Although there are variations in the archery techniques, the sequence of the technique is more or less the same. Some variations can be detected in the positioning, and different points are stressed in difference techniques. These movements are reproducible, so they can be compared and analysed using a specific system such as a motion analysis system. Highly-skilled archers use a consistent sequence of movements in every shot (Stuart and Atha, 1990).
Figure 1: KSL shot cycle
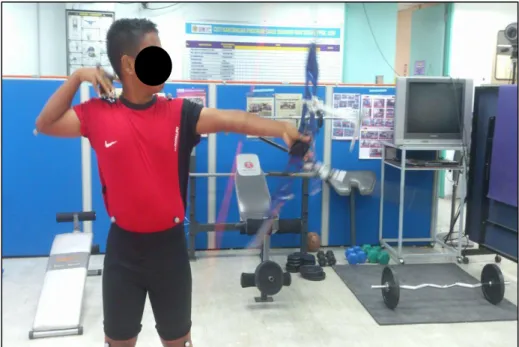
Material and methods
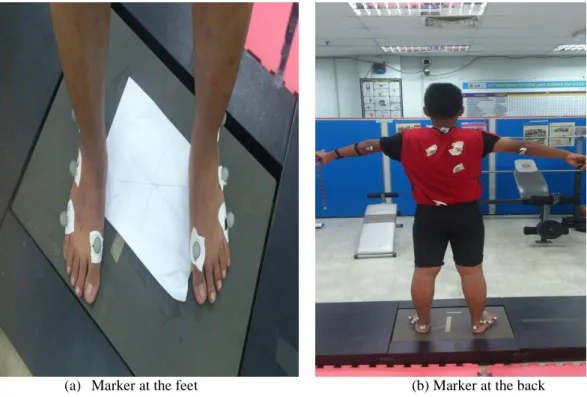
(a) Marker at the feet (b) Marker at the back
Figure 2: Marker used during data collection
Figure 3: Field set-up for 10m (indoor)
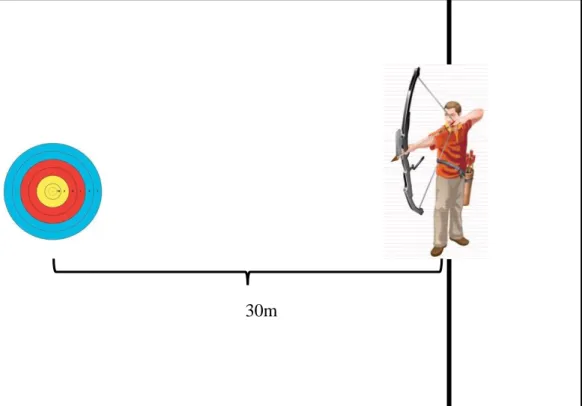
Figure 4: Field set-up for 30m (outdoor)
Measurements for similarities and differences of two archery methods were taken during the stance, posture, and shoulder alignment phase. The scores were recorded for performance comparison. The stance, posture, and shoulder alignment phase were broken into several steps for further analysis based on the guidelines based on the BEST method by Lee and Banner (2009).
Stance phase was broken further into 3 steps. The steps are:
i. The distance between two balls should be approximately shoulder-width apart (<4cm)
ii. Stance alignment 30 degrees open to the target iii. The toes should point roughly parallel
Most of the markers used for the analysis were placed on the feet as shown in the Figure 2(a). These markers were used to measure the distance and angle in each step in the shooting cycle
Posture phase was broken into three different steps for the measurement. The steps are:
i. Hips must be tucked forward to create a flat back ii. The legs must be straight, but not locked
Figure 5 shows one of the steps for the posture phase. The markers used in this phase were located mostly on the leg for part i and part ii. For part iii the markers were placed on the head and at the back.
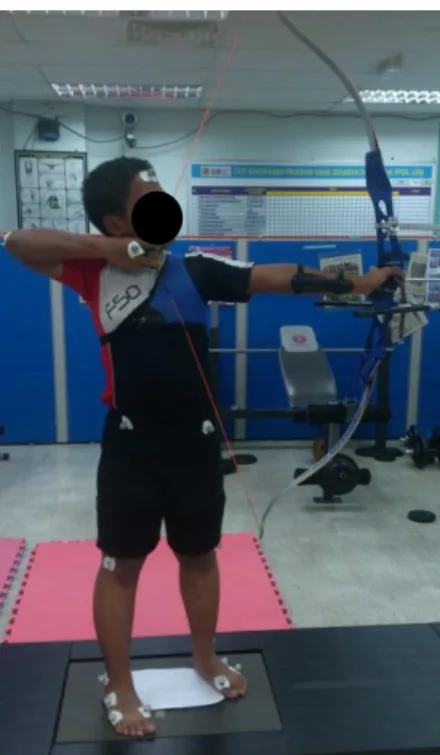
Figure 5: One of the phases in the posture phase (The anchoring phase)
Shoulder alignment was broken further into four different steps. The steps are:
i. Shoulder alignment must point well past the line of the arrow.
ii. Shoulder alignment must be kept the same throughout the release and follow through steps.
iii. The front shoulder should push forward towards the target.
iv. The drawing elbow should wrap around the body during follow through.
Figure 6 shows one of the steps in the shoulder alignment phase. Most of the markers used in this phase were located at the upper extremity especially the hands.
Figure 6: One of the phases in the shoulder alignment phase (release and follow through).
Results and discussions
In this section, the results were divided into 4 sub-sections. Sub-section 1 until sub-section 3 are the discussion on the method comparison. The similarities or differences between the two methods is determined by taking the measurements obtained from the 3D motion analysis for stance, posture, and shoulder alignment phase. The measurements are mostly taken in terms of distance and angle which are based on the position of the markers. The most important markers in each comparison is highlighted as a white dot as shown in Figure 7 to Figure 17. Sub-section 4 is the discussion for the performance comparison. The comparison between the results obtained from the participant’s preferred archery method and the BEST method is made. The arrows shot with two different methods are also compared in terms of scores and distance away from the centre.
Stance phase
- Should be approximately shoulder-width apart (<4cm wider)
Figure 7: Marker placement for the distance of shoulder-width apart.
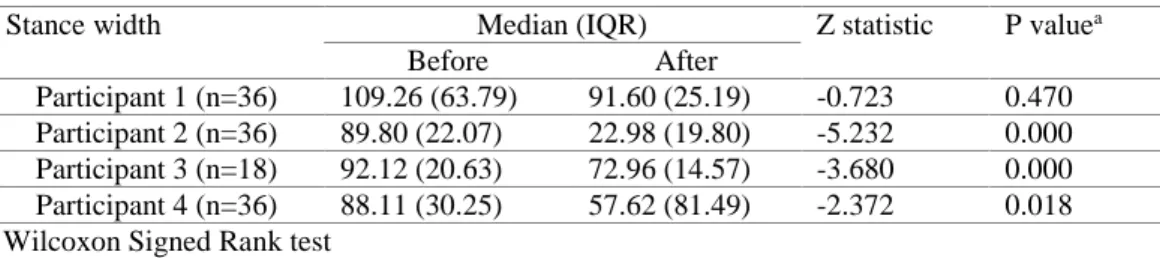
Table 1: Statistical analysis for the stance width of the participants’ method and the BEST method.
Stance width Median (IQR) Z statistic P valuea
Before After
Participant 1 (n=36) 109.26 (63.79) 91.60 (25.19) -0.723 0.470
Participant 2 (n=36) 89.80 (22.07) 22.98 (19.80) -5.232 0.000
Participant 3 (n=18) 92.12 (20.63) 72.96 (14.57) -3.680 0.000
Participant 4 (n=36) 88.11 (30.25) 57.62 (81.49) -2.372 0.018
a Wilcoxon Signed Rank test
and the heels in the personal method (89.80, IQR 22.07) and the BEST method (22.98, IQR 19.80) with p value less than 0.05. The change in the median value of the distance for participant 2 decreased from 89.80 mm from his own method to 22.96 mm from the BEST method was considered significantly different in terms of statistical results. For participant 3, we can conclude that there was a significant difference in the median of the distance between the shoulders and the heels in the personal method and the BEST method with p value less than 0.05. The median of the distance difference for participant 3 decreases from 92.12mm to 72.96mm. For participant 4, we can conclude that there was a significant difference in the median of the distance between the shoulders and the heels in the personal method and the BEST method with p value less than 0.05, the median of distance decrease from 88.11 mm to 57.62 mm.
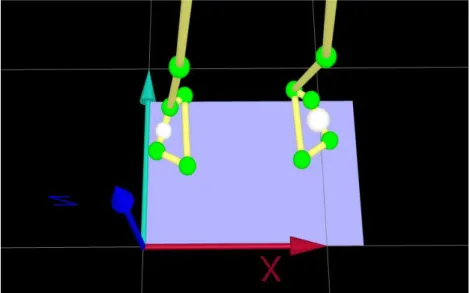
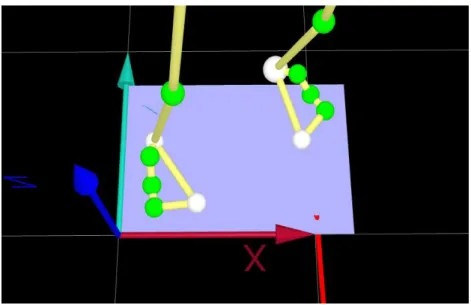
- Stance alignment 30 degrees open to the target
The important markers in this method were the markers on the left 5th metatarsal base (LB5M) and the right 5th metatarsal base (RB5M) of the feet. The alignment of these markers produces an angle that can be measured using the 3D motion analysis system. The positions of the markers are shown in Figure 8. The BEST method proposes a 30 degrees opening to the target as shown in Figure 9. The value of the angle in participants’ personal method was compared to the value of the angle in the BEST method. The differences in value for each participant were compared using Wilcoxon signed rank test.
Figure 9: Markers on feet for stance alignment angle in the BEST method
Table 2: The degree level between own method and BEST method of stance alignment of participants
Stance degree Median (IQR) Z statistic P valuea
Before After
Participant 1 (n=36) 0.62 (0.71) 25.28 (6.42) -5.232 0.000
Participant 2 (n=36) 0.96 (0.87) 16.14 (2.33) -5.232 0.000
Participant 3 (n=18) 1.98 (0.43) 29.00 (2.82) -3.724 0.000
Participant 4 (n=36) 1.81 (1.06) 26.90 (1.07) -5.232 0.000
a Wilcoxon Signed Rank test
For the stance alignment 30 degrees open to the target, based on the results in Table 2, all the participants showed significant differences based on the p value less than 0.05. The degrees of the stance are bigger in the BEST method than their personal method. For participant 1, the median value of the degrees in the stance increased from 0.62° to 25.28° and the p value equal to 0.00. For participant 2, the degrees of the stance increased from 0.96° to 16.14° with significant differences. The degrees of the stance for participant 3 increased from 1.98° to 29.00° while for participant 4, the degree of stance increased from 1.81° to 26.90°.
- The toes should be roughly parallel to each other
The angle between the feet is also considered in this method. The important markers in this step are placed on the right toe (RTOE), left toe (LTOE), right heel (RHEE) and left heel (LHEE) (Figure 10). The results of a statistical analysis are shown in Table 3.
Figure 10: Markers placements on feet
Table 3: The angle between own method and BEST method of parallel stance of participants.
Parallel angle Median (IQR) Z statistic P valuea
Before (n=36) After (n=36)
Participant 1 (n=36) 166.67 (8.64) 175.79 (8.49) -3.433 0.001
Participant 2 (n=36) 166.20 (8.19) 167.07 (17.10) -3.222 0.001
Participant 3 (n=18) 170.60 (15.74) 178.34 (3.08) -2.373 0.018
Participant 4 (n=36) 190.15 (8.28) 177.95 (8.26) -5.184 0.000
a Wilcoxon Signed Rank test
For the method of toes in parallel position, all the participants showed significant differences in the angles with p value less than 0.05 based on the results tabulated in Table 4.12. The summation of the angle between two feet is nearly 1800 making the feet almost parallel to each other. All the angles nearly reached 180°, which showed the participants were able to put their toes in a parallel position. The median value of the angle for participant 1 increased from 166.67° to 175.79° while for participant 2, the median value of the angle increased from 166.20° to 167.07°. The median value of the angle for participant 3 increased from 170.60° to 178.34° while for participant 4, the median value of the angle decreased from 190.15° to 177.95°. The position of the toes is more parallel in the BEST method since the angle is nearly 1800 in the BEST method. Using their personal method, the angle shown is smaller, which is less parallel compared to the BEST method.
Posture phase
- Hips must be tucked forward to create a flat back
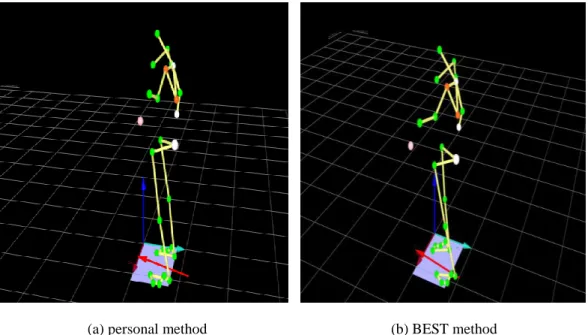
The important markers in this method are the markers placed in the 7th cervical vertebrae (C7), the right back (RBAC) and spine lumbar 5 (SPL5) (Figure 11). The alignment of these markers produces an angle that can be measured using a 3D motion analysis system. The value of the angle in the personal method is compared to the value of the angle measured in the BEST method. The values are compared using Wilcoxon signed rank test. The results of signed rank test are shown in Table 4.
(a) personal method (b) BEST method
Figure 11: Marker placements on the back of the participant’s body
Table 4: The degree level between own method and BEST method of flat back posture of participant
Angle Median (IQR) Z statistic P valuea
Before After
Participant 1 (n=36) 138.76 (9.86) 120.43 (30.78) -3.393 0.001
Participant 2 (n=36) 135.94 (6.08) 147.33 (4.47) -4.902 0.000
Participant 3 (n=18) 142.34 (4.73) 139.41 (6.56) -2.984 0.003
Participant 4 (n=31) 132.18 (3.34) 136.69 (4.75) -4.488 0.000
a Wilcoxon Signed Rank test
138.76° to 120.43° while participant 3 showed a decrease in the median value of the angle from 142.34° to 139.41°. For participant 3 and participant 4, some of the recordings were unable to detect the marker on the spine because the marker was blocked by loose clothing. Hence, the number of recordings for participant 3 was 18 while participant 4 was 31.
- The legs must be straight, but not locked
The important markers in this method are the markers on right front waist (RFWT), right knee (RKNE) and right ankle (RANK) (Figure 12). The alignment of these markers produces an angle that can be measured using the 3D motion analysis system. The value of the angle in their personal method is compared to the value of the angle in BEST method. The values are compared using Wilcoxon signed rank test. The results of signed rank test are shown in Table 4.24.
Figure 12: Marker placements on right front waist, right knee and right ankle
Table 5: Angle comparison between own method and BEST method in leg must be straight
Angle Median (IQR) Z statistic P valuea
Before After
Participant 1 (n=36) 173.08 (3.19) 173.89 (5.06) -0.3222 0.747
Participant 2 (n=36) 177.90 (0.81) 176.26 (1.83) -4.226 0.000
Participant 3 (n=0 ) NA NA NA NA
Participant 4 (n=36) 164.79 (2.61) 167.80 (4.63) -4.556 0.000
a Wilcoxon Signed Rank test
- The head sits out over the chest, and is the farthest extended part of the body
The important markers in this method are the markers on the front head (HEAD), the 7th cervical vertebrae (C7) and the right back (RBAC) (Figure 13). The alignment of these markers produces an angle that can be measured using the 3D motion analysis system. The value of the angle in the personal method is compared to the value of the angle in the BEST method using Wilcoxon signed rank test. The result of the signed rank test is shown in Table 6.
Figure 13: Marker placements in the front head, C7 and back of the participant.
Table 6: The angle between own method and BEST method of the head position
Angle Median (IQR) Z statistic P valuea
Before After
Participant 1 (n=36) 148.32 (6.53) 135.94 (10.83) -5.043 0.000
Participant 2 (n=36) 146.05 (5.32) 153.01 (1.12) -5.232 0.000
Participant 3 (n=18) 153.20 (1.62) 151.64 (2.23) -3.593 0.000
Participant 4 (n=31) 139.29 (2.76) 142.35 (3.08) -3.331 0.001
The last criterion for the posture is that the head should sit out over the chest and is the farthest extended part of the body. All of the participants showed a significant difference in angle values measured for this method with p value less than 0.05. The angle in the C7 is smaller in the BEST method, showing that the head was extended more in the BEST method. The angle at C7 of participant 1 decrease from 148.32° to 135.94° while participant 2 decrease from 146.05° to 153.01°. Participant 3 showed a decrease in the angle from 153.20° to 151.64° while participant 4 showed an increase from 139.29° to 142.35°.
Shoulder alignment phase
The alignment of the shoulders must be in the right position during recording. There are four requirements on the shoulder alignment that must be followed to get the best results. The angle and distance travel of the marker were compares for the differences.
- Shoulder alignment must point well past the line of the arrow (to the right of the target)
The important markers in this step are the markers on the right elbow (RELB), right finger (RFIN) and bow (Figure 14). The alignment of these markers produces an angle that can be measured using the 3D motion analysis system. The comparison between the values of the angles in the personal method and the BEST method is made using Wilcoxon signed rank test. The result of signed rank test is shown in Table 7.
Figure 14: Marker placements on the right elbow, right finger and bow
Table 7: The angle between own method and BEST method of shoulder alignment and arrow
Angle Median (IQR) Z statistic P valuea
Before After
Participant 1 (n=36) 156.96 (5.42) 161.06 (1.99) -4.650 0.000
Participant 2 (n=36) 170.47 (0.96) 172.45 (0.63) -5.232 0.000
Participant 3 (n=18) 168.10 (1.25) 169.53 (2.76) -2.940 0.003
Participant 4 (n=31) 165.63 (3.60) 167.87 (0.93) -3.704 0.000
a Wilcoxon Signed Rank test
- Shoulder alignment must be kept the same through the release and follow through
The important markers in this method are the markers on the left shoulder (LSHO), the left scapula (LSA), the right shoulder (RSHO), and the right scapula (RSCA) (Figure 15). The alignment of these markers produces a distance travel that can be measured using 3D motion analysis system. The value of the distance travelled using their personal method is compared to the value of the distance travelled in the BEST method. The value is compared using Wilcoxon signed rank test. The results of signed rank test are shown in Table 8.
Figure 15: Markers placement on left shoulder, left scapula, right shoulder and right scapula during anchoring phase
Table 8: The distance travelled between own method and BEST method of shoulder alignment through release and follow through.
Distance travel Median (IQR) Z statistic P valuea
Before After
Participant 1 (n=18) 50.26 (9.67) 50.22 (16.51) -2.156 0.031
Participant 2 (n=36) 34.72 (6.84) 36.95 (3.66) -2.866 0.004
Participant 3 (n=18) 55.49 (6.71) 55.99 (9.15) -0.653 0.514
Participant 4 (n=33) 39.81 (8.53) 51.83 (9.08) -5.012 0.000
a Wilcoxon Signed Rank test
- The front shoulder should push forward the target as far as possible
Figure 16: Marker placement on left scapula, left shoulder and left elbow
Table 9: The angle between own method and BEST method of front shoulder
a Wilcoxon Signed Rank test
For detecting the changes of the front shoulder, 3 of the participants (participant 1, participant 2 and participant 3) showed significant differences in the angle values with p value (<0.05). The angle in the left shoulder increased and showed that the front shoulder pushed towards the target as far as possible to create room for the drawing shoulder to rotate sufficiently and comfortably around the spine. Participant 1 showed an increase in the angle from 83.50° to 90.01° while participant 2 showed an increase from 93.55° to 105.41°. The angle at the shoulder of participant 3 increased from 93.98° to 100.24°. Participant 4 did not show any significant differences because the changes were too small, which were from 94.56° to 95.12°. For this method, the markers on the right shoulder were always being blocked by the right hand. This caused the marker to be undetected by the camera. Thus, the number of recordings done for participant 3 and participant 4 were 18 and 35 each.
- The drawing elbow should wraps around the body during follow-through
The important markers in these methods are the markers on the right scapula (RSCA), the right back (RBAC) and the right elbow (RELB) (Figure 17). The angles between these markers can be measured using a/the 3D motion analysis. The value of the angle in the
Angle Median (IQR) Z statistic P valuea
Before After
Participant 1 (n=36) 83.50 (10.13) 90.01 (7.76) -3.676 0.000
Participant 2 (n=36) 93.55 (1.97) 105.41 (1.08) -5.232 0.000
Participant 3 (n=18) 93.98 (1.67) 100.24 (2.29) -3.724 0.000
personal method is compared to the value of the angle in the BEST method using Wilcoxon signed rank tests. The results of signed rank test are shown in Table 10.
Figure 17: Marker placement on the right elbow, right shoulder and right scapula during the releasing phase.
Table 10: The angle level between own method and BEST method of drawing elbow during release
Angle Median (IQR) Z statistic P valuea
Before After
Participant 1 (n=36) 83.08 (6.50) 77.61 (3.59) -5.043 0.000
Participant 2 (n=36) 99.53 (3.56) 106.85 (1.54) -5.232 0.000
Participant 3 (n=18) 89.15 (5.60) 80.64 (4.65) -3.724 0.000
Participant 4 (n=30) 105.88 (7.11) 106.59 (3.98) -0.309 0.758
a Wilcoxon Signed Rank test
The BEST method also suggested that the drawing elbow should wrap around the body during the follow through. Participant 1, participant 2 and participant 3 showed significant differences with p value less than 0.05 in the measured value, but only participant 1 and participant 3 showed the angles becoming smaller in the BEST method and the movement is wrapped around the body. Participant 1 showed a decrease from 83.08° to 77.61° while participant 3 showed a decrease from 89.15° to 80.64°. The angle for participant 2 increased from 99.53° to 106.85°. Participant 4 did not show any significant differences in the result with the p value equal to 0.758 as the changes in the angle was small, which was an increase from 105.88° to 106.59°.
Performance comparison
grouping and the distance of the arrow away from the centre of the target face were analysed.
- Score
The scores are recorded from the range of 0 to 10 based on the score ring on the target face. All 36 arrow shots were analysed for 10 m and 30 m for each participant. 36 arrows for 10 m were shot in the lab while 36 arrows for 30 m were shot in the field.
Score for 10 meter
The score for 10 meter are recorded and were analysed using Wilcoxon signed rank test and the results are as shown in Table 11. For the performance of 10 meter, all the participants showed significant differences in the median score for 10 meters with p value less than 0.05. The median score of participant 1 increased from 8.00 to 10.00 while participant 2 increased from 9.00 to 10.00. Participant 3 showed an improvement in the median score from 7.00 to 9.00 while participant 4 increased from 9.00 to 10.00. This proved that the BEST method is able to improve the performance of the participants. For the distance of arrow away from the centre, all participants showed significant differences with p value (<0.05) in their results except for participant 4.
Table 11: The score level between own method and BEST method in 10 meter
Score Median (IQR) Z statistic P valuea
Before After
Participant 1 (n=36) 8.00 (1.00) 10.00 (1.00) -4.497 0.00
Participant 2 (n=36) 9.00 (1.00) 10.00 (0.00) -3.443 0.001
Participant 3 (n=36) 7.00 (1.00) 9.00 (1.00) -4.766 0.00
Participant 4 (n=36) 9.00 (2.00) 10.00 (1.00) -2.045 0.041
a Wilcoxon Signed Rank test
Score for 30 meter
Table 12: The score level between own method and BEST method in 30 meter
Score Median (IQR) Z statistic P valuea
Before After (n=36)
Participant 1 (n=36) 6.00 (3.00) 8.00 (2.00) -2.783 0.005
Participant 2 (n=36) 9.00 (2.00) 8.00 (2.00) -0.166 0.868
Participant 3 (n=36) 6.00 (8.00) 7.00 (2.00) -3.517 0.000
Participant 4 (n=36) 6.00 (2.00) 8.00 (2.00) -3.677 0.000
a Wilcoxon Signed Rank test
- Distance of arrows away from the centre
The distances of arrows away from the centre are calculated using Silicon Coach Pro 8 software. The target face was captured using a camera and used as an input into the software.
Distance of the arrows for 10 meter
The distances of arrows away from the centre in 10 meter for each participant are analysed using Wilcoxon signed rank test and the results are as shown in Table 13. From the results tabulated in Table 13, all the participants showed significant differences with p value less than 0.05, except participant 4 with p value equal to 0.051. The distance of arrow for participant 1 decreased from 9.69cm to 3.96cm while the distance of arrow for participant 2 decreased from 4.31cm to 2.18cm. Participant 3 showed a decrease in the distance of arrow from the centre from 13.43cm to 5.46cm while participant 4 showed a decrease from 5.54cm to 3.72cm.
Table 13: The distance level between own method and BEST method of arrow away from the centre in 10 meter
Distance Median (IQR) Z statistic P valuea
Before After
Participant 1 (n=36) 9.69 (6) 3.96 (2.58) -4.902 0.000
Participant 2 (n=36) 4.31 (3.80) 2.18 (1.54) -3.794 0.000
Participant 3 (n=36) 13.43 (3.18) 5.46 (3.98) -4.855 0.000
Participant 4 (n=36) 5.54 (5.74) 3.72 (3.710 -1.948 0.051
a Wilcoxon Signed Rank test
Distance of the arrows for 30 meter
Table 14: The distance level between own method and BEST method of arrow away from the centre in 30m of participant 1
Distance Median (IQR) Z statistic P valuea
Before After
Participant 1 (n=36) 17.44 (9.07) 11.95 (8.30) -2.396 0.017
Participant 2 (n=36) 8.02 (7.61) 9.17 (9.53) -0.299 0.765
Participant 3 (n=36) 18.24 (16.77) 13.58 (8.39) -3.111 0.002
Participant 4 (n=36) 16.89 (10.88) 9.58 (8.03) -3.284 0.001
a Wilcoxon Signed Rank test
Conclusion
The purpose of this study was to compare two different shooting methods and its influence on the shooting performance. The similarities and differences of two methods were compared using 3D motion analysis systems which were their personal method and the BEST method. The data was taken before and after the participants were taught about the BEST method. The BEST method was taught based on a book by Kisik Lee, named the BEST method.
From this study, 10 steps has been analysed for comparing similarities and differences in each steps. For participant 1, there were 8 steps that showed significant differences with p value (<0.05) while another 2 showed no significant difference. For participant 2, all the steps showed significant difference with p value (<0.05). For participant 3, there were 8 steps that showing significant differences with p value (<0.05). For participant 4, there were 8 steps that showed significant difference in the analysis. From the analysis we can conclude that the BEST method is different from the subjects’ personal method.
For the performance, the score on the target face were recorded and analysed. The arrow groupings were measured by analysing the distance of the arrow away from the centre.
Participant 1 showed significant difference in all performances parameter. The score was improved in the 10 meters as well as the 30 meters. For participants 2, the performance was improved in the 10 meters from 9 to 10 significantly, but this improvement is not consistent in the 30 meters. From the interview, inconsistency in the performance was due to the fasting, which energy and concentration is at the weakest point during the recording held in the evening. After shooting the 10 meters the subject was exhausted and lost his concentration, which affected his performance in the 30 meters. Participant 3 and participant 4 showed improvement in all the parameters, the score improved as well as arrow grouping.
References
Edelmann-Nusser, J., Heller, M., Hofmann, M., & Ganter, N. (2006). On-target trajectories and the final pull in archery. European Journal of Sport Science, 6, 213-222.
FITA Coach’ s Manual RECURVE BOW Intermediate Level.
Lee, K. S. (2014). The KSL Shot Cycle [Online]. Available at: http://kisiklee.com/kslshotcycle [Accessed: 8 October 2015].
Lee, K. S. & Benner, T. (2009). Total Archery Inside the Archer. 1st ed. Adamson, S. (ed.). Astra LLc: pp page.
Mohamed, M. N. & Azhar, A. H. (2012). Postural Sway and Shooting Accuracy. Movement, Health & Exercise, 1, 50-60.
Nishizono, H., Shibayama, H. I., Izuta, T., & Saito, K. (1987). Analysis of Archery Shooting Techniques by Means of Electromyography. ISBS-Conference Proceeding Archive, 364-372.
Stuart, J. & Atha, J. (1990). Postural consistency in skilled archers. Journal of Sports Sciences, 8, 223-234.