Integrated Public E-Services Interoperability Assessment
Badr Elmir
Al-Qualsadi Research & Development Team Université Mohammed V – Souissi
Rabat Maroc
email: [email protected]
Bouchaib Bounabat
Al-Qualsadi Research & Development Team Université Mohammed V – Souissi
Rabat Maroc email: [email protected]
Abstract
Delivering added value public e-services often requires cooperation between two or more government departments. In general, such cooperation is ensured by implementing interoperability between automated business processes. In spite of the existence of several works interested in public online services in general, only few of them were focused on measuring interoperability degree, whether used or required, to deliver them. In this context, the objective of this paper is to propose a new quality indicator for interoperability assessment of public integrated e-services. This indicator takes into account three main aspects: interoperation potentiality, interoperation compatibility and operational performance. Finally, to better illustrate how to use the proposed measurement method, we present a practical example of integrated public e-service. This work takes the case of a national library which proposes an online registration service.
Keywords: Interoperability Assessment, Automated Business Process, Integrated Public
E-Service.
Introduction
Public administration must prepare itself to provide fully integrated online services for citizens and businesses. In this context, horizontal cooperation in the public domain has become a key enabler for e-government. Indeed, the delivery of value added online governmental services often requires cooperation between two or more public administrations or agencies. This cooperation goes from simple information exchange and can reach business processes interoperability among public departments (Klischewski, 2004)
The present work focuses on measuring the interoperability degree between automated business-processes involved in the provision of an integrated public e-service. The studied processes may be located within a single organization or across a group of public partners in collaboration. Therefore, the proposed measurement method consists of five steps and takes into account three main aspects:
e-service.
• Compatibility degree between the external interfaces of the involved business processes.
• Operational performance of the support systems used to provide the online service.
Concepts
Public e-services
All over the world, public administration proposes several online services in order to (a) improve its operations, (b) to make easy administrative procedures and (c) to minimize cost and time of public services delivery (West, 2004.). Several works have listed most demanded e-services that public administration should provide [(Steyaert ,2004),( Steyaert,2004)]: public information, online payment, e-procurement, registration, licence request, etc.
Charalabidis Y. et al. in (Charalabidis et al., 2006) propose a three facet classification for public e-services structured over eleven axes as depicted in Figure 1:
• User Interface facet: It includes fours axes which are: the main service category, the service nature, the service orientation and the means of service provision.
• Functionality and Integration facet: it consists of four axes which are: sophistication level, interoperability need, providing organization and self-inclusiveness of the provided service.
• Security and compliance facet: it contains the Security Need, Authentication Need and Legal compliance with Statutory Framework.
Figure 1. Categorization of public services (Charalabidis et al., 2006)
The present paper is more interested in the three axes marked in Figure 1 which are: service nature, service orientation and interoperability need.
• Informational use: in which public departments and agencies publish information to educate, entertain, influence, or reach their potential customers;
• Transactional use: where they support a coordinated sequence of user and system activities to provide service and transfer value;
• Operational use: when an agency provides a new mechanism for conducting business operations by integrating information systems, human intellect, and other resources into synergistic networks.
On the other hand and in term of orientation, public online e-services target multiple set of potential customers (Vintar, and Leben, 2002) that could be organized into four main categories:
• Government-to-government services (Che, 2009): generally known by e-administration, it refers to public interdepartmental coordination and collaboration in order to deliver electronic services. Integrating the intergovernmental systems is the first step in implementing electronic government solutions.
• Government-to-citizens service (Peristeras et al, 2009) : this field implements the relations between the government and the citizen and provides communication information and essential services that interest individuals or residents in order to ease their life. It represents the main aim of e-services initiatives.
• Government-to-business services (Peristeras. et al, 2009): it refers to online interaction between government and the business sector. This category includes gaining administrative procedures, public tenders, various permits, authorizations, electronic transaction services including procurements and bids; and payment services of various taxes and public charges.
• Government-to-employees services (Bercea et al., 2010): it includes a set of employees and managers self services giving the ability to view and update personal, administrative, payroll and benefits information via human resources portals. These include also communication, knowledge management, and collaboration tools made available to employees to well perform their daily operations.
Integrated public e-services deliver prerequisites
Public services users expect to perceive public administrations as a homogeneous and coherent unit in order to have a unified access to services they need. In fact, Public administration must be prepared to interact effectively with all the actors in its environment. This requires essentially openness and willingness to break functional, organizational and technological barriers.
In this context, several governments around the world have established Enterprise Architecture programmes (Liimatainen,et al., 2007). These programmes are well known by Government Enterprise Architecture (GEA). They aim to eliminate overlapping projects, to support reuse, and to enhance interoperability between public departments. On another hand, some national strategies were limited to the single issue of interoperation and developed interoperability frameworks. They are mainly addressing technical problems by referencing the main specifications recommended to facilitate and promote cooperation between different government agencies (Guédria al, 2008)
Indeed, to implement interoperability, public administration - with its wide scope of action and its organization into independent governance sub domains - faces technical and semantic difficulties (Gupta et al., 2007) but also organizational challenges (Goldkuhl., 2008.). Moreover, monitoring this quality is not easy on such a macroscopic level.
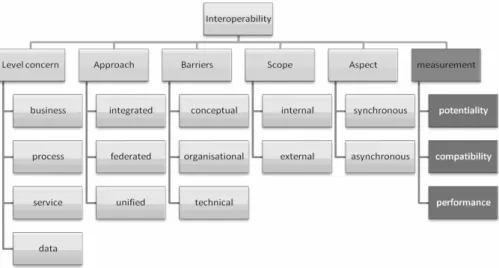
In fact, interoperability is a quality that can be viewed from various perspectives. Several taxonomies have been proposed in this direction (see Figure 2). In this sense, there are:
• Many levels of interoperability concern: business, process, service and data level (Guijaro, 2007)
• Various approaches to implement this quality: integrated, federated, and unified approach (Missikoff. et al., 2004)
• Multiple barriers could handicap interoperation: conceptual, organizational and technical barriers (Arms, et al., 2002).
• Different scopes of application: within the same organization, cross independent organizations (Guédria , et al, 2008),
• Different transactional aspects of cooperation: synchronous or asynchronous collaboration (Michelson , 2006).
Figure 2. Interoperability classification
This paper is interested specially in the last cited perspective which is the measurement perspective. In this context, authors of [Chen et al., 2008] differentiate between the following complementary characteristics (see Figure 3):
• Interoperation potentiality: it represents an «internal quality» of the system that reflects its preparation to interoperate. This involves identifying a set of characteristics that have an impact on communication with partner’s systems without necessarily having concrete information on them. The objective is to foster interoperability readiness by eliminating barriers that may obstruct the interaction. • Interoperation compatibility: it is an «external quality». Indeed, the ability of two
support systems to interact is ensured through an engineering process aiming to establish interoperation between them.
• Interoperation performance: the third aspect characterizes the «quality in use».It focuses on monitoring operational performance. It consists of an assessment of the availability of the communication infrastructure, and the supporting system in general.
Figure 3. Operational aspects of interoperability
Interoperability Assessment
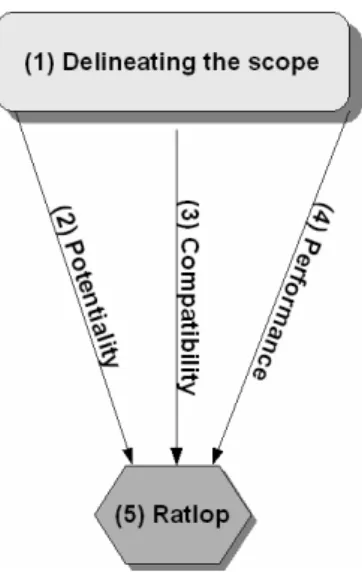
The present work proposes a five steps method to assess interoperability needed to deliver a specific integrated public e-service. These steps are as follows (see Figure 4):
1. Delineating the scope of the study.
2. Quantifying the interoperation potentiality. 3. Calculating the compatibility degree. 4. Evaluating the operating performance. 5. Aggregating the degree of interoperability.
Figure 4. Five steps of interoperability measurement
Delineating the scope of the study
Assessing interoperability, whether used or required, to deliver a specific integrated public e-service requires the knowledge of its ecosystem.
In practical terms, the study focuses on a macro business process consisting of a set of sub automated processes among independent departments. These sub processes are linked together via several interfaces identified in advance. In this case, the preliminary phase consists of identifying the context of the studied online service delivery and then lists the underlying automated processes that we try to study the quality of interaction.
This step includes identifying:
• Public departments and agencies involved in the cooperation. • Sub process within each department in order to study compatibility.
• Information systems that support automated business processes within each department.
Quantifying the interoperation potentiality
interoperation potentiality. They are mostly inspired by the CMM/CMMI model (Chrissis ,et al., 2003 ) Authors of(Pardo , and Burke , 2009) lists:
• ITIM (It Investment Management),
• LISI (Level of Information System Interoperability), • OIMM (Organizational Interoperability Maturity Model), • EIMM (Enterprise Interoperability Maturity Model), • GIMM (Government Interoperability Maturity Matrix),
• SPICE (Software Process Improvement and Capability dEtermination). These models are usually represented as five levels.
The calculation of the potential for interoperability within the kth department «PIk»
requires the adoption of one of these maturity models mentioned above. The organization is classified then on one of these five levels noted IMML (for interoperation maturity model level). To identify the potential degree of interoperability, we propose then the following mapping (See Table 1):
Table 1
Quantification of the maturity of the interoperability
Maturity Level (IMML) Potentiality quantification
1 0.2 2 0.4 3 0.6 4 0.8 5 1
Within each department, the potential is calculated using the following equation (See Equation 1):
Equation 1. Internal interoperation potentiality
The final interoperation potentiality is given by (See Equation 2):
Equation 2. Final interoperation potentiality
Calculating the degree of compatibility
Several studies have focused on the characterization of the interoperation compatibility. (Kasunic and Anderson, 2004) For instance, identifies several indicators to describe this compatibility.
perspective” and “the barriers perspective” seen in section 2.2. In practical terms, we enumerate conceptual, technical and organisational barriers in the different levels of interoperability concern: business, process, service and data. Therefore, if the criteria in an area marked satisfaction the value 1 is assigned; otherwise, the 0 value is assigned if a lot of incompatibilities are met.
Table 2
Interoperability Compatibility
Conceptual Organizational Technology
syntactic semantic authorities
responsibilities Organization platform
communicatio n
Business 0/1 0/1 0/1 0/1 0/1 0/1
Process 0/1 0/1 0/1 0/1 0/1 0/1
Service 0/1 0/1 0/1 0/1 0/1 0/1
Data 0/1 0/1 0/1 0/1 0/1 0/1
By noting the elementary degree of interoperation compatibility «dcij» (i takes values from 1..4, and j takes values from 1..6). The degree of compatibility «DC» is given as follows (See Equation 3):
Equation 3. Interoperation compatibility
Evaluating operating performance.
The operational performance «PO» measurement is done on the basis of IT dashboards of involved public departments. It takes into account indicators as the availability score of the application servers, communication quality of service, and the end users degree of satisfaction about the interoperation in use. This information is collected based on surveying key end users.
By Denoting:
• «DS» the overall availability rate of application servers.
• «QoS» service quality of different networks used for interacting components communication. QoS is represented mainly by the overall availability of networks. • «TS» end users’ satisfaction level about interoperation.
Given the cumulative nature of these three rates, the evaluation of operational performance is given by the geometric mean (DeFusco , et al., 2007) as the following equation (See Equation 4):
Aggregating the degree of interoperability
The final calculation of the ratio characterising the interoperability process in question is by aggregating the three previous indicators using a function f defined in [0,1]3 Æ [0,1] (See Equation 5)
RatIop=f (PI, DC, PO )
Equation 5. Overall degree of interoperability
Given the independent nature of these three indicators, we opt for the arithmetic mean (DeFusco R. et al., 2007) as follows (See Equation 6):
Equation 6. Overall degree of interoperability
Case Study
This section presents an illustration example on assessing interoperability of an integrated public e-service. The case in this paper consists of an online registration in order to benefit from national library services. It’s a citizen oriented e-service that proposes special fees to university students.
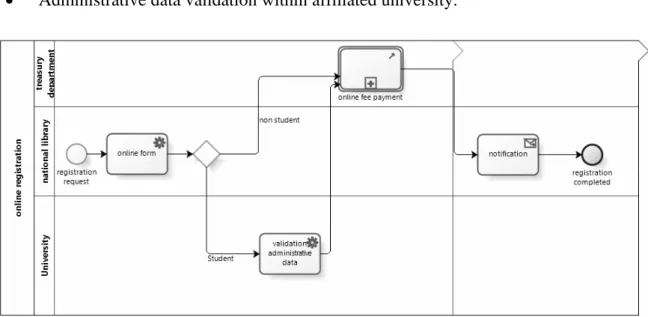
The studied online service is designed and implemented over an inter organizational information system among three public department as described in figure 1. This e-service includes:
• Registration and notification services within the national library, • Fee payment step within national treasury department,
• Administrative data validation within affiliated university.
To evaluate interoperation potentiality (PI) over the whole ecosystem, this work applies Enterprise Interoperability Maturity Model (EIMM) within the three involved public departments. In this case, both national library and university are ranked in level 3. Treasury department has more sophisticated interoperability ecosystem and is ranked into level 4.
In this case, interoperation potentiality PI= min (0.6, 0.6, 0.8) = 0.6.
On another hand, to assess the compatibility degree, we apply Chen et al. matrix as described in paragraph 3.3. The result in our case is depicted in Table 3.
Table 3
Interoperability Compatibility
Conceptual Organizational Technology
syntactic semantic authorities
responsibilities Organization platform communication
Business 0 0 0 0 1 1
Process 1 1 1 1 1 1
Service 1 1 1 1 1 1
Data 1 1 1 1 1 1
The compatibility degree «DC» according to Equation 3 is in this case: DC= 20/24=0.83
In term of operational performance, after collecting IT indicators from the three departments, we find out:
• «DS» the overall availability rate of application servers: 96%.
• «QoS» service quality of different networks used for interacting components communication: 99%.
• «TS» end users’ satisfaction level about interoperation: 84%.
By applying Equation 4, operational performance indicator is about PO=0.93
By aggregating the three previous indicators (PI, DC, PO) using Equation 6 the degree of interoperability in the present case is:
Ratiop=(0.93+0.83+0.6)/3=0.79
Conclusion
method is a ratio metric enabling the measurement of this quality by taking into account three main operational aspects: interoperation potentiality, interoperation compatibility and operational performance.
References
Arms, W. Y. et al., 2002. A spectrum of interoperability: The site for scienceprototype for the NSDL, D-Lib Magazine, 8 (1).
Bercea L et al., 2010. The government of state’s power bodies by means of the Internet, Journal of Computing, 2 (2), February 2010.
Charalabidis Y. et al., 2006, Organising Municipal e-Government Systems: A Multi-Facet Taxonomy of e-Services for Citizens and Businesses, DEXA eGov Conference 2006, Krakow, Poland.
Chen D. et al., 2008. An Approach for Enterprise Interoperability Measurement. Proceedings of MoDISE-EUS 2008. France.
Chen D. et al., 2006. Framework for Enterprise Interoperability. IFAC TC5.3 workshop EI2N, Bordeaux, France.
Chen J., 2009. Qualitative Evaluation of E-Government Service Based on Participatory Index and Balanced Scorecard Approach, iciii, International Conference on Information Management, Innovation Management and Industrial Engineering, Vol. 4, pp. 380-383.
Chrissis M. et al., 2003. CMMI: Guidelines for Process Integration and Product Improvement. Addison-Wesley. USA.
DeFusco R. et al., 2007. Quantitative investment analysis. Vol. 2 of CFA Institute investment series, pp. 127, John Wiley and Sons, Hoboken, NJ, USA.
Goldkuhl G., 2008. The challenges of interoperability in e-government: towards a conceptual refinement. Pre-ICIS 2008 SIG e-Government Workshop, Paris.
Guédria W. et al., 2008. Interoperability maturity models - survey and comparison-.Lecture Notes in Computer Science, Springer Berlin / Heidelberg. Vol. 5872/2009, pp. 216-225. Guijaro L., 2007. Frameworks for fostering cross-agency interoperability in e-government.
Electronic government: information, and transformation, within the advances in
management information system (AMIS) series (ME Sharp).
Gupta K. et al., 2007. Enabling the interoperability of large-scale legacy systems. (Technical Note AIC-07-127). Washington, DC: Naval Research Laboratory, Navy Center for Applied Research in Artificial Intelligence.
Kasunic M. and Anderson W., 2004. Measuring Systems Interoperability: Challenges and Opportunities. Technical Note CMU/SEI-2004-TN-003. Carnegie Mellon University, Pittsburgh.
Interoperability in administration. In Traunmüller, R., Electronic Government: Third International Conference EGOV 2004, Lecture Notes in Computer Science 3183, Berlin: Springer Verlag, pp.57-65.
Koh C. E. et al., 2008. Measuring egovernment readiness, Information & Management, Vol. 45, Issue 8, December 2008, pp. 540-546.
Liimatainen, K. et al., 2007. Overview of Enterprise Architecture work in 15 countries. Ministry of Finance, State IT Management Unit, Research reports 6b/2007.
Michelson B., 2006: Event-Driven Architecture Overview. Technical Report. Patricia Seybold Group. Boston, USA
Missikoff M. et al., 2004. State of the Art and State of the Practice Including Initial Possible Research Orientations. Deliverable D8.1. European Commission, INTEROP Network of Excellence http://www.interop-noe.org/
Pardo A. and Burke B., 2009. Improving government interoperability. A capability framework for government managers. Technical Report. Center for technology in government. University at Albany, NY, USA.
Peristeras V. et al., 2009. Transforming E-government and E-participation through IT, IEEE Intelligent Systems, Vol. 24, no. 5, pp. 14-19, Sep./Oct. 2009.
Prybutok V.R. et al., 2008. Evaluating leadership, IT quality, and net benefits in e-government environment, Information & Management 45, pp. 143-152.
Peristeras V. et al., 2009. A Framework of Hybrid Recommendation System for Government-to-Business Personalized E-Services, itng, Seventh International Conference on Information Technology, pp. 592-597.
Steyaert J. C., 2004. Measuring the performance of electronic government services, Information & Management 41, pp. 369-375.
Vintar, M. and Leben, A., 2002. The Concepts of an Active Life-event Public Portal. In Proceedings of the First International Conference on Electronic Government. Springer-Verlag, Berlin, pp. 383-390.