VOLUME 15 ISSUE 2 (2017), Page 75 – 84
HUMAN INTERACTION IN URBAN SPACES: A QUANTITATIVE ANALYSIS IN URBAN PARK, SHAH ALAM CITY, SELANGOR
Filzani Illia Ibrahim1, Dasimah Omar2, & Nik Hanita Nik Mohamad3 1,2,3Faculty of Architecture, Planning & Surveying
UNIVERSITI TEKNOLOGI MARA (UiTM)
Abstract
This paper aims to provide valuable insight of the various dimensions of human needs’ towards open spaces. This study employed a mixed method research design involving both quantitative and qualitative methods that were utilised to identify and evaluate the human-human interaction and human-nature interaction in the area of study. Primary data was gathered by using questionnaire survey that was administered to 861 respondents who were visitors to public parks. The finding of this study is intended to show the main domains that reflect human needs’ toward open spaces together with perceived benefits to the open space users.
Keywords: human-human interaction, human-nature interaction, open spaces.
Date Received: 26th July 2016
INTRODUCTION
Historically, mankind has created open spaces for various reasons. Thus, open spaces are often viewed as the products of a complex society with different societal needs, interest and aesthetics, which evolved over time. Humans’ relationship with open spaces is becoming increasingly complex due to the heterogeneous cultural and demographic dimensions of socio-economic, gender, type of activities and open space facilities. Hence, the growing scarcity of open spaces is of concern to the local authorities as there is a drastic reduction in good quality open spaces left in the urban areas.
The objectives of this paper are to identify the motives of urban dwellers in visiting open spaces, and to examine the human interaction and human-nature interaction in open spaces. This study employed a mixed method research design involving both quantitative and qualitative methods that were utilised to identify and investigate the human-human interaction and human-nature interaction in the area of study. Primary data was gathered by using questionnaire survey that was administered to 861 respondents who were visitors to public parks in Shah Alam. The findings of this study show the main domains that reflect human needs towards open spaces. It is hoped that the findings of this study would assist landscape planners and designers in understanding the preferred conducive composition and configuration of human needs towards open spaces.
HUMAN INTERACTION IN OPEN SPACES
Open space act as a positive channel for people engagement and interaction (Omar, Illia & Hanita, 2015). However, people value open space differently. According to Mutiara & Isami (2012), urbanites prefer their open spaces with a variety of facilities for recreational activities instead of only attractive natural areas. Meanwhile, Machabee, Oleson and Kinzig (2004) claim that socio-economic factor also determine the usage of open space, as residents of high-income neighbourhood were found to use their open spaces more than residents in the middle or low-income neighbourhoods.
interaction they get from visiting open spaces? What are the benefits they get and do these benefits affect their quality of life?
RESEARCH METHODOLOGY
Theoretical Framework
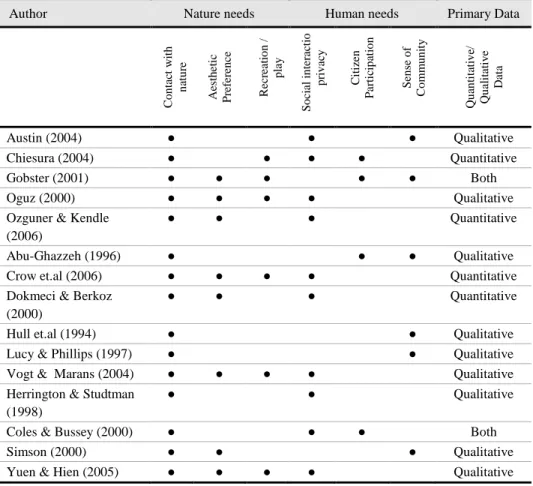
Matsuoka and Kaplan (2008) identify major themes that directly linked to the open spaces including human-nature interaction and human-human interaction. The domains then applied in the study as the general guidelines. Under the nature needs, three variables were measured: contact with nature, aesthetic preference, and recreation or play. As for the human needs, the variables measured were social interaction, citizen participation and the sense of community. Table 1 below shows the framework.
Table 1 Theoretical Framework of Human Interaction in Open Spaces
Author Nature needs Human needs Primary Data
C o n ta ct w it h n at u re A est h et ic P re fe re n ce R ec re at io n / p la y S o ci al i n te ra ct io n / p ri v ac y C it iz en P ar ti ci p at io n S en se o f C o mm u n it y Q u an ti ta ti v e/ Q u al it at iv e D at a
Austin (2004) ● ● ● Qualitative
Chiesura (2004) ● ● ● ● Quantitative
Gobster (2001) ● ● ● ● ● Both
Oguz (2000) ● ● ● ● Qualitative
Ozguner & Kendle (2006)
● ● ● Quantitative
Abu-Ghazzeh (1996) ● ● ● Qualitative
Crow et.al (2006) ● ● ● ● Quantitative
Dokmeci & Berkoz (2000)
● ● ● Quantitative
Hull et.al (1994) ● ● Qualitative
Lucy & Phillips (1997) ● ● Qualitative
Vogt & Marans (2004) ● ● ● ● Qualitative
Herrington & Studtman (1998)
● ● Qualitative
Coles & Bussey (2000) ● ● ● Both
Simson (2000) ● ● ● Qualitative
Variables Measured
This research explores multi-dimensional human needs in open spaces and the perceived benefits from the interactions towards the area. The design of the spatial configuration could serve as a platform for human-nature interaction or human-human interaction. In order to comprehend design qualities that encourages interactions, it is recommended to measure the open spaces properties (i.e. green quality, green setting, accessibility, facilities and amenities) and interactions (human-nature interaction and human-human interaction) of the open space through documented responses. The unit of analysis is the various range of age group of the open spaces of Zone A in Shah Alam, Selangor. The approach in dividing the variables into two major categories was for the purpose of systematic data collection and to gauge how daily usage pattern of open spaces relate to the interactions.
Methods of Data Collection
A total of 1,000 of survey questionnaires were distributed within the various open spaces in Zone A, Shah Alam, Selangor. Questionnaires were distributed randomly regardless the users’ age, race and ethnicity. However, only 861 were completed by respondents. In this survey, respondents were provided with a survey form with subsections to determine their background, such as gender, income, companionship, mode of transportation to open space, frequency of visit and time spend per visit. Respondents also were asked their main purpose of visiting open space. This were divided into two subsections: the human-nature interaction and the human-human interaction.
Study Area
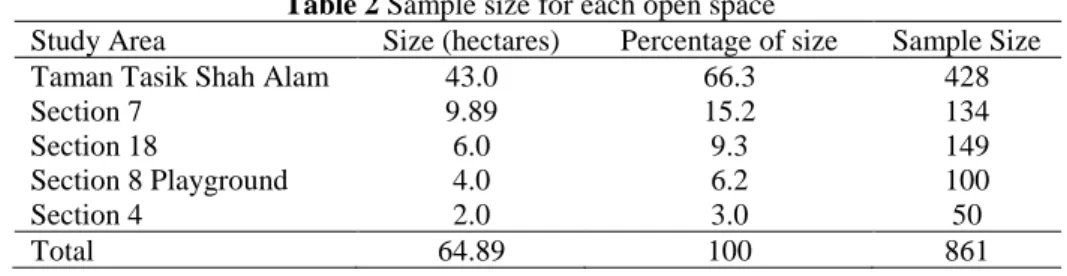
The selected study area is Zone A, Shah Alam, Selangor Darul Ehsan, Malaysia. Table 2 below shows the ratio and percentage of the survey respondents.
Table 2 Sample size for each open space
Study Area Size (hectares) Percentage of size Sample Size Taman Tasik Shah Alam 43.0 66.3 428
Section 7 9.89 15.2 134
Section 18 6.0 9.3 149
Section 8 Playground 4.0 6.2 100
Section 4 2.0 3.0 50
Total 64.89 100 861
Development of the Instruments and Procedures
RESULTS AND FINDINGS
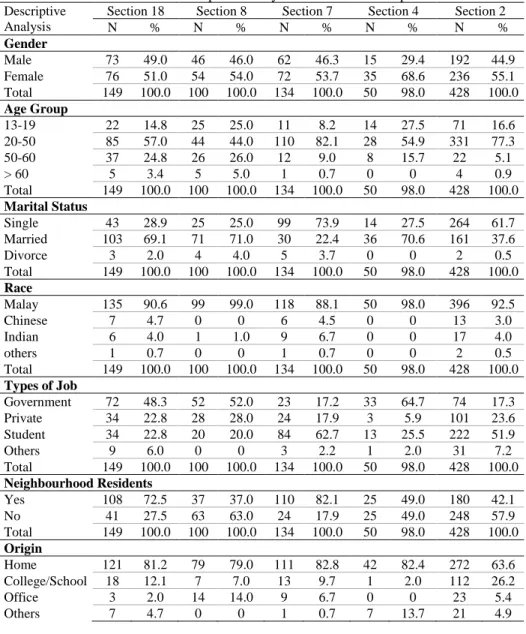
The data from survey questionnaires were coded into SPSS software for statistical analyses. The main focused of the analyses was to understand the relationship of human-human interactions and human-nature interactions that took place in the open space area. Demographic attributes such as gender, race, age group and home distance to open space were also considered. The descriptive analysis in Table 3 provides an overall analysis of the respondents profile in the study area.
Table 3 Overall Descriptive Analysis on Profile of Respondents
Descriptive Analysis
Section 18 Section 8 Section 7 Section 4 Section 2
N % N % N % N % N %
Gender
Male 73 49.0 46 46.0 62 46.3 15 29.4 192 44.9
Female 76 51.0 54 54.0 72 53.7 35 68.6 236 55.1
Total 149 100.0 100 100.0 134 100.0 50 98.0 428 100.0
Age Group
13-19 22 14.8 25 25.0 11 8.2 14 27.5 71 16.6
20-50 85 57.0 44 44.0 110 82.1 28 54.9 331 77.3
50-60 37 24.8 26 26.0 12 9.0 8 15.7 22 5.1
> 60 5 3.4 5 5.0 1 0.7 0 0 4 0.9
Total 149 100.0 100 100.0 134 100.0 50 98.0 428 100.0
Marital Status
Single 43 28.9 25 25.0 99 73.9 14 27.5 264 61.7
Married 103 69.1 71 71.0 30 22.4 36 70.6 161 37.6
Divorce 3 2.0 4 4.0 5 3.7 0 0 2 0.5
Total 149 100.0 100 100.0 134 100.0 50 98.0 428 100.0
Race
Malay 135 90.6 99 99.0 118 88.1 50 98.0 396 92.5
Chinese 7 4.7 0 0 6 4.5 0 0 13 3.0
Indian 6 4.0 1 1.0 9 6.7 0 0 17 4.0
others 1 0.7 0 0 1 0.7 0 0 2 0.5
Total 149 100.0 100 100.0 134 100.0 50 98.0 428 100.0
Types of Job
Government 72 48.3 52 52.0 23 17.2 33 64.7 74 17.3
Private 34 22.8 28 28.0 24 17.9 3 5.9 101 23.6
Student 34 22.8 20 20.0 84 62.7 13 25.5 222 51.9
Others 9 6.0 0 0 3 2.2 1 2.0 31 7.2
Total 149 100.0 100 100.0 134 100.0 50 98.0 428 100.0
Neighbourhood Residents
Yes 108 72.5 37 37.0 110 82.1 25 49.0 180 42.1
No 41 27.5 63 63.0 24 17.9 25 49.0 248 57.9
Total 149 100.0 100 100.0 134 100.0 50 98.0 428 100.0
Origin
Total 149 100.0 100 100.0 134 100.0 50 98.0 428 100.0
Distance
< 1km 44 29.5 3 3.0 43 32.1 4 7.8 43 10.0
1-2km 72 48.3 62 62.0 51 38.1 37 72.5 100 23.4
2-5km 26 17.4 34 34.0 30 22.4 9 17.6 133 31.1
> 5km 7 4.7 1 1.0 10 7.5 0 0 152 35.5
Total 149 100.0 100 100.0 134 100.0 50 98.0 428 100.0
Mode of Transportation
On Foot 110 73 43 43.0 23 17.2 16 31.4 122 28.5
Public 7 4.7 0 0 3 2.2 1 2.0 19 4.4
Motorcycle 8 5.4 3 3.0 69 51.5 3 5.9 86 20.1
Car 22 14 51 51.0 39 29.1 30 58.8 201 47.0
Others 2 1.3 3 3.0 0 0 0 0 0 0
Total 149 100 100 100.0 134 100.0 50 98.0 428 100.0
Frequency and Purpose of Visits
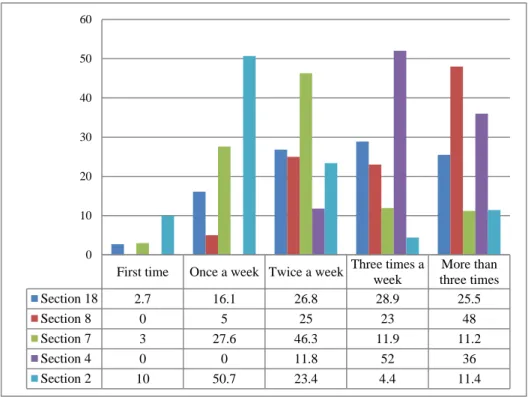
Figure 1 shows the result of total percentage of visit frequency of the respondents to the open spaces per week. Meanwhile, Figure 2 shows the respondents’ purpose of visiting the open spaces.
Figure 1 Total Percentage of Visit Frequency
First time Once a week Twice a week Three times a week
More than three times
Section 18 2.7 16.1 26.8 28.9 25.5
Section 8 0 5 25 23 48
Section 7 3 27.6 46.3 11.9 11.2
Section 4 0 0 11.8 52 36
Section 2 10 50.7 23.4 4.4 11.4
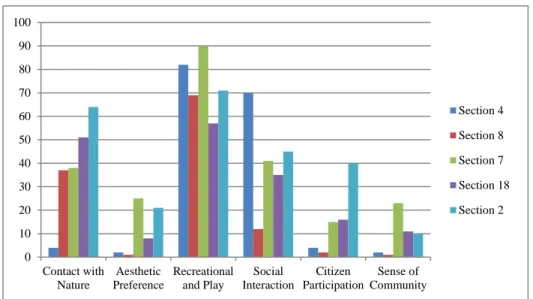
Figure 2 Purpose of Visiting Open Spaces
Human-Nature Interaction
To explore the human-nature interactions that respondents experienced in the open spaces, the questionnaire were divided into three parts that were contact with nature, aesthetic preference and recreational play. Table 4 below shows the overall results of human-nature interaction.
Table 4 Overall Analysis of Human-Nature Interaction
Overall Findings Study Areas
Section 18 Section 8 Section 7 Section 4 Section 2 p-value p-value p-value p-value p-value
Contact with Nature
Unity with nature 0.0126 √ 0.3443 X 0.1783 X 0.1569 X 0.2440 X Unity with my self 0.2048 X 0.0731 X 0.0765 X 0.7860 X 0.1802 X Freedom 0.0024 √ 0.0569 X 0.1990 X 0.7138 X 0.2356 X Recreational
Satisfaction
0.6356
X 0.0985 X 0.0412 √ 0.7886 X 0.1726 X
Adventure 0.1728 X 0.3911 X 0.0095 √ 0.0588 X 0.7030 X Happiness 0.4380 X 0.0779 X 0.0306 √ 0.6805 X 0.3928 X I think open space is
important part of the city.
0.4594 X 0.0055 √ 0.2102 X 0.2295 X 0.6561 X
Aesthetic Preference
Unity with nature 0.1369 X 0.6109 X 0.0807 X 0.7747 X 0.9044 X Unity with my self 0.0377 √ 0.7310 X 0.0155 √ 0.8888 X 0.1004 X Freedom 0.1750 X 0.8179 X 0.0254 √ 0.2529 X 0.1971 X Recreational
Satisfaction
0.1125
X 0.5780 X 0.0050 √ 0.5740 X 0.2315 X
Adventure 0.3463 X 0.2680 X 0.0007 √ 0.7260 X 0.8400 X 0
10 20 30 40 50 60 70 80 90 100
Contact with Nature
Aesthetic Preference
Recreational and Play
Social Interaction
Citizen Participation
Sense of Community
Section 4
Section 8
Section 7
Section 18
I think open space is important part of the city.
0.7971 X 0.6512 X 0.2499 X 0.6006 X 0.6193 X
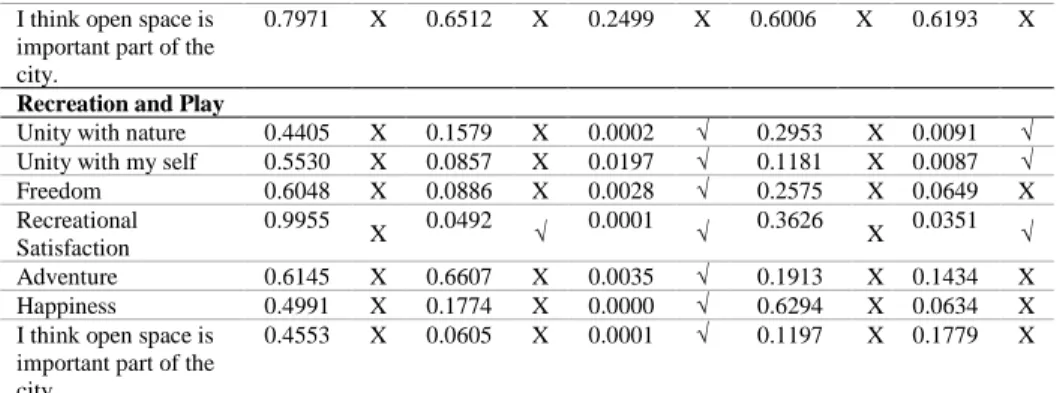
Recreation and Play
Unity with nature 0.4405 X 0.1579 X 0.0002 √ 0.2953 X 0.0091 √ Unity with my self 0.5530 X 0.0857 X 0.0197 √ 0.1181 X 0.0087 √ Freedom 0.6048 X 0.0886 X 0.0028 √ 0.2575 X 0.0649 X Recreational
Satisfaction
0.9955
X 0.0492 √ 0.0001 √ 0.3626 X 0.0351 √
Adventure 0.6145 X 0.6607 X 0.0035 √ 0.1913 X 0.1434 X Happiness 0.4991 X 0.1774 X 0.0000 √ 0.6294 X 0.0634 X I think open space is
important part of the city.
0.4553 X 0.0605 X 0.0001 √ 0.1197 X 0.1779 X
√ : Null Hypothesis is rejected. There is significant relationship (p-value <0.0.5) X : Null hypothesis is not rejected. There is no relationship (p-value > 0.05)
Human-Human Interaction
To determine the human-human interaction that the respondents experienced in the open spaces, the questionnaire were divided into three parts that were social interaction, citizen participation and a sense of community towards the open spaces. Table 5 below shows the overall results.
Table 5 Overall Analysis of Human-Human Interaction
Overall Findings Study Areas
Section 18 Section 8 Section 7 Section 4 Section 2 p-value p-value p-value p-value p-value
Social Interaction
Unity with nature 0.1277 X 0.2097 X 0.6241 X 0.0149 √ 0.0084 √ Unity with my self 0.2179 X 0.6136 X 0.6973 X 0.4781 X 0.0117 √ Freedom 0.1658 X 0.6695 X 0.6568 X 0.4208 X 0.2127 X Recreational
Satisfaction 0.4434 X 0.0908 X 0.8026 X 0.7859 X 0.1018 X Adventure 0.2254 X 0.4801 X 0.8822 X 0.2625 X 0.2125 X Happiness 0.0373 √ 0.7493 X 0.7761 X 0.7512 X 0.0286 √ I think open space is
important part of the city.
0.1206 X 0.4831 X 0.5874 X 0.1931 X 0.1395 X
Citizen Participation
Unity with nature 0.7147 X 0.9540 X 0.0893 X 0.1569 X 0.0176 √ Unity with my self 0.7712 X 0.0993 X 0.0977 X 0.3442 X 0.0089 √ Freedom 0.4831 X 0.9287 X 0.1303 X 0.5347 X 0.0018 √ Recreational
Satisfaction 0.2674 X 0.3303 X 0.8605 X 0.7886 X 0.0006 √ Adventure 0.9455 X 0.8981 X 0.5659 X 0.5487 X 0.0529 X Happiness 0.6462 X 0.2857 X 0.1068 X 0.8503 X 0.0056 √ I think open space is
important part of the city.
0.0864 X 0.0881 X 0.0868 X 0.8793 X 0.0023 √
Sense of Community
Recreational
Satisfaction 0.0385 √ 0.5780 X 0.3750 X 0.3941 X 0.0803 X Adventure 0.9776 X 0.6757 X 0.1932 X 0.0016 √ 0.0882 X Happiness 0.8554 X 0.5380 X 0.0831 X 0.6688 X 0.2955 X I think open space is
important part of the city.
0.5434 X 0.6512 X 0.0573 X 0.6006 X 0.6786 X
√ : Null Hypothesis is rejected. There is significant relationship (p-value <0.0.5) X : Null hypothesis is not rejected. There is no relationship (p-value > 0.05)
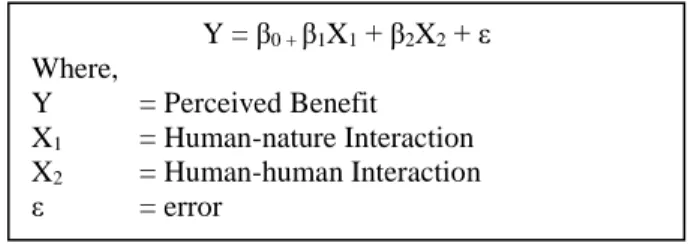
Perceived Benefits of Open Spaces
For the perceived benefits in relation to the open spaces, the variables that represent the items by overall perception of human-human interaction, overall perception of human-nature interaction and average perceived benefits were created by using the regression model (Figure 3) to test whether these variables can significantly affect the perceived benefits. The results are shown in Table 6.
Figure 3 The Proposed Regression Model
Table 6 Overall Analysis for the Proposed Model of Perceived Benefits Model Unstandardized
Coefficients
Standardized Coefficients
Sig. Dependent Variable: Perceived Benefit
Overall Result B Std.
Error
Beta R-square F-statistics p-value
Section 18
1 (Constant) 2.685 .334 .000 0.059 4.004 0.021
Human-nature
.148 .075 .172 .051 X
Human-human
.106 .065 .142 .108 X
Section 8
1 (Constant) 2.162 .426 .000 0.18 10.444 0
Human-nature
.044 .091 .045 .634 X
Human-human
.360 .083 .412 .000 √
Section 7
1 (Constant) 1.572 .467 .001 0.206 15.685 0
Human-nature
.064 .129 .049 .619 X
Human- .558 .130 .424 .000 √
Y = β0 + β1X1 + β2X2 + ε Where,
Section 4
1 (Constant) 3.240 .473 .000 0.04 0.927 0.403
Human-nature
.105 .105 .159 .321 X
Human-human
.054 .117 .073 .650 X
Section 2
1 (Constant) 1.262 .221 .000 0.301 56.474 0.000
Human-nature
.418 .065 .383 .000 √
Human-human
.222 .054 .246 .000 √
CONCLUSION
In conclusion, this study has shown that human interactions are important to the open spaces as both elements respond well to each other. Apart from that, this study has also indicated that nature and human interactions needs elements of open spaces such as the green spaces, water elements and physical attributes to enhance the interactions between human-human and human-nature.
ACKNOWLEDGEMENTS
This research is funded by Fundamental Research Grant Scheme (FRGS) from Ministry of Higher Education, Malaysia. The authors would also like to thank all officers of Research Management Institute of Universiti Teknologi MARA, particularly whom in charge for this research grant.
REFERENCES
Machabee, L. G., Oleson, J. J., & Kinzig, A. P. (2005). Neighborhood parks uses by Phoenix residents: an exploration of socio demographic differences. In D. Harmon (Ed.), People, Places, and Parks: Proceedings of the 2005 George Wright Society Conference on Parks, Protected Areas, and Cultural Sites. Hancock, Michigan: The George Wright Society.
Matsuoka, R. H., & Kaplan, R. (2008). People needs in the urban landscape : Analysis of Landscape and Urban Planning contributions. Landscape and Urban Planning, 84(1), 7-19. doi: 10.1016/j.landurbplan.2007.09.009
Mutiara, S., & Isami, K. (2012). Characteristic of public small park usage in Asia Pacific countries: case study in Jakarta and Yokohama City. Procedia - Social and Behavioral Sciences, 35, 412-419. doi:10.1016/j.sbspro.2012.02.106