http://www.sciencepublishinggroup.com/j/ajop doi: 10.11648/j.ajop.20170504.13
ISSN: 2330-8486 (Print); ISSN: 2330-8494 (Online)
Annual Effective Dose of Radon-222 in Well Water Samples
in Male Adults: Idah, Nigeria
Philip Musa Gyuk
1, Arome Aruwa
2, *, Matoh Dary Dogara
1, Isaac Hyuk Daniel
11Department of Physics, Kaduna State University, Kaduna, Nigeria 2
Department of Science Laboratory Technology, Federal Polytechnic, Idah, Nigeria
Email address:
aroaruwa@gmail.com (A. Aruwa)
*Corresponding author
To cite this article:
Philip Musa Gyuk, Arome Aruwa, Matoh Dary Dogara, Isaac Hyuk Daniel. Annual Effective Dose of Radon-222 in Well Water Samples in Male Adults: Idah, Nigeria. American Journal of Optics and Photonics. Vol. 5, No. 4, 2017, pp. 45-49. doi: 10.11648/j.ajop.20170504.13
Received: October 24, 2017; Accepted: November 6, 2017; Published: December 15, 2017
Abstract:
A total of 25 well water samples from various locations of Idah and environs including Ofukolo, Ega, Ede - Adejo, and Ede - Alaba, have been investigated for their 222Rn concentrations using liquid scintillation counter manufactured by Packard Instrument Company. The concentration of 222Rn in the well water samples was found to vary in the range 3.0±2.00 – 18.24±1.50 Bq/L and a mean concentration of 9.64 Bq/L with An average mean concentration of 10.23 Bq/L recorded respectively. The results showed that 222Rn concentration in well water sources were greater than the maximum concentration limit (MCL) of 11.1Bq/L set by USEPA and 10.0 Bq/L set by WHO. The annual effective dose by ingestion for adult male was found to be in the range 0.0198 mSv/y to 0.1198 mSv/yand an average of 0.0721 mSv/y which are lower than the annually received effective dose as set by ICRP.Keywords:
222Rn, Groundwater, Liquid Scintillation Counter (LSC), Effective Dose
1. Introduction
Radon, a natural byproduct of the radioactive decay of uranium, radium and thorium, is analpha-emitting noble gas with a half-life of 3.8 days. Radon gas is soluble in water and consequently the gas may be incorporated into groundwater flows. Radon is extracted from the volcanic deposits in which the aquifer resides, its transport taking place basically through the fissure network in the fractured system or from mantle degassing. The quantity of radon dissolved in groundwater depends on different factors such as the characteristics of the aquifer, water-rock interaction, water residence time within aquifer, material content of radium, etc. ([1], [2], [3]). Measurements of radon contents in groundwater have been performed in connection with geological, hydro geological and hydrological surveys health hazard studies. On the one hand, the half-life of radon and its solubility have allowed the use of radon gas as a natural groundwater tracer to identify and quantify groundwater discharge to surface waters [4], or to attempt to elucidate the type of rocks through which groundwater’s flow [5]. On the other hand, the presence of
Idah is a local government in Kogi state Nigeria. In the study area Idah, and its environs there is total dependence and reliance on ground water source for drinking, agricultural purposes and domestic usage. Idah is bounded by latitudes 7° 49N - 7° 62 N and longitudes 6° 44 E - 6° 75 E. It has a total landmass of 36km2 (14Sq. mile) and a population of 76, 815 persons at the 2006 census [15]. The study area falls within the forest region of Nigeria [16], the area is underlain by
Gneisses, magnetite and metamorphic rocks of Precambrian age which have been intruded by series of granite rocks which are sources of uranium, the parent of radon-222. However, some portion of the study area fall within region underlain by sand stones (sedimentary rock) which could provide a source of water through the tapping of the aquifers while the remaining portion is underlain by igneous rocks [17].
Figure 1. Map of the study area showing sample locations.
2. Materials and Methods
The following materials were used in this research as listed by [18] in a publication titled “Determination of Radon in Drinking Water by Liquid Scintillation Counting Method 913.0;
i. Plastic sample collection bottles (200ml) was used for sample collection
ii. Scintillation cocktail dispenser – adjustable to deliver 10ml.
iv.Disposable hypodermic syringe (20ml, 10ml and 2ml) capacity with 38mm hypodermic needle.
v. Distilled water
vi.Scintillation vial – 20ml glass with cap. vii.Surgical globe
viii. Indelible ink and masking tape ix.Mineral oil (insta-gel)
A total of 25 samples of deep well water samples were collected from different locations in Idah in plastic bottles. The plastic bottles were first wash cleaned and rinsed with distilled water to avoid radon present in the samples from being contaminated or absorbed. The samples were collected with the aid of a bailer, but the stagnant water in the wells was first purged by drawing it out and allowing the well to refill, this was done severally to ensure fresh samples were obtained. The samples were taken to the laboratory immediately after collection without allowing them to stay long (three days maximum) for analysis. This is done so as to achieve maximum accuracy and not to allow the composition of the sample to change.
10ml each of the water samples were transferred into a 20ml glass scintillation vial to which 10ml of insta-gel scintillation cocktail is added. Having been sealed tightly, the vials were shaken for more than two minutes to extract radon – 222 in water phase into the organic scintillate, and the samples collected were then counted for 60minutes in a liquid scintillation counter using energy discrimination for alpha particles.
The prepared samples were analyzed by using Liquid Scintillation Counter (Tri-Carb LSA 1000TR) model
manufactured by packard Instrument Company located at the centre for Energy Research and Training (CERT), Ahmadu Bello University, Zaria – Nigeria, after they were allowed to stay for three hours for equilibrium to be attained between radon-222 and its daughter progeny.
The 222Rn concentration in a sample of water is determined using the formula.
=
. (1)
Where
Rn is Radon level in BqL-1 CS is Sample Count/Second CB is Background Count/Second CF is Conversion factor
D is Decay Constant
To calculate the annual effective dose of 222Rn through drinking water, an equation as proposed by the United Nation Scientific Committee on the Effects of Atomic Radiation [19] was used.
E = K x G x C x T x 1000 (2)
E is Annual effective dose (mSvy-1)
K is Conversion coefficient concentration of 222Rn (SvBq-1) G is Daily Consumed Water (L/d)
C is Concentration of 222Rn (BqL-1)
T is time span of water consumption (365 days) 1000 is the conversion coefficient of Sv to mSv
3. Results and Discussions
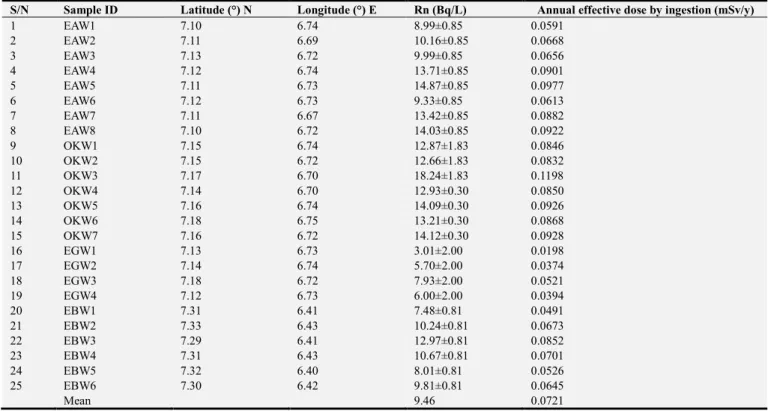
Table 1. Effective dose and 222Rn Concentration from the Study Areas.
S/N Sample ID Latitude (°) N Longitude (°) E Rn (Bq/L) Annual effective dose by ingestion (mSv/y)
1 EAW1 7.10 6.74 8.99±0.85 0.0591
2 EAW2 7.11 6.69 10.16±0.85 0.0668
3 EAW3 7.13 6.72 9.99±0.85 0.0656
4 EAW4 7.12 6.74 13.71±0.85 0.0901
5 EAW5 7.11 6.73 14.87±0.85 0.0977
6 EAW6 7.12 6.73 9.33±0.85 0.0613
7 EAW7 7.11 6.67 13.42±0.85 0.0882
8 EAW8 7.10 6.72 14.03±0.85 0.0922
9 OKW1 7.15 6.74 12.87±1.83 0.0846
10 OKW2 7.15 6.72 12.66±1.83 0.0832
11 OKW3 7.17 6.70 18.24±1.83 0.1198
12 OKW4 7.14 6.70 12.93±0.30 0.0850
13 OKW5 7.16 6.74 14.09±0.30 0.0926
14 OKW6 7.18 6.75 13.21±0.30 0.0868
15 OKW7 7.16 6.72 14.12±0.30 0.0928
16 EGW1 7.13 6.73 3.01±2.00 0.0198
17 EGW2 7.14 6.74 5.70±2.00 0.0374
18 EGW3 7.18 6.72 7.93±2.00 0.0521
19 EGW4 7.12 6.73 6.00±2.00 0.0394
20 EBW1 7.31 6.41 7.48±0.81 0.0491
21 EBW2 7.33 6.43 10.24±0.81 0.0673
22 EBW3 7.29 6.41 12.97±0.81 0.0852
23 EBW4 7.31 6.43 10.67±0.81 0.0701
24 EBW5 7.32 6.40 8.01±0.81 0.0526
25 EBW6 7.30 6.42 9.81±0.81 0.0645
Table 2. Mean radon concentration for well water samples from Idah.
Sample ID Mean radon concentration (Bq/L)
EAW 11.8
OKW 13.6
EGW 5.7
EBW 9.9
Average mean 10.23
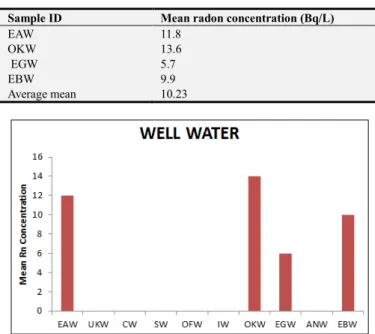
Figure 2. A Plot of Mean 222Rn Concentration obtained from Well Water Source.
The highest concentration of radon-222 from well water was recorded from Ofukolo with a range of 12.93Bq/L to 14.12Bq/L and a mean concentration of 13.58Bq/L. The radon concentration of samples from Ede-Adejo area ranges from 8.99Bq/L to 14.03Bq/L and a mean radon concentration of 11.81Bq/L, which are higher than the 11.1Bq/L set by [7] 10.0Bq/L by [20] recorded. This was followed by samples from Ede-Alaba and Ega, both having radon concentration ranging from 7.48Bq/L to 12.97Bq/L, 3.01Bq/L to 6.00Bq/L and a mean concentration of 9.86Bq/L and 5.70Bq/L respectively, which are lower than the 11.1Bq/L set by [7] and 10.0Bq/L by [20]. The frequency distribution of radon concentration in well water is presented on Figure 2. The high radon concentration recorded for these areas may be related to the radon source
234
U and 226Ra in the water – rock system present in the areas especially in Ofukolo and Ede – Adejo areas which posed a greater health risk when ingested along with water [24], because well sunk in areas with underground rock tend to show high content of granites to which radon is associated, in which radon-222 from fractures and cavities in rocks and in the regions influenced by local and remote anthropogenic radon sources [23]. Another reason that are attributed to this high radon concentration are human activities such as farming and other natural phenomenon such as weathering and volcanic action can also influence water radon content [26]. The results have shown a range of
222Rn concentration between 3.01±2.00 Bq/L to
18.24±1.83 Bq/L with a mean radon concentration of 9.64Bq/L and an average mean radon concentration of 10.23 Bq/L recorded for the study location. 75% of the water samples were found to be above the maximum contamination level of 11.1Bq/L set by [7], 10.0Bq/L set by [20] and [21]. The annual effective dose by ingestion for
both adult male and female in the study area range from 0.0198 mSv/y to 0.1198 mSv/y with a mean annual effective dose by ingestion of 0.0.721 mSv/y were recorded. This value is less than the recommended limit by ICRP [22]. The result of annual effective dose by ingestion revealed the likelihood of an associated risk of stomach cancer over many years which call for radon reduction of well water in the study area.
4. Conclusion
The present study showed that the radon concentration in the well water samples from Idah has been found to have an average mean 222Rn concentration of 10.23Bq/L for well water. The result show that recorded radon concentrations were above the maximum limit of 11.1Bq/L set by [7] and 10.0Bq/L by [20] and [21] which call for immediate action for radon reduction. Also comparing the result with the value 0.1Bq/L set by the [25], it was observed that all the water samples assayed for radon concentration are not safe for domestic purposes and consumption. It is expected that the people of Idah and its environs may likely suffer from stomach cancer, lung cancer, leukemia, chronic diseases etc. because of the high 222Rn concentration in well water from these sampled location as they are taking the water directly without no or proper treatment for radon in water. The annual effective dose by ingestion was found to be in the range of 0.0198 mSv/y – 0.1198 mSv/y with an average annual effective dose by ingestion found to be 0.0721 mSv/y which is lower than the recommended limit for members of the public of 1.0mSv/y and an intervention level of 3 - 10mSv/y set by the International Commission on Radiological Protection [22]. The results showed the samples from well water in this study are not safe for human consumption. Average mean concentration of 222Rn in well water was found to be higher than the standard limit s set by WHO and USEPA. The highest and lowest concentrations of radon were recorded for Ofukolo and Ega areas. The highest and lowest proportion of effective dose to the standard effective dose by [22] was found to belong to Ofukolo and Ega area. The annually received effective dose through the 222Rn of well water in Idah was lower than the standard limit of 0.1 mSv/y by [22]. Hence, the data obtained in this study could be used for the study location, since this work pioneer the determination of radon in well water in the study location.
References
[1] Gundersen, L. C. S.; Schumann, R. R.; Otton, J. K.; Owen, D. E.; Dubiel, R. F.; Dickinson, K. A. (1992). Geology of radon in the United States. Geol. Soc. Am. Spec. Pap., 271: 1–16. [2] Choubey, V. M. and Ramola, R. C. (1997). Correlation
between geology and radon levels in groundwater, soil and indoor air in Bhilangana Valley, Garhwal Himalaya, India.
[3] Choubey, V. M.; Sharma, K. K.; Ramola, R. C. (1997). Geology of radon occurrence around Jari in Parvati Valley, Himachal Pradesh, India. J. Environ. Radioact. 34: 139–147. [4] Skeppström, K. and Olofsson, B. (2007). Uranium and radon
in ground water. Eur. Water 17: 51–62.
[5] Hoehn, E.; von Gunten, H. R.; Stauffer, F.; Dracos, T. (1992). Radon-222 as a groundwater tracer. A laboratory study.
Environ. Sci. Technol. 1992, 26: 734–738.
[6] Crawford-Brown, D. J. (1991). Risk and Uncertainty Analysis for Radon in Drinking Water; Final Report; American Water Works Association: Chapel Hill, NC, USA.
[7] United State Environmental Protection Agency (USEPA) 1991. National primary drinking water regulations for radionuclide. US Government printing office, Washington D. C. EPA/570/991/700.
[8] Yu, D.; Kim, K. J. (2004). A Physiologically based assessment of human exposure to radon released from groundwater.
Chemosphere, 54, 639–645.
[9] Council Directive 2013/51/EURATOM of 22 October 2013 Laying Down Requirements for the Protection of the Health of the General Public with Regard to Radioactive Substances in Water Intended for Human Consumption. Available (accesed on 18th September, 2017).
[10] Moreno, V.; Bach, J.; Baixeras, C.; Font, L. (2014). Radon levels in groundwaters and natural radioactivity in soils of the volcanic region of La Garrotxa, Spain. J. Environ. Radioact. 128: 1–8.
[11] Corrêa, J.; Paschuk, S.; Kappke, J.; Perna, A.; França, A.; Schelin, H.; Denyak, V. (2014). Measurements of 222Rn activity in well water of the Curitiba metropolitan area (Brazil). Radiat. Phys. Chem. 104: 108–111.
[12] Cosma, C.; Moldovan, M.; Dicu, T.; Kovacs, T. (2008) Radon in water from Transylvania (Romania). Radiat. Meas. 43: 1423–1428.
[13] Papastefanou, C. (2002). An overview of instrumentation for measuring radon in soil gas and groundwaters. J. Environ. Radioact. 63: 271–283.
[14] Talha, S. A.; Lindsay, R.; Newman, R. T.; de Meijer, R. J.; Maleka, P. P.; Hlatshwayo, I. N.; Mlwilo, N. A.; Mohanty, A. K. (2008). Ray spectrometry of radon in water and the role of radon to representatively sample aquifers. Appl. Radiat. Isot.
66: 1623–1626.
[15] National Population Commission (NPC) 2006. National Population Commission Enumerated Area Demarcation Exercise.
[16] McCurry, P. 1976. The Geology of the Precambrian to lower Paleozoic rocks of Northern Nigeria. A review in Kogbe, C. A. (second edition), Geology of Nigeria. Elizabethan publication company Lagos, pp 13 – 37.
[17] Adams, N. B. (2010). An Analysis of the Location Pattern of Informal Automobile Artisans Workplaces in Idah, Kogi State. Unpublish MSc. Thesis.
[18] Paul, B. H. and Stephen, H. P. (1991). Determination of Radon in Drinking Water by Liquid Scintillation Counting Method 913.0. U. S. Environmental Protection Agency, Las Vegas, Nevada.
[19] Isam, S. M. M. (2003). Radon in Natural Waters Analytical Methods; Correlation to Environmental Parameters; Radiation Dose Estimation and GIS Application. Unpublished PhD Thesis.
[20] World Health Organization (WHO), 1993. Guidelines for Drinking Water Quality. vol. 1, 2nd edition.
[21] United Nations Scientific Committee on the Effects of Atomic Radiation (1993). Sources and Effects of Ionizing Radiation. UNSCEAR Report to the General Assembly with Scientific Annexes, United Nations, New York.
[22] ICRP, 2005. International Commission on Radiation Protection, Annals of ICRP 60: 411 – 440.
[23] Berezina, E. V. and E lansky, N. F. (2014). 222Rn Concentration in the Atmospheric Surface Layer Over Continental Russia from Observations in TROICA Experiments. Izv. Atmos. Ocean. Phys. 45: 757.
[24] Garba, N. N., Rabiu, N., Dewu, B. B. M., Sadiq, U., Yamusa, Y. A. (2013). Radon Assessment in Ground water Sources from Zaria and Environs, Nigeria. International Journal of Physical Sciences, 8 (42): 1983 – 1987.
[25] Standard Organization of Nigeria (SON) (2003). Inorganic Constituents for Drinking Water Quality.
[26] Oni, E. A., Oni, O. M., Oladapo, O. O., Olatunde, I. D., Adediwura, F. E. (2016). Measurement of Radon Concentration in Drinking Water of Ado - Ekiti, Nigeria. Journal of Academia and Industrial Research, 4 (8): 190 – 192.