ORIGINAL RESEARCH ARTICLE
Effect of A Community Health Worker led Intervention on Skilled
Birth Care in Rural Mwingi West Sub-County, Kenya: A Quasi
Experimental Study
DOI: 10.29063/ajrh2018/v22i3.7
Japheth M Nzioki
1*, Agnes J Korir
2, James H Ombaka
3, James O Ouma
4and Rosebella O
Onyango
5Department of Environmental Health and Disease Control, Jomo Kenyatta University of Science and Technology, Nairobi-Kenya1; Department of Development Studies, Daystar University, Nairobi, Kenya2; Department of Biomedical Sciences and Technology, Maseno University, Kisumu, Kenya3; Department of Environmental Health, University of Kabianga, Kericho, Kenya4; Department of Public Health, Maseno University, Kisumu, Kenya5
*For Correspondence: Email: [email protected]; Phone: +254720048474
Abstract
Despite strong evidence that skilled birth care (SBC) significantly reduces maternal deaths, one in four babies worldwide are delivered without SBC. This has kept maternal mortality rates (MMR) high in sub-Saharan Africa and Kenya in particular. Kenya adopted Community Health Strategy (CHS) with the aim of improving community health services. The aim of this study was to evaluate the effect of CHS on SBC in Mwingi west sub-county, Kenya. A quasi experimental study design was conducted with 1 pretest and 2 post-test household surveys done in intervention and control sites. Sample size in each survey was 422 households. Women with a child aged 9-12 months were main respondents. Binary logistic regression analysis was used to estimate the odds of SBC utilization before and after the intervention In intervention site; SBC utilization significantly improved by 12.9% (57.9% vs. 70.5%) and women in end term survey were 1.6 times (Adj. OR=1.556, P<0.0001; 95%CI: 1.295-1.868) more likely to deliver under SBC compared to baseline. Compared to control, the proportion of women delivering under SBC in intervention site increased by 8.6%. To improve maternal and child health outcomes in Kenya, implementation of CHS should be fast tracked in all counties. (Afr J Reprod Health 2018; 22[3]: 59-70).
Keywords: Community Health Strategy, Community Health Workers, Skilled Birth Care, Maternal and Child Health
Résumé
Malgré des preuves solides que les soins de naissance qualifiés (SNQ) réduisent de manière significative les décès maternels, un bébé sur quatre dans le monde est livré sans SNQ. Cela a maintenu les taux de mortalité maternelle (TMM) élevés en Afrique subsaharienne et au Kenya en particulier. Le Kenya a adopté une stratégie de santé communautaire (SSC) dans le but d'améliorer les services de santé communautaires. L‘objectif de cette étude était d‘évaluer l‘effet du SSC sur les SNQ dans le sous-comté de Mwingi l‘Ouest, au Kenya. Un plan d'étude quasi expérimental a été réalisé avec 1 pré-test et 2 enquêtes post-test sur les ménages effectuées dans des sites d'intervention et de contrôle. La taille de l'échantillon dans chaque enquête était de 422 ménages. Les femmes ayant un enfant âgé de 9 à 12 mois étaient les principales personnes interrogées. Une analyse de régression logistique binaire a été utilisée pour estimer les chances d'utilisation du SNQ avant et après l'intervention sur le site d'intervention. L'utilisation des SNQ s'est nettement améliorée de 12,9% (57,9% contre 70,5%) et les femmes en fin de traitement étaient 1,6 fois plus nombreuses (Adj. OR = 1,556, P <0,0001; IC à 95%: 1,295-1,868) à la ligne de base. Comparativement au groupe témoin, la proportion de femmes accouchant sous le SNQ dans le site d'intervention a augmenté de 8,6%. Pour améliorer les résultats en matière de santé maternelle et infantile au Kenya, la mise en œuvre de la SSC devrait être accélérée dans tous les comtés. (Afr J Reprod Health 2018; 22[3]: 59-70).
Introduction
Maternal survival has significantly improved since the adoption of Millennium Development Goals (MDGs). Globally, maternal mortality ratio dropped by 44% between 1990 and 20151. Despite this progress, every day hundreds of women die during pregnancy or from childbirth-related complications. Most of these deaths are in the developing regions, where MMR is about 14 times higher than in the developed regions1. By 2015, developing countries accounted for approximately 99% of global maternal deaths with sub-Saharan Africa alone accounting for roughly 66% followed by Southern Asia 2. In Kenya, MMR is high (510 per 100 000 live births)2. Skilled birth care (SBC) is one of the proven health interventions which can help reduce MMR by preventing and managing pregnancy and child birth related complications1.
SBC is defined as ―the process by which a woman is provided with adequate care during labor, delivery, and early postpartum period by a skilled attendant operating within an environment capable of providing care for normal deliveries as well as appropriate emergency obstetric care‖ while the term skilled birth attendants refers exclusively to accredited health professionals such as midwifes, doctors or nurses who have been educated and trained to proficiency in the skills needed to manage normal pregnancies, childbirth, and the immediate postnatal period.3,4 By end of 2014, more than 71% of deliveries were conducted under SBC globally1. This was a tremendous progress compared to 59 per cent observed in 19901. This progress however was not without inequalities. Literature reveals that regions with low SBC prevalence had the highest MMR. In sub-Saharan Africa and southern Asia Countries for example, the prevalence of women delivering under SBC was reported as 52% (lowest globally)1. Consequently, sub-Saharan Africa and Southern Asian regions have the highest MMR in the world with sub-Saharan Africa alone accounting for roughly 66% of maternal deaths globally (MMR 546 per 100 000 live births) followed by Southern Asia (176 per 100 000 live births)2. On the other hand, countries with high prevalence of SBC deliveries were reported to
have low MMR. Regionally, proportion of women delivering under SBC in Latin American and Caribbean countries, Caucasus and Central Asia, and eastern Asian countries is 92%, 96% and 100% respectively1. Consequently, these regions had a low MMR with Latin America and Caribbean countries having a MMR of 67 deaths per 100,000 live births, Caucasus and central Asia had 33 per 100, 000 live births, and eastern Asia had 27 per 100, 000 live births2.
Despite strong evidence that SBC significantly reduces maternal deaths, one in four babies worldwide are delivered without SBC1. In Kenya proportion of women who delivered under SBC improved markedly from 43% in the 2008/09 Kenya Demographic and Health Survey (KDHS) to 61% in the 2014 KDHS5. Despite this improvement, proportion of women delivering under SBC is still low in many parts of the Country. Nineteen out of the 47 Counties in Kenya have less than half of women delivering without SBC5. In Tana river county, that proportion is 31%, Wajir County -18%, Marsabit County -25%, Turkana County -23%, West Pokot County -25%, Samburu County -24%, Trans Nzoia County -41% and in Kitui County where Mwingi West sub-county is located, the proportion of women delivering without SBC is low at 45%5.
interventions9. Though Kenya did not meet MDG number 5, the country has embraced several interventions to meet MDGs. Evaluation of a Traditional Birth Attendant (TBA) led campaign in eastern part of Kenya established that the TBA led intervention was effective in increasing delivery under SBC10. Another study conducted to establish effectiveness of a CHW led health education on SBC in three rural locations in Kenya established that the campaign was effective in increasing SBC in intervention sites11.
In 2006, Kenya adopted a CHW led Primary Health Care intervention popularly referred to as the Community Health Strategy (CHS) with the aim of improving health service delivery at the community level12. In Mwingi West sub-county, CHS was initiated in 2011 by the Ministry of Public Health and Sanitation (MoPHS) in partnership with African Medical and Research Foundation (AMREF)-Kenya13. Since inception of CHS in Mwingi west Sub County, no evaluation has been conducted to establish the effect of the intervention on SBC. This coupled with the low uptake of SBC among women in the sub-county (45%)5 justified the need to carry out this assessment. The aim of this study was to evaluate the effect of CHS on utilization of SBC in Mwingi west Sub County.
Methods
The research design
This was a quasi-experiment study in which 1 pre- test and 2 post-test time series household surveys were conducted in both intervention and control sites. Data was collected at 3-time points; a baseline survey was used to collect baseline data in both intervention and control sites. First post intervention (midterm evaluation) survey data was collected in both intervention and control sites nine months after implementation of the CHS in intervention site. Second post intervention (end-term) survey data was collected in both intervention and control sites 18 months after implementation of the CHS in intervention site. Women of reproductive age with a child aged 9-12
months were main respondents. Each survey enrolled different participants.
Study area
This was an experimental study with intervention and control site. Intervention site was Mwingi west sub-county and control site was Mwingi North sub-county. Both sub counties are in Kitui County. Mwingi west sub-county has a total population of 111,346 people14. Mwingi North sub county has a total population of 150,179 people14. Intervention and control sites have similar climatic and ecological characteristics, poor infrastructure and are located in a rural arid and semi-arid area15.
The CHS intervention
CHS is a CHW led12 Primary Health Care (PHC) intervention in which CHWs play a leading role in providing PHC services. Among PHC services provided is MCH education and promotion. CHWs promoted SBC by identifying newly expectant women in the Community and educating them on importance of delivering under SBC among other MCH issues. CHWs then linked these mothers to local health centers to ensure they received essential MCH services including delivery under SBC.
Inclusion and exclusion criteria
In both intervention and control sites women with a child aged 9-12 months and who gave verbal or written informed consent were included in the study. Women excluded in the study are those with a child aged 9-12 months and did not give consent, and those with a child outside the age limit of 9-12 months.
Sample size determination
households) were added into this sample to cater for non-response. A total sample size of 422 households was determined.
Sampling procedure
Purposive and simple random sampling methods were employed. Purposive sampling was used to identify intervention and control sites. Mwingi west Sub County was purposively selected as intervention site since the CHS program was to be implemented in the sub county. Mwingi north sub county was also purposively sampled as the control site because the intervention was not under implementation in the sub county, and the sub county borders Mwingi West sub county15.
Simple random sampling was first used to assign villages into three clusters of data collection sites in each of the two sites (intervention and control sites). The three clusters identified in intervention and control sites were randomly assigned for baseline, midterm and end-term surveys as follows: In intervention site, Mwambui, Ikuusya and Thonoa villages of Waita Division/Ward were grouped in 1 cluster and randomly assigned for baseline survey, Wikithuki, Kairungu, and Kyethani villages of Kyethani Division/Ward were also in 1 cluster and randomly assigned for midterm survey, and Mbondoni and Kavuvwani villages of Kiomo Division/Ward were also in 1 cluster and randomly assigned for end-term survey. In control site, Kamuwongo, Ngaie, and Kimangao villages of Kyuso Division/Ward were grouped in 1 cluster and randomly assigned for baseline survey, Kimela, Mitamisyi, and Ikime villages of Ngomeni Division/Ward were also in 1 cluster and randomly assigned to midterm survey and Mutanda, Kyandali, and Kakuyu villages of Mumoni Division/Ward were in 1 cluster and randomly assigned for end-term survey.
The second step was to apply simple random sampling in identifying the study participants in both intervention and control sites. To accomplish this, the first thing was to develop a sampling frame for each of the three clusters in the intervention and the control sites respectively. House-Holds (HHs) included in the sampling frame were only those with child/children aged between 9-12 months as indicated in the inclusion
criteria. In intervention site, sampling frames were developed using household registers which were developed during creation of CUs. The household registers had socio-demographic data of all community members in each CU. Community meetings (barazas) were conducted to help identify the households with mothers of a child/children aged 9-12 months who had been selected in the household register. In the control site, community meetings facilitated by village elders and local chiefs were used in identification of households with mothers of a child or children aged between 9-12 months. Sampling frames were developed shortly before commencement of each survey. At baseline survey, midterm survey and end-term surveys sampling frames were developed in March/April 2012, February/March 2013, and March/April 2014 respectively.
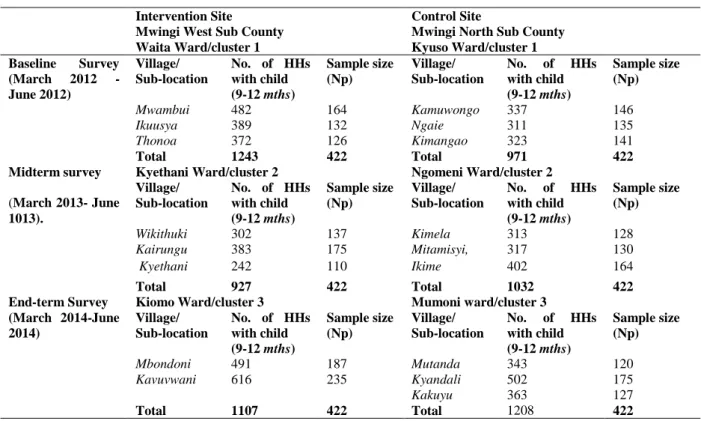
In intervention site, sampling frames were developed as indicated in the following; Mwambui, -482 HHs, Ikuusya-389 HHs and Thonoa-372HHs, (Total-1243 for baseline survey cluster), Wikithuki-302 HHs, Kairungu-383 HHs, Kyethani-242 HHs (total-927 for midterm survey cluster)), and Mbondoni 491HHs, Kavuvwani -616 HHs (total-1107 for end-term survey cluster)). In control site, sampling frames were developed as indicated in the following; Kamuwongo -337 HHs Ngaie-311HHs, Kimangao-323HHs (total 971 for baseline survey cluster), Kimela-313HHs, Mitamisyi, -317 HHs, Ikime-402 HHs (total 1032 HHs for midterm survey cluster)) and Mutanda-343 HHs, Kyandali -502 HHs, Kakuyu -363 HHs (total 1208 for end-term survey cluster).
A formula was used to calculate the proportion of representative sample size in each sub-location/village in a cluster as shown in the following;
Formula: Np=C/D x n
Where;
Np= Proportion of sample size of a given Sub-location/Village
C= total number of HHs in a Sub-location/village with a mother of a child /children aged 9-12 months
Table 1: Sampling Frames and Proportional Sample size in Intervention and Control Sites in Mwingi West and Mwingi North Sub-Counties, Kenya
Intervention Site
Mwingi West Sub County
Control Site
Mwingi North Sub County Waita Ward/cluster 1 Kyuso Ward/cluster 1 Baseline Survey
(March 2012 - June 2012)
Village/ Sub-location
No. of HHs with child (9-12 mths)
Sample size (Np)
Village/ Sub-location
No. of HHs with child (9-12 mths)
Sample size (Np)
Mwambui 482 164 Kamuwongo 337 146
Ikuusya 389 132 Ngaie 311 135
Thonoa 372 126 Kimangao 323 141
Total 1243 422 Total 971 422
Midterm survey
(March 2013- June 1013).
Kyethani Ward/cluster 2 Ngomeni Ward/cluster 2 Village/
Sub-location
No. of HHs with child (9-12 mths)
Sample size (Np)
Village/ Sub-location
No. of HHs with child (9-12 mths)
Sample size (Np)
Wikithuki 302 137 Kimela 313 128
Kairungu 383 175 Mitamisyi, 317 130
Kyethani 242 110 Ikime 402 164
Total 927 422 Total 1032 422
End-term Survey (March 2014-June 2014)
Kiomo Ward/cluster 3 Mumoni ward/cluster 3 Village/
Sub-location
No. of HHs with child (9-12 mths)
Sample size (Np)
Village/ Sub-location
No. of HHs with child (9-12 mths)
Sample size (Np)
Mbondoni 491 187 Mutanda 343 120
Kavuvwani 616 235 Kyandali 502 175
Kakuyu 363 127
Total 1107 422 Total 1208 422
Using SPSS, a sample size of 422 households was drawn from each sampling frame.
n = desired sample size (calculated as (422 HHs) Example: representative sample size for Mwambui village was calculated as follows;
Np=C/D x n where C=482, D=1243, and n=422, Np was calculated to be 164
Table 1 indicates a summary of the number of HHs in each sampling frame per sub location/village and the proportion of households sampled in each of the sampling frames in both intervention and control sites.
Data collection process
A pre-intervention survey was conducted to collect baseline data in both intervention and control sites. In the intervention site, baseline data were collected from a total 416 households while in the control site baseline data were also collected from a total of 411 households. This exercise took place from March 2012 to June 2012. Baseline survey was followed by two post intervention surveys in both intervention and control sites. Data for first
post intervention survey (mid-term survey) were conducted at least 9 months after implementation of the CHS in Mwingi west Sub County (from May 2013 to June 2013). In the intervention site data were collected in 413 households while in the control site data were also collected from 413 households. The second post intervention survey took place after at least18 months after implementation of the CHS (from March 2014 to June 2014). In this survey, data collection in intervention site was done from 417 households and in the control site data was collected from 420 households.
Variables in the study
The independent variable in the study is the intervention-CHS, while the dependent variable was utilization of SBC.
Study validity and reliability
collected in a randomly selected sample of 45 households (slightly above 10 per cent of the sample size) in three villages in Nzeluni sub location. Upon testing the data for reliability, the coefficient of internal consistency (Cronbach‘s alpha) was 0.864. This value was within the recommended range of 0.70-0.9517 and therefore we were assured that the questionnaire was reliable. Internal validity of the study was ensured by applying a sound methodology while external validity was ensured by use of a representative sample size.
Data analysis
To estimate net effect of CHS intervention on SBC, Difference-in-Differences (DiD) model was used to compare the net changes in SBC proportions over 18 months implementation time between intervention and control groups as proposed by Memon et al8 and, White and Sabarwal18. Z score tests were used to determine if proportions of women delivering under SBC before and after the intervention were significantly different. Binary logistic regression was used to control for potential confounders (socio-demographic characteristics) and establish the probability of a mother to deliver under SBC within the intervention and control sites over the 18 months of CHS intervention. SPSS version 20 was employed in this analysis.
Results
Socio demographic characteristics of study
population
Utilization of SBC among women in
intervention and control sites
At baseline, the proportion of women who delivered under SBC in intervention and control site was 57.9% and 46.5% respectively. At midterm survey; proportion of women delivering under SBC in intervention site increased by 8.7% (from 57.9 to 66.6%) while in control site, proportion of women delivering under SBC increased by 2.7% (from 46.5 to 49.2%). In end term survey; proportion of women delivering under SBC increased by 12.6% from (57.9 at baseline to 70.5%).
While in control site, the proportion of women who delivered under SBC increased by 4% compared to baseline (from 46.5% to 50.5%). These results are summarized inTable 3.
Difference in Differences proportion and Z
score tests measuring change in SBC Uptake
Baseline survey indicated that proportions of women who delivered under SBC in intervention (57.9%) and control (46.5%) sites were significantly different (Z= 3.2991, P<0.05). In intervention site; proportion of women who delivered under SBC at midterm survey (66.6%) was significantly different from proportion of women who delivered under SBC at baseline survey (57.9%) (Z= 2.5697, P<0.05). A comparison between proportion of women who delivered under SBC at end term survey (70.5%) in intervention site to the same proportion at base line survey (57.9%) also revealed a significant difference (Z= 3.7846, P< 0.001).
In the control site; no significant difference was observed in the proportions of women who delivered under SBC by comparing baseline SBC proportion (46.5%) with midterm SBC proportion (49.2%) (Z= 0.7702; P>0.05). Similarly, no significant difference was observed by comparing baseline SBC proportion (46.5%) DID Proportion with end-term SBC proportion (50.5%) in the same site (Z= 1.1547; P>0.05).
O
dds of utilizing SBC among women before
and after intervention
Initial comparison of intervention and control sites at baseline survey using binary logistic regression indicated that women in intervention site were 1.6 times more likely to deliver under SBC compared
to control (crude Odds Ratio (OR)= 1.586, P<0.05: 95%CI=1.205-2.088). However, after controlling for socio-demographic characteristics which include maternal age, parity, level of education, marital status and average household income, the adjusted OR indicated no significant difference in the odds of mothers who delivered under SBC Table 2: Social demographic characteristics of women in Mwingi West and Mwingi North Sub-Countries, Kenya
Age Mwingi
West
Mwingi North
Mwingi. West
Mwingi North
Mwingi West
Mwingi North F % F % F % F % F % F % 16-20 years 8 1.9 12 2.9 14 3.4 18 4.4 29 7.0 20 4.8
21-25 years 35 8.4 63 15.3 61 14.8 59 14.3 64 15.3 76 18.1
26-30 years 106 25.5 134 32.6 141 34.1 127 30.8 112 26.9 117 27.9
31-35 years 149 35.8 139 33.8 126 30.5 143 34.6 132 31.7 138 32.9
36-40 years 113 27.2 57 13.9 69 16.7 59 14.3 80 19.2 63 15.0
41-45 years 5 1.2 6 1.5 2 0.5 7 1.7 0 0 6 1.4
Total 416 100 411 100 413 100 413 100 417 100 420 100
Parity F % F % F % F % F % F %
1 Child 20 4.8 23 5.6 25 6.1 22 5.3 13 3.1 30 7.1 2 children 19 4.6 22 5.4 28 6.8 15 3.6 26 6.2 13 3.1 3 children 60 14.4 58 14.1 74 17.9 64 15.5 65 15.6 67 16.0 4 children 105 25.2 124 30.2 93 22.5 93 22.5 122 29.3 89 21.2 5 children 93 22.4 89 21.7 95 23.0 113 27.4 99 23.7 100 23.8 6 children 63 15.1 74 18.0 66 16.0 82 19.9 65 15.6 88 21.0 6 and above 56 13.5 21 5.1 32 7.7 24 5.8 27 6.5 33 7.9
Total 416 100 411 100 413 100 413 100 417 100 420 100 Education
Level
F % F % F % F % F % F %
No education 33 7.9 12 2.9 25 6.1 16 3.9 27 6.5 8 1.9 Primary level 141 33.9 86 20.9 127 30.8 108 26.2 102 24.5 124 29.5 Secondary level 149 35.8 228 55.5 167 40.4 187 45.3 208 49.9 167 39.8 College/University 93 22.4 85 20.7 94 22.8 102 24.7 80 19.2 121 28.8
Total 416 100 411 100 413 100 413 100 417 100 420 100
Occupation F % F % F % F % F % F %
Not working 8 1.9 10 2.4 13 3.1 15 3.6 34 8.2 15 3.6 Peasant Farmer 206 49.5 233 56.7 225 54.5 247 59.8 226 54.2 230 54.8 Business 105 25.2 117 28.5 91 22.0 92 22.3 99 23.7 108 25.7 employment 97 23.3 51 12.4 84 20.3 59 14.3 58 13.9 67 16.0
Total 416 100 411 100 413 100 413 100 417 100 420 100 Marital
Status
F % F % F % F % F % F %
Single 21 5.0 31 7.5 30 7.3 44 10.7 40 9.6 34 8.1 Married 306 73.6 350 85.2 299 72.4 328 79.4 311 74.6 337 80.2 Windowed 24 5.8 12 2.9 16 3.9 15 3.6 18 4.3 18 4.3 Separated/ Divorced 65 15.6 18 4.4 68 16.5 26 6.3 48 11.5 31 7.4
Total 416 100 411 100 413 100 413 100 417 100 420 100 Monthly
Income
F % F % F % F % F % F % ≤2500 118 28.4 219 53.3 153 37.0 221 53.5 161 38.6 242 57.6
2501 - 5000 129 31.0 109 26.5 122 29.5 94 22.8 133 31.9 86 20.5
5001 - 7500 45 10.8 32 7.8 53 12.8 29 7.0 47 11.3 22 5.2
7501 - 10000 66 15.9 12 2.9 14 3.4 18 4.4 15 3.6 19 4.5
> 10000 58 13.9 39 9.5 71 17.2 51 12.3 61 14.6 51 12.1
Table 3: Utilization of SBC among Women in intervention and control sites in Mwingi West Sub-County, Kenya
Table 4: Z score tests measuring change in SBC proportions in Mwingi West Mwingi North sub-counties
Table 5: Initial Comparability of Odds of at SBC Utilization Baseline
Table 6: Odds of Utilizing SBC among Women in Intervention and Control Sites
between intervention and control site at baseline survey (Adj. OR=0.993, P>0.05, 95%CI: 0.681 -1.448). These results are summarized in Table 5.
In the intervention site; a binary logistic regression comparing odds of women who delivered under SBC revealed a significant difference between; baseline survey and midterm survey, and between baseline survey and end term survey. Women in the midterm survey were found to be 1.4 times and 1.7 times more likely to deliver under SBC compared to women at baseline survey in the crude and adjusted ORs respectively [(crude OR=1.447, P<0.05; 95% CI: 1.091-1.919), Adj. OR=1.681, P<0.05; 95%CI: 1.168-2.419)]. A comparison between baseline survey and end-term
survey in intervention site indicated that women in the end term survey were 1.3 times more likely to deliver under SBC compared to women at baseline survey (crude OR=1.321, P<0.0001; 95% CI: 1.144-1.525). After adjusting for social demographic characteristics women in end term survey were found to be 1.6 times more likely to deliver under SBC compared to women at baseline (Adj. OR=1.556, P<0.0001; 95%CI: 1.295-1.868).
In the control site; no significant difference in the odds of women who delivered under SBC was observed between baseline survey and midterm survey [(crude OR=1.113, P>0.05; 95% CI: 0.847-1.464), Adj. OR=1.154, P>0.05; 95%CI: 0.835-1.594)]. A comparison between
Survey Intervention site Control Site
SBC Non -SBC SBC Non-SBC
Frq. % Frq. % Frq. % Frq. %
Baseline 241 57.9 175 42.1 191 46.5 220 53.5
Midterm (9months) 275 66.6 138 33.4 203 49.2 210 50.8
End-Term (18 months) 294 70.5 123 29.5 212 50.5 208 49.5
Site Baseline Mid-term (9
months)
End term (18 months)
Midterm-Baseline End term-Baseline
Intervention 241/416 (57.9%) 275/413 (66.6%)
294/417 (70.5%) Z= 2.5697 P=0.01016*
Z= 3.7846 P=0.00016* Control 191/411 (46.5%) 203/413 (49.2%) 212/420 (50.5%) Z= 0.7702
P=0.4413
Z= 1.1547 P=0.25014 Int-Ctr Z= 3.2991
P=0.00096*
Z= 5.0736 P=0.00*
Z= 5.925 P=0.00*
DID (%) = (70.5-57.9) - (50.5-46.5) = 8.6%
Baseline Survey Crude vs. Adj. Sig. OR 95% CI Intervention Vs. Control Crude OR 0.001* 1.586 1.205 -2.088
Adjusted OR 0.970 0.993 0.681 -1.448
Site Survey Crude Vs. Adj. OR Sig OR 95%CI
Intervention site Midterm vs. Baseline
Crude OR 0.010* 1.447 1.091-1.919
Adjusted OR 0.005* 1.681 1.168-2.419 End term Vs.
Baseline
Crude OR 0.0001* 1.321 1.144-1.525
Adjusted OR 0.0001* 1.556 1.295-1.868 Control Site Midterm vs.
Baseline
Crude OR 0.441 1.113 0.847-1.464 Adjusted OR 0.386 1.154 0.835-1.594
End term Vs. Baseline
baseline survey and end-term survey also revealed no significant difference in the odds of women who delivered under SBC between the two groups [(crude OR=1.083, P>0.05; 95% CI: 0.945-1.241), Adj. OR=1.097, P>0.05; 95%CI: 0.936-1.285)]. These results are summarized in Table 6.
Discussion
Prevalence of women who delivered under SBC at baseline was 57.9% and 46.5% in intervention and control site respectively. Z score tests found in Table 3 indicate that the 2 proportions are significantly different. This could be the result of confounders mostly coming from the difference in socio-demographic characteristics of the two populations. This is confirmed by a binary logistic regression analysis which indicated that after controlling for socio-demographic characteristics as potential confounders, there was no significant difference in the odds of women who delivered under SBC in intervention site compared to control site at baseline. This therefore suggests that the two SBC proportions could be equal if not for the influence of the difference in socio-demographic characteristics in the two populations. This therefore suggests that intervention and control site SBC proportions at baseline are in the same range with the 45.6% SBC prevalence reported for Kitui county (which hosts both intervention and control sites) by the KDHS 20145.
Regarding the effect of CHS on SBC in intervention site, proportion of women who delivered under SBC increased significantly by 8.7% (from 57.9% at baseline survey to 66.6% at midterm survey). This was supported by a binary regression analysis conducted to compare probability of SBC utilization in midterm survey and baseline survey. Adjusted ORs indicated that, women at midterm survey were 1.7 times more likely to deliver under SBC compared to women at baseline survey. The highest significant increase in SBC utilization in intervention site was however observed at end term survey. SBC utilization increased by 12.6% (from 57.9% at baseline to 70.5% at end-term survey). Adjusted ORs indicated that women at end term survey were 1.6 times more likely to deliver under SBC compared to women at baseline survey.
In control site, no significant difference was observed between base line SBC proportion and midterm survey SBC proportion. A comparison between end term and baseline survey SBC proportions yielded a marginal 4% increment in SBC utilization which was not significant. Adjusted ORs indicated no significant difference in odds of SBC utilization between these groups. These observations lead to one conclusion, that the observed increase in proportion of women delivering under SBC in intervention site, and the observed increase in the odds of women delivering under SBC in end term survey compared to baseline survey in intervention site is the result of the effect of CHS. Health education and counseling program and follow up of expectant women by CHWs in intervention site was effective in increasing the number of women delivering under SBC in intervention site compared to control site. The net effect as shown by the DID indicates that over the 18 months of implementation of CHS, proportion of women utilizing SBC in intervention site increased by 8.6%.
It is important to note that though national implementation of free maternity services in Kenya was implemented on 1st June, 201322 , free maternity services seemed to have had little or no impact on the proportion of women who delivered under SBC in both intervention and control sites. This is based on observation that no significant change was observed between midterm and end term survey in the control site. However, it is also important to note that end term survey data was collected in both intervention and control sites in less than one year (from March 2014 to June 2014) after implementation of free maternity services in Kenya and this perhaps was not enough time for the free maternity service to have a positive impact in the community.
20159. A reviewed of 12 studies conducted in Rwanda revealed that, the country has a network of 45,011 CHWs9. Each village in Rwanda has at least 3 CHWs including two general CHWs (a female and a male), responsible for community health education, nutrition, and HIV prevention. Besides these 2 CHWs, each village has a CHW, known as ‗Mobilizer for Maternal Health‘-a female responsible for carrying out community– based interventions specifically focusing on MCH9. These CHWs play a critical role in linking expectant women in the communities with health facilities9. This in turn improved SBC and significantly reduced MMR by 78% (from 1300/100,000 live births in 1990 to 290/100,000 live births in 2015)9.
Another study which reviewed evidence from CHW led interventions in Rwanda, Afghanistan, Nigeria, and Nepal indicates that CHWs demonstrated that they were effective in delivery of MCH related community-based primary healthcare interventions23. In Kenya, several studies have confirmed that CHWs are effective in promoting SBC. A CHW led health education program in some parts of rural Kenya was found to be effective in increasing deliveries under SBC 11. Two other similar studies conducted to assess effectiveness of CHS in health outcomes in parts of western Kenya , Nyanza, Garissa and Busia indicate that CHS was effective in promoting SBC21,24.
Study Limitations
The study had several important limitations; the most important of these was selection of intervention and control sites. Since implementation of the CHS was a MoPHS and AMREF-Kenya project which was designed to be implemented in Mwingi West sub county, it was not feasible to randomly assign the CHS intervention to community members in Mwingi west sub county. This is the reason why a non-randomized pre-test and post-test experimental study design was deemed appropriate. Though this method has been employed in other similar studies8,11,19-21, evidence from this design is weaker compared to a randomized controlled trial. Secondly, researchers were also not able to
account for possibility of other programs that could influence MCH outcomes of interest in the intervention site. However, there was an attempt to reduce the effect of confounding factors through; treating socio-demographic characteristics of both intervention and control sites as potential confounders and having them controlled in the binary logistic regression model used in data analysis, by matching the control to the intervention sites by geographical location, and infrastructural characteristics, and by removing the difference in the outcome between intervention and control groups at the baseline by applying DID model as proposed by reference18.
Ethical Considerations
Ethical clearance for this study was provided by the National Council of Science and Technology (NCST) of the Government of Kenya (GoK).
Conclusion and Recommendation
CHS increased SBC utilization in intervention site by 12.9%. Women in end-term survey of the intervention site were 1.6 times more likely to deliver under SBC compared to women at baseline survey in the same site. In the 18 months CHS was implemented in Mwingi West sub-county, the intervention increased SBC utilization by 8.6% compared to control. To increase the number of women in Kenya delivering under SBC, government need to fast-track implementation of CHS in all sub counties. This will decrease MMR in Kenya and improve MCH outcomes which in turn will help Kenya meet the health-related Sustainable Development Goals by 2030.
Acknowledgements
Authors thank all respondents for their willingness and consent to participate in the study. We also acknowledge and thank all research assistants for their tireless efforts without which this research work would not have been completed.
Competing Interests
Contribution of Authors
JMN conceived the idea and developed the manuscript. JOO analyzed the data, JHO and ROO supervised the entire study and read the work for intellectual input. AJK read the manuscript for intellectual input.
References
1. United Nations. The Millennium Development Goals Report. Geneva: United Nations. 2015:72. 2. World Health Organization. Trends in Maternal
Mortality: 1990 to 2015 :Estimates by WHO, UNICEF, UNFPA, World Bank Group and the United Nations PopulationDivision. Geneva: World Health Organization; 2015.
3. Utz B, Siddiqui G, Adegoke A and Van Den Broek N. Definitions and roles of a skilled birth attendant: A mapping exercise from four South-Asian countries. Acta Obstet Gynecol Scand. 2013;92(9):1063-1069. doi:10.1111/aogs.12166.
4. Canavan A (2009). Review of Global Literature on Maternal Health Interventions and Outcomes Related to Provision of Skilled Birth Attendance. Amsterdam: Royal Tropical Institute; 2009. 5. Kenya National Bureau of Statistics (KNBS) and ICF
Micro. Kenya Demographic and Health Survey, Key Indicators, 2014. Calverton, Maryland: KNBS and ICF Macro.; 2014.
6. Huq NL, Ahmed A, Haque N Al, Hossaine M, Uddin J, Ahmed F and Quaiyum MA. Effect of an integrated maternal health intervention on skilled provider‘s care for maternal health in remote rural areas of Bangladesh: a pre and post study. BMC Pregnancy Childbirth. 2015;15(1):104. doi:10.1186/s12884-015-0520-5.
7. Okereke E, Yisa I, Akerele A, Obonyo B and Egboh M. Increasing health equity and access to skilled birth delivery services for the poor through community-based health-care interventions: evidence from northern Nigeria. BMC Health Serv Res. 2014;14(Suppl 2):P90. doi:10.1186/1472-6963-14-S2-P90.
8. Memon ZA, Khan GN, Soofi SB, Baig IY and Bhutta ZA. Impact of a community-based perinatal and newborn preventive care package on perinatal and neonatal mortality in a remote mountainous district in Northern Pakistan. BMC Pregnancy Childbirth. 2015;15(1):106. doi:10.1186/s12884-015-0538-8. 9. Bucagu M. Improving Maternal Health in Rwanda: The
Role of Community-Based Interventions: A Systematic Review (2005-2015). J Community Med Health Educ. 2016;6(3):1-6. doi:10.4172/2161-0711.1000434.
10. Tomedi A, Tucker K and Mwanthi MA. A strategy to increase the number of deliveries with skilled birth attendants in Kenya. Int J Gynecol Obstet.
2013;120(2):152-155.
doi:10.1016/j.ijgo.2012.09.013.
11. Adam MB, Dillmann M, Chen M-K, Mbugua S, Ndung'u J, Mumbi P, Waweru E and Meissner P. Improving maternal and newborn health: effectiveness of a community health worker program in rural kenya. PLoS One. 2014;9(8):e104027. doi:10.1371/journal.pone.0104027.
12. Ministry of Health. Taking the Kenya Essential Package for Health to the COMMUNITY A Strategy for the Delivery of Level One Services. Nairobi: Health Sector Reform Secretariat , Government of Kenya; 2006.
13. Nzioki JM, Onyango RO and Ombaka JH. Efficiency and factors influencing efficiency of community health strategy in providing maternal and child health services in Mwingi district, Kenya: An expert opinion perspective. Pan Afr Med J. 2015;20:1-7. doi:10.11604/pamj.2015.20.88.4711.
14. Kenya National Bureau of Statistics (KNBS). The 2009 Kenya Population and Housing Census: Population Distribution by Age, Sex and Administrative Units. Vol IC. Nairobi: Kenya National Bureau of Statistics; 2010. Available at: http://statistics.knbs.or.ke/nada/index.php/catalog/5 5.
15. County Government of Kitui. First County Integrated Development Plan; Planning for Sustainable Socio-Economic Growth and Development. Nairobi: County Government of Kitui; 2013.
16. Fisher AA, Laing JE, Stoeckel JE and Townsend JW. Handbook for Family Planning Operations
Research. Second Edi. New York: Population Council; 1998.
17. Tavakol M and Dennick R. Making sense of Cronbach‘s alpha. Int J Med Educ. 2011;2:53-55. doi:10.5116/ijme.4dfb.8dfd.
18. White H and Sabarwal S. Quasi-Experimental Design and Methods, Methodological Briefs: Impact Evaluation 8. Florence: UNICEF Office of Research; 2014. 19. Irvin VL and Kaplan RM. Screening mammography &
breast cancer mortality: Meta-analysis of quasi-experimental studies. PLoS One. 2014;9(6). doi:10.1371/journal.pone.0098105.
20. Harris A, McGregor J, Perencevich E, Furuno JP, Zhu J, Peterson D and Finkelstein J. The Use and interpreatation of Quasi-Experimental Studies in Medical Informatics. J Am Med Inf Assoc. 2006;13(1):16-23. doi:10.1197/jamia.M1749. 21. Olayo R, Wafula C, Aseyo E, Loum C and Kaseje D. A
quasi-experimental assessment of the effectiveness of the Community Health Strategy on health outcomes in Kenya. BMC Health Serv Res. 2014;14(Suppl 1):S3. doi:10.1186/1472-6963-14-S1-S3.
22. Wamalwa EW. Implementation challenges of free maternity services policy in kenya: The health workers perspective. Pan Afr Med J. 2015;22:1-5. doi:10.11604/pamj.2015.22.375.6708.
J. International Journal of Gynecology and Obstetrics Experiences engaging community health workers to provide maternal and newborn health services : Implementation of four programs. Int J Gynecol Obstet. 2015;130:S32-S39. doi:10.1016/j.ijgo.2015.03.006.