outcomes
ORIGINAL RESEARCH ARTICLE
Changing Face of Family Planning Funding in Kenya: A
Cross-Sectional Survey of Two Urban Counties
DOI: 10.29063/ajrh2017/v21i4.3
Nelson Keyonzo
1*, Julius Korir
2, Faith Abilla
3, Morine Sirera
4, Peter Nyakwara
5, Eva Bazant
6,
Charles Waka4, Nancy Koskei
4, Mark Kabue
6Tupange/Jhpiego Kenya1; Kenyatta University2; International Planned Parenthood Foundation (IPPF)–Africa Region3; Jhpiego Kenya4; Tupange/National Council for Population and Development, NCPD5; Ministry of Devolution and Planning, Jhpiego Baltimore6
*For Correspondence: E-mail: [email protected]; [email protected]; [email protected]; Phone: 410-537-1993
Abstract
As international development partners reduce funding for family planning (FP) programs, the need to estimate the financial resources devoted to FP is becoming increasingly important both at all levels. This cross-sectional assessment examined the FP financing sources, agents, and expenditures in two counties of Kenya for fiscal years 2010/2011 and 2011/2012 to guide local decision-making on financial allocations. Data were collected through a participatory process. This involved stakeholder interviews, review of financial records and service statistics, and a survey of facilities offering FP services. Financing sources and agents were identified, and source amounts calculated. Types of FP provider organizations and the amounts spent by expenditure categories were identified. Overall, five financing sources and seven agents for FP were identified. Total two-year expenditures were KSh 307.8 M (US$ 3.62 M). The government‘s share of funding rose from 12% to 21% over the two years (p=0.029). In 2010/2011, the largest expense categories were administration, commodities, and labor; however, spending on commodities increased by 47% (p=0.042). This study provides local managers with FP financing and expenditure information for use in budget allocation decision-making. These analyses can be done routinely and replicated in other local counties or countries in a context of devolution. (Afr J Reprod Health 2017; 21[4]: 24-32).
Keywords: Contraception, Expenditure, Budget, Decision-making
Résumé
A mesure que les partenaires internationaux au développement réduisent le financement des programmes de planification familiale, la nécessité d'estimer les ressources financières consacrées à la planification familiale prend de plus en plus d'importance à tous les niveaux. Cette évaluation transversale a étudié les sources de financement de la PF, les agents et les dépenses dans deux comtés du Kenya pour les exercices 2010/2011 et 2011/2012 afin de guider la prise de décision locale sur les allocations financières. Les données ont été collectées à travers un processus participatif. Cela impliquait des entrevues avec les intervenants, un examen des dossiers financiers et des statistiques sur les services, ainsi qu'une enquête sur les établissements offrant des services de PF. Les sources de financement et les agents ont été identifiés et les montants de la source ont été calculés. Les types d'organisations prestataires de la PF et les montants dépensés par catégories de dépenses ont été identifiés. Dans l'ensemble, cinq sources de financement et sept agents de la PF ont été identifiés. Les dépenses totales pour deux ans s'élevaient à 307,8 millions de shillings kenyans (3,62 millions de dollars UE). La part du gouvernement dans le financement est passée de 12% à 21% au cours des deux années (p = 0,029). En 2010-2011, les catégories de dépenses les plus importantes étaient l'administration, les produits de base et la main-d‘œuvre; cependant, les dépenses en produits de base ont augmenté de 47% (p = 0,042). Cette étude fournit aux gestionnaires locaux des informations sur le financement et les dépenses de la PF à utiliser dans la prise de décision en matière d'allocation budgétaire. Ces analyses peuvent être effectuées régulièrement et reproduites dans d'autres comtés ou pays dans un contexte de décentralisation. (Afr J Reprod Health 2017; 21[4]: 24-32).
Mots-clés: Contraception, dépenses, budget, prise de décision
Introduction
Globally, contraceptive use is associated with a reduction in maternal mortality of 44%1 and in
rate of population growth and reduce extreme poverty3–7.
Contraceptive prevalence in Kenya has risen from 27% in 1989 to 58% in 20143,4. However, the unmet need for family planning (FP) nationally is 25%8. For the Government of Kenya to reach its goal of reducing unmet need for FP and increasing contraceptive use3, it is necessary to focus on quality and equity in delivery of health services9 and using new approaches to scale up FP delivery10,11. An understanding of the funding landscape will be a key part of this process12.
Globally, government health spending as a share of total government spending is significantly associated with greater equity in the use of modern contraceptive methods13. As governments—and increasingly local governments—aim to provide FP among other health services to growing and more hard-to-reach populations, it is increasingly important to budget and forecast program funding sources and costs. International development partners have reduced funding for FP from historically high levels14. FP service delivery organizations need to raise funds strategically and be more accountable and efficient with available funds. However, most of the tools currently available to track the proportion of funding dedicated to FP do not offer accurate and up-to-date information about FP funding for use by local planners and decision-makers15,16. Funding trends and sources for FP at the local level are increasingly receiving attention, including in Kenya17.
In Kenya, the landscape for health service delivery in has changed under decentralization, also called devolution. In 2010, Kenya adopted a devolved governance system that transferred decision-making and service provision in health from the national to the county level18. County governments are now empowered to make key resource decisions related to health. For local governments, information on funding sources, agents, and utilization of FP resources is important for transparency of decision-making and accountability to the funders as well as the beneficiaries.
Prior to the devolution of government in
billion (US$ 1,389 million [M]) in 2005/06 to KSh 123 billion (US$ 1,620 M) in 2009/10. The sources of funds were the Government of Kenya (29%); the domestic private sector, including households (37%); and development partners (34%). Total reproductive health (RH) expenditures were KSh 12.92 billion (US$ 170 M) in 2005/06 and KSh 17.07 billion (US$ 225 M) in 2009/10. The sources were government (40%), private sector (38%), and development partners (22%)19. In 2009/10, public RH expenditures as a percentage of total government expenditures were only 2.58%20.
However, little published research describes program expenditures specifically for FP. Costs related to FP service provision are not easy to determine because, in health budgets by ministries and development partners, FP allocation is often grouped together with maternal and child health funds. Understanding the funds allocated for FP specifically requires disaggregating larger budgets. This makes it difficult for governments and non-state actors to know the funding levels and sources allocated to FP and how the funds are used. This study describes a participatory approach to estimating the total resources devoted to FP in Kenya in the urban counties of Kisumu and Mombasa, including sources and expenditures in a two-year period. A secondary objective was to test the feasibility of the participatory methods used to document funding sources and levels and indicate whether they can be replicated in other contexts that have experienced devolution of resource allocation and expenditure to local governments.
Methods
This cross-sectional study collected data for fiscal years 2010/2011 and 2011/2012 from multiple data sources: facility managers, funding agencies and service providers.
funding or operating FP programs and health facility in-charges to share the study objectives and review the tools.
The study did not meet the criteria for human subjects‘ research as per the regulations of the U.S. Department of Health and Human Services, Office of Human Research Protections21 by the implementing agency and, therefore, Institutional Review Board ethical review was not sought.
Sampling
This study was conducted in two purposively selected counties, Mombasa and Kisumu, because they were the sites where the Tupange (―Let‘s Plan‖ in Kiswahili) urban FP program was being implemented and are among the three largest cities in Kenya11. Three types of organizations involved with FP were identified as financing sources, financing agents, and service providers, a categorization like that used by other FP financing studies15. Financing sources supply the money that pays for FP services, including commodities and personnel. Financing agents, such as government ministries and nongovernmental organizations (NGOs), act on behalf of financing sources (as a pass-through) and determine how funds are spent.
Service providers are the health facilities and other service delivery points that deliver health services to clients.
We collected data from all the known financing agents within the two counties and obtained an up-to-date directory of all the health facilities in these counties22. The selection of the sites was done in consultation with the Sub-County Reproductive Health Coordinator, based on health system level and managing authority. The facilities included provincial hospitals, district and sub-district hospitals, health centers, dispensaries, faith-based organizations (FBOs), and private facilities. Stratified sampling was used to select the facilities from the targeted population. Facilities were eligible for the study if they offered FP services, were operated as not-for-profit entities, and received financial support from a financing agent.
Data collection
In this study, two research assistants from each city were trained on study objectives, tools, and procedures for confidentiality.
The financing agent data collection tool and a facility questionnaire were adapted from a previous health financing study that tracked HIV/AIDS spending in Kenya23.
The financing agent tool was used to identify the origin and recipients of the funds, and any income generated by the agent. For financial years 2010/2011 and 2011/2012, data on the total amount of FP income spent by the agents and the expenditure categories of material supplies, salaries, allowances, training, maintenance and repair services, rent, utilities, communication, and consultancy services were collected. The tool captured the amount of funds provided by financing sources to the different financing agents and how the funds were distributed to providers for FP implementation. The questions related to the funds‘ terms and conditions, expenditure reporting, and perceived adequacy of funds for FP services. For verification, the financing agent data were compared to the records held at the financing agents‘ administrative offices where the records are kept.
At the health facility level, the research team carried out structured, oral interviews with the facility in-charge using the facility questionnaire. The research team also abstracted data from facility-based summary reports24 on workload25 and FP commodities26. These data were entered by the Sub-County Health Records Officer into the national system, the District Health Information Software 2 (DHIS2) 27.
Table 1: Sampling of Health Facilities for Family Planning in Kisumu and Mombasa Counties
Note: Private includes faith-based organizations and non-governmental organizations.
Facilities eligible for the study participation were those receiving financial support from a financing agent.
information, education, and communication materials; as well as funds spent on outreach, information technology, training for FP service providers, and salaries. Data collection occurred from August to September 2012.
Data analysis
Microsoft Excel was used for data capture and cleaning. From the financing agent data, we calculated the amount spent on commodities and supplies, outreach activities, administration (salaries, utilities, rent for offices, and purchase of equipment such as vehicles; technical assistance that was not a consultancy; and training), and program-level labor cost of financing agents, consisting of expenditures on personnel compensation.
To estimate health facility labor costs devoted to FP services, several variables were used: the number of personnel involved in FP service provision for each day of the week, the average salary for the cadre, and time spent by personnel on FP. This was extrapolated to annual time spent on FP service provision and converted into full-time equivalent staff for nurses and clinical officers. The full-time equivalent was multiplied by the annual gross pay to obtain annual cost or expenditure attributed to staff utilization in FP service provision. This estimated expenditure was averaged per facility for each level of care. The average cost was multiplied by the number of all facilities, by level, providing FP services to obtain the overall labor cost. To provide a preliminary assessment of trends in the proportion of FP financing sources and the share of each expense type from one year to the next, a
chi-Results
Facilities that participated in the study included a public provincial hospital and a district hospital in Kisumu and Mombasa each. In Mombasa, two of the four sub-district hospitals were selected randomly and participated, as did one sub-district hospital in Kisumu. Overall, there were 176 facilities providing FP in the two counties. Of these, only 56 met the eligibility criteria. Data were unable to be collected from 10 facilities. We collected data from 46 of the 56 eligible facilities; 82% response rate (Table 1).
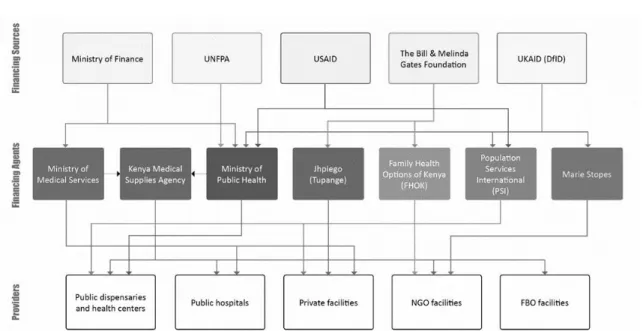
In total, five financing sources for FP were identified: The Ministry of Finance, United Nations Population Fund, U.S. Agency for International Development, the Bill & Melinda Gates Foundation, and U.K. Department for International Development. (Figure 1)
There were seven financing agents receiving funds for FP services in Mombasa and Kisumu. The financing agents included three government entities (Ministry of Medical Services, Ministry of Public Health, and Kenya Medical
Supplies Agency) and four NGOs
(Jhpiego/Tupange, Family Health Options of Kenya, Population Services International, and Marie Stopes Kenya). These agents, in turn, provided resources to government providers, including public dispensaries, health centers, and hospitals, and to private providers, including facilities operated by NGOs and FBOs. Family Health Options of Kenya also operated as a provider.
Total expenditures on FP from government and development partners in the two counties
Kisumu Mombasa Both
Facilities Public
N (%)
Private N (%)
Total N (%)
Public N (%)
Private N (%)
Total N (%)
Public N (%)
Private N (%)
Total N (%) Provided family
planning in 2010
29 28 57 26 93 119 55 121 176
Eligible (a) 17 (59) 17 (60) 34 (60) 15 (58) 7 (8) 22 (18) 32 (58) 24 (20) 56 (32)
Responded (Response Rate)
Note: NGO providers include Family Health Options of Kenya and Marie Stopes Kenya, which are also Financing Agents, and the German Development Bank KfW.
Figure 1: The Flow of Resources for Family Planning Services from Financing Sources to Financing Agents to Provider Organizations in Kisumu and Mombasa
(US$ 1.66 M) in 2010/11 and KSh 166.64 M (US$ 1.96 M) in 2011/12, for a two-year total of KSh 307.80 M (US$ 3.62 M) (Table 2)
FP funding provided by the Government of Kenya to these two counties increased from KSh 17.4 M (US$ 0.2 M) to KSh 35.3 M (US$0.4 M) over the two-year period, and its share of total FP funding rose from 12% to 21% (p=0.029).
Among the financing agents (Table 2), three NGOs with international affiliations were the largest recipients (Jhpiego/Tupange, at KSh 100.42, US$ 1.18; Population Services International at KSh 65.95, US$ 0.78; and Marie Stopes Kenya at KSh 61.80, US$ 0.73), followed by the Ministry of Health (KSh 52.69, US$ 0.62). In Year 1, the FP expense category was largest for administration (KSh 58.4 M, US$ 0.69 M); commodities (FP methods) (KSh 27.4 M, US$ 0.32 M); and labor cost (KSh 13.5 M, US$ 0.16 M) (Table 3). By Year 2, administration decreased by 52% (p <0.001), whereas commodities increased by 47% (p=0.042). Other expenses in Year 2 in decreasing order were training, outreach, pharmaceutical supplies, salaries, and advocacy.
Discussion
Even though many institutions are involved in FP services in Kenya, four international NGOs are providing the largest share of contributions to FP (80%) in the two surveyed counties. This reliance on donors suggests a need to advocate for greater national and county government contribution toward the FP program. International donors have figured heavily in national sources for RH29. In the present study, an increase in funding from the Government of Kenya was observed at the county level. Tupange advocacy activities at the national and county levels may have contributed to increased national financial government support for FP commodities.10 This may signal a trend toward greater government funding of FP.
Table 2: Financing Sources for Family Planning in Kisumu and Mombasa Counties, 2010–2012 (000‘s)
2010/11a 2011/12a 2010–2012
Agent KSh US$b Proportion
of Total
KSh US$ b Proportion of Total
Relative change
KSh US$ b P-value for
change f
Proportion of Total
Ministry of Health c 17,440 210 0.12 35,250 410 0.21 71% 52,690 620 0.029 0.17
Partners d
NGO
KfW 3,320 40 0.02 0.00 0.00 0.00 -100% 3,320 40 NS 0.01
Jhpiego 32,660 380 0.23 67,760 800 0.41 76% 100,420 1,180 0.001 0.33
Family Health Options of Kenya
13,350 160 0.09 5,840 70 0.04 -63% 19,190 230 NS 0.06
Marie Stopes Kenya 32,800 390 0.23 29,000 340 0.17 -25% 61,800 730 NS 0.20
Population Services
International
37,160 440 0.26 28,790 340 0.17 -34% 65,950 780 0.037 0.21
FBO 4,420 50 0.03 0.00 0.00 0.00 -100% 4,420 50 NS 0.01
Totale 141,160 1,660 1.00 166.64 1,960 1.00 307,800 3,620 1.00
NS, not significant or p>0.05
a: Financial year in Kenya runs from July 1 to June 30. b: Exchange rate used in each year is US$ 1 = KSh 85.
c: At the time of the study, the Ministry of Health was separated from the Ministry of Public Health and Ministry of Medical Services. d: A zero implies that the organization type did not secure funding for family planning that financial year.
financing agents decreased, while expenditures on
commodities, training, outreach, and
pharmaceutical supplies increased. This shift may have occurred due to greater efficiencies gained and a gradual shift toward providing FP commodities and services to clients. This raises questions for future study, whether devolution affects the types of costs in the short and long run.
This assessment provides a baseline for tracking FP funds at the county level. This study joins other studies arguing for more local-level information about FP7 to add to estimates of RH financing at the national level29 and for more comprehensive budget analysis for FP30. The participatory approach facilitated the acceptance of the findings and increased the likelihood that recommendations will be adopted. The findings can be used in other local counties, other countries with similar settings experiencing devolution, and in other areas of health. For example, county budgeting managers in Kenya, who are responsible for deciding how much to spend on different health sectors, could use information on the funds allocated in the counties of this study and the population size to estimate funds for FP. This study, which followed an approach previously used in HIV23, has demonstrated the potential benefits of using this kind of assessment on a regular basis in RH, and including FP as its own line item. When accurately performed, this approach will estimate the cost of interventions and highlight the gaps in contributions pledged for FP and funds actually disbursed. The use of a costing estimate tool to show unbalanced allocation of funding could also help identify priority areas or interventions in need of additional resources.
In the future, the data tools used can be employed annually to track expenditures on FP and other services at national and local levels. These tools should be designed to ensure a feasible breakdown of RH expenditures, including FP, and if possible, to capture data starting from the health facility level12. The findings of this study will support efforts to advocate for more resources and improved tracking, and to estimate the financial gap for FP services to inform resource mobilization and allocation. Yearly funding allocations to FP would lessen uncertainty for facility in-charges
who are trying to meet population demand for FP services31.
Strengths and Limitations
This assessment is a baseline for tracking FP funds at the county level in Kenya, and a review of the literature indicates that this is one of the first studies to do so. Strengths of the assessment include the fact that it was conducted at the county level when devolution was taking effect in Kenya, and it used a participatory approach to ensure engagement in, and ownership by, the county government officials who are the anticipated end users. The assessment methods can be used in other counties in Kenya, or in other countries with similar settings and devolution. This approach to estimating sources and amounts of funding for FP can be applied to other areas of health, as well. The study had several limitations. The funding level for health facility staff salaries remained the same over the two years because time series data on personnel were based on cross-sectional data collected for the two years, and did not factor in annual salary increments. The source documents did not include all FP funds that came from national level. Government spending was only captured for FP methods and commodities expenditures and for employees‘ salaries designated for ―reproductive health.‖ Additional government contributions not captured include infrastructure (buildings, administration of buildings) and staff time for supervision of health care; thus, the government‘s financial commitment to FP is underestimated. Clients‘ out-of-pocket expenditure for FP commodities was beyond the scope of this study, but future studies should include this component, which has been examined at the national level29.
Conclusions
expenditure information on which to base future informed budget allocation decisions.
FP funding and expenditure analysis studies should be done routinely and institutionalized, as part of county activities. The government‘s indirect contributions to FP funding and expenditure should be included in the future, as well as client expenditure.
Acknowledgments
The authors acknowledge the following reviewers: Alan Johnston, Tupange consultant; Paul Kuria, Gender and Equity Commission of Kenya; and Paul Nyachae, Jhpiego. Special thanks to Edward Kenyi, Elizabeth Thompson, Dana Lewison, and Joan Taylor, Jhpiego, for editing the manuscript. We appreciate contributions by Kisumu and Kakamega County Government; Allan Gohole, Jhpiego; Gathari Ndirangu, Jhpiego; Peter Kagwe, Jhpiego; Feddis Mumba, Jhpiego; and Isaac Malonza, Jhpiego.
Funding
This work was supported by the Bill & Melinda Gates Foundation, Advocacy Support Project: Building Commitment among Municipal Leaders for Family Planning/Reproductive Health Programs for the Urban Poor, Futures Institute, Grant number OPP51727, and by the Bill & Melinda Gates Foundation, Tupange—Kenya Urban Reproductive Health Initiative, Jhpiego, Grant number OPP1005919.
Conflict of Interest
None of the authors have competing interests to declare.
References
1.
Ahmed S, Li Q, Liu L and Tsui AO. Maternal deaths averted by contraceptive use: an analysis of 172 countries. Lancet 2012; 380(9837): 111–25. 2. ClelandJ,Bernstein S, Ezeh A, Faundes A, Glasier A
and Innis J. Family planning: the unfinished agenda. Lancet2006; 368(9549): 1810–27.
Ministry of Health, 2012.
4. Kenya National Bureau of Statistics, Ministry of Health, National AIDS Control Council, Kenya Medical Research Institute, National Council for Population and Development, The DHS Program, ICF International. Kenya Demographic and Health Survey 2014. Nairobi, Kenya, and Rockville, Maryland, USA, 2015 [cited 2016 May 16].
Available from:
http://dhsprogram.com/pubs/pdf/FR308/FR308.pdf. 5. World Health Organization (WHO). Sexual and
reproductive health packages of interventions for family planning, safe abortion care, maternal, newborn and child health. Geneva: WHO, 2010
[cited 2012 Aug 18]. Available from:
http://whqlibdoc.who.int/hq/2010/WHO_FCH_10.0 6_eng.pdf.
6. Cleland J, Conde-Agudelo A, Peterson H, Ross J and Tsui A. Contraception and health. Lancet 2012; 380(9837): 149–56.
7. Osotimehin B. Family planning saves lives, yet investments falter. Lancet 2012;380(9837):82–3. 8. Kenya National Bureau of Statistics (KNBS). Kenya
population and housing census. Nairobi, Kenya: KNBS, 2009.
9. Alkenbrack S, Chaitkin M, Zeng W, Couture T and Sharma S. Did equity of reproductive and maternal health service coverage increase during the MDG era? An analysis of trends and determinants across 74 low- and middle-income countries. PLoS One
2015; 10(9): e0134905.
doi:10.1371/journal.pone.0134905.
10. Muthamia M, Owino K, Nyachae P, Kilonzo M, Kamau M, Otai J, Kabue M and Keyonzo N. The Tupange Project in Kenya: A Multifaceted Approach to
Increasing Use of Long-Acting Reversible
Contraceptives. Glob Health Sci Pract. 2016 Aug 18; 4 Suppl 2: S44-59. doi: 10.9745/GHSP-D-15-00306. Print 2016 Aug 11.
11. Keyonzo N, Nyachae P, Kagwe P, Kilonzo M, Mumba F, Owino K, Kichamu G, Kigen B, Fajans P, Ghiron L and Simmons R. From Project to Program: Tupange's Experience with Scaling Up Family Planning Interventions in Urban Kenya. Reprod Health Matters. 2015 May; 23(45): 103-13. doi:10.1016/j.rhm.2015.06.010. Epub 2015 Jul 26. 12. Sidze EM, Pradhan J, Beekink E, Maina TM and Maina
BW. Reproductive health financing in Kenya: an analysis of national commitments, donor assistance, and the resources tracking process. Reprod Health Matters 2013; 21(42): 139–50. doi: 10.1016/S0968-8080(13)42738-6.
14. Barnes J, O‘Hanlon B, Feeley F, McKeon K, Gitonga N
and Decker C. Private health sector
assessment in Kenya. World Bank
Working Paper No. 193. Washington, DC: World Bank, 2010 [cited 2016 May 16].
Available from:
http://pdf.usaid.gov/pdf_docs/PNADS739.pdf. 15. Pradhan J, Sidze EM, Khanna A and Beekink E.
Mapping of reproductive health financing:
methodological challenges. Sex Reprod Healthc 2014; 5(3): 90–8.
16. Sidze EM, Beekink E and Maina BW. Challenges associated with tracking resources allocation for
reproductive health in sub-Saharan African
countries: the UNFPA/NIDI resource flows project experience. Reprod Health 2015; 12: 39. doi 10.1186/s12978-015-0033-8.
17. Worley H. Family Planning Champions in Kenya Celebrate Success in Counties. Washington, DC: Population Reference Bureau, 2016. [cited 2016
May 5]. Available from
http://www.prb.org/Publications/Articles/2015/keny a-county-advocacy.aspx.
18. The Constitution of Kenya. Revised edition 2010. Nairobi, Kenya: National Council for Law Reporting, 2010 [cited 2016 January 13]. Available from:
http://www.kenyaembassy.com/pdfs/the%20constitu tion%20of%20kenya.pdf.
19. Ministry of Medical Services (MMS) and Ministry of Public Health and Sanitation (MPHS). Kenya national health accounts 2009/10. Nairobi, Kenya: MMS and MPHS, 2010 [cited 2016 May 16].
Available
from:https://www.hfgproject.org/wp- content/uploads/2015/02/Kenya-National-Health-Accounts-2009_10.pdf.
20. Netherlands Interdisciplinary Demographic Institute (NIDI) and African Population and Health Research Center (APHRC). Reproductive health and family planning financing in Kenya: a mapping of the resource flows. Nairobi, Kenya: APHRC, 2012
[cited 2016 May 17]. Available from:
http://aphrc.org/wp- content/uploads/2013/12/Reproductive-health-and- family-planning-financing-in-Kenya.-A-mapping-of-the-resource-flows.pdf.
21. Office for Human Research Protections and U.S. \Department of Health and Human Services (HHS). Code of Federal Regulations, Title 45, Public Welfare. Department of Health and Human Services, Part 46, Protection of Human Subjects. Washington, DC: HHS, 2009 [cited 2016 May 17]. Available from:
http://www.hhs.gov/ohrp/sites/default/files/ohrp/poli cy/ohrpregulations.pdf.
22. eHealth-Kenya. Kenya master health facility list.
Nairobi, Kenya: Ministry of Health, 2011 [cited
2012 February 23]. Available from:
http://kmhfl.health.go.ke/#/home.
23. National AIDS Control Council (NACC). Kenya national AIDS spending assessment report for the financial years 2006/07 and 2007/08. Nairobi, Kenya: NACC, 2009 [cited 2016 May 5]. Available from:
http://www.unaids.org/sites/default/files/en/media/u naids/contentassets/documents/countryreport/2009/n asa_kenya_2007-2008_en.pdf.
24. Ministry of Health. Ministry of Health Summary Report 711 (MOH 711). In: Republic of Kenya: Health sector indicator and standard operating procedure manual for health workers. Nairobi, Kenya: Ministry of Health, 2008 [cited 2016 January 13]. Available from:
https://healthresearchweb.org/?action=download&fil e=indicatorandSOPManual2008131008..pdf 25. Ministry of Health. Ministry of Health Summary Report
717 (MOH 717) In: Republic of Kenya: Health sector indicator and standard operating procedure manual for health workers. Nairobi, Kenya: Ministry of Health, 2008 [cited 2016 January 13]. Available from:
https://healthresearchweb.org/?action=download&fil e=indicatorandSOPManual2008131008..pdf 26. Ministry of Public Health and Sanitation (MPHS). SDP
contraceptives consumption data report and request form. Nairobi, Kenya: MPHS, 2011 [cited 2016
January 13]. Available from:
http://fptoolkit.or.ke/download/commodity_security/ _improving_family_planning_commodity_security/ CDRR.pdf.
27. Kenya Health Information System (KHIS). District Health Information Software 2 (DHIS2). Nairobi, Kenya: KHIS [cited 2016 January 13]. Available from: https://hiskenya.org.
28. StataCorp. Stata Statistical Software: Release 12. College Station, Texas: StataCorp LP, 2011. 29. Nguyen H, Snider J, Ravishankar N and Magvanjav O.
Assessing public and private sector contributions in reproductive health financing and utilization for six sub-Saharan African countries. Reprod Health Matters 2011; 19(37): 62–74.
30. Ngethe PN. Family planning in Kenya: a review of national and district policies and budgets. DSW (Deutsche Stiftung Weltbevoelkerung): Nairobi, Kenya, 2014 [cited 2016 March]. Available from: http://www.dsw.org/uploads/tx_aedswpublication/fa mily-planning-kenya_update.pdf.