(online) = ISSN 2285 – 3642 ISSN-L = 2285 – 3642
Journal of Economic Development, Environment and People Volume 3, Issue 4, 2014
URL: http://jedep.spiruharet.ro e-mail: office_jedep@spiruharet.ro
Expansion for Who, Markets or The Poor?
Sedat KUSGOZOGLU
1, M. Sakir Başaran
2, Selcuk KENDIRLI
31
Turkish Court of Accounts, Ankara, 06520, Turkey 2
Turkish Court of Accounts, Ankara, 06520, Turkey 3
Hitit University FEAS Banking and Finance, Akkent 3. Cadde No:3, Corum,19100 , Turkey
Abstract. In this study we examine the impacts of expansionary monetary policies executed by the Federal Reserve on poverty in the United States of America. It has been discussed in various studies that the Fed’s expansionary monetary policies create a less positive impact on economy as a whole than financial sector. In this study, the expansionary effects of expansionary policies on the poor living in America will be discussed. The main thesis of the study is that the poor living in the United States benefited less from expansionary monetary policies than either financial sector or the US economy as a whole. When discussing the thesis of the study both employed and unemployed poor will be discussed. Therefore, it will be questioned that the decrease in the unemployment rate is the indicator of the fight against poverty. Indicators such as indices and interest rates in the financial markets, and indicators such as growth rates and unemployment rates in the overall economy are regarded as essential indicators but as for poverty it’s hard to find such regarded indicators. Unfortunately, there are not too many statistics about the poor living in the United States in the reports of the international organizations. Thus the main trouble of the study is that international comparisons are almost impossible. Therefore, various indicators produced by the U.S. government agencies of various indicators will be used in this study.
Keywords:
Quantitative Easing, Federal Reserve, Poverty, The PoorJEL classification: E58, I32
1
Turkish Court of Account, İnönü Bulvari (Eskisehir Yolu) No:45 Balgat/Çankaya/Ankara, 06520, Turkey, Tel: +90 (312) 295 30 00, Fax: + 90 (312) 295 40 94, Email: selcukkendirli@hitit.edu.tr
2
Turkish Court of Account, İnönü Bulvari (Eskisehir Yolu) No:45 Balgat/Çankaya/Ankara, 06520, Turkey, Tel: +90 (312) 295 30 00, Fax: + 90 (312) 295 40 94, Email: selcukkendirli@hitit.edu.tr
3 Hitit University FEAS Banking and Finance, Akkent 3. Cadde No:3, Corum,19100 , Turkey
(online) = ISSN 2285 – 3642 ISSN-L = 2285 – 3642
Journal of Economic Development, Environment and People Volume 3, Issue 4, 2014
URL: http://jedep.spiruharet.ro e-mail: office_jedep@spiruharet.ro
1.
Quantitative Easing Policy
Many measures were taken after the subprime mortgage crisis which starts in late 2007 in United States of America (USA) and still has effects present day. These measures can be roughly classified as follows;
Tax incentives, Bailouts,
Bond purchases, Interest rate cuts, Other measures.
The scope of study is limited with quantitative easing (QE) which is classified under bond purchases.
Quantitative easing is a non-traditional policy which include large-scale asset purchases of, for example, mortgage-backed securities and Treasury securities4.
The main objective in implementing the policy of quantitative easing is raising the prices of assets through purchasing assets from banks. Bond purchases which operated under QE lead to increase the price of bonds and decrease interest rates. Lower interest rates makes investors direct their funds from low yielding bonds to stock markets in expectation of higher returns. As a result, thanks to rising asset prices, asset owners will have a portfolio which is more valuable and more liquid. If they feel wealthier and have more money immediately available, then they are likely to increase their spending which boosts the economy directly, or else to take on more risk by increasing their lending to consumers and businesses5. Fed explains the effecting process of QE on economy as “when the Fed makes such purchases, the demand for those assets and their prices increase, driving down interest rates. As interest rates fall, the cost to businesses for financing capital investments, such as new equipment, decreases. Over time, new business investment should bolster economic activity, create new jobs, and reduce the unemployment rate6”.
The first round of QE began in March 2009 and concluded in March 2010. Fed purchased $1.25 trillion in mortgage-backed securities and $200 billion in federal agency debt (i.e., debt issued by Fannie Mae, Freddie Mac, and Ginnie Mae to fund the purchase of mortgage loans). To help lower interest rates in
4
Quantitative Easing Explained, http://research.stlouisfed.org/pageone-economics/uploads/newsletter/2011/201104.pdf
5
Bank of England, Target 2.0,
http://www.bankofengland.co.uk/education/Documents/targettwopointzero/t2p0_qe_supplement.pdf, page 1.
6
(online) = ISSN 2285 – 3642 ISSN-L = 2285 – 3642
Journal of Economic Development, Environment and People Volume 3, Issue 4, 2014
URL: http://jedep.spiruharet.ro e-mail: office_jedep@spiruharet.ro
general (and thaw the frozen private credit market), the Fed also purchased $300 billion in long-term Treasury securities7.
The second round of QE, widely called QE2, began in November 2010 and is scheduled to conclude by the end of the second quarter of 2011. QE2 works toward both of these objectives by fostering economic growth through lower interest rates intended to spur consumer spending andbusiness investment. During QE2, the Fed will purchase up to $600 billion in long-term Treasury securities8.
The third round of QE, widely called QE3, began in September 2012. Federal Open Market Committee (FOMC) will continue purchasing additional agency mortgage-backed securities at a pace of $40 billion per month9. At the following meeting amount of the bond purchases increased to $85 billion per month. FOMC announced that decision as “The Committee also will purchase longer-term Treasury securities after its program to extend the average maturity of its holdings of Treasury securities is completed at the end of the year, initially at a pace of $45 billion per month10”.This decision applied to a period longer than one year and then at the FOMC meeting in December 2013 it was decided two separate kind of bond purchases to reduce both $5 billion per month11. Amount of purchased bond has reduced at following meetings.
2.
Effects of the QE on the overall economy
The expected impact of raising effect on asset prices of the QE on the overall economy is, as mentioned earlier, achieve economic growth by the increase in investments.While there are several methods of measuring this effect, we will use unemployment and GDP as indicator as they are also accepted by Fed. Along with these two indicators, gross domestic investment statistics are taken into account in order to test the step of transforming raising asset prices to investment which is the most important step in achieving the objectives of QE.
7
Quantitative Easing Explained, April 2011, http://research.stlouisfed.org/pageone-economics/uploads/newsletter/2011/201104_ClassroomEdition.pdf, page 2.
8
Quantitative Easing Explained, April 2011, http://research.stlouisfed.org/pageone-economics/uploads/newsletter/2011/201104_ClassroomEdition.pdf, page 2.
9
http://www.federalreserve.gov/newsevents/press/monetary/20121024a.htm
10http://www.federalreserve.gov/newsevents/press/monetary/20121212a.htm
(online) = ISSN 2285 – 3642 ISSN-L = 2285 – 3642
Journal of Economic Development, Environment and People Volume 3, Issue 4, 2014
URL: http://jedep.spiruharet.ro e-mail: office_jedep@spiruharet.ro
Fig. 1: Gross Domestic Product
As can be seen from the GDP figures, QE policy has reached its objective of overall economic growth.
Fig. 2: Civilian Unemployment Rate
(online) = ISSN 2285 – 3642 ISSN-L = 2285 – 3642
Journal of Economic Development, Environment and People Volume 3, Issue 4, 2014
URL: http://jedep.spiruharet.ro e-mail: office_jedep@spiruharet.ro
Fig. 3: Gross Domestic Investment
The theoretical background of the EQ, increase in asset prices to encourage investment proposition in terms of gross domestic investment, also has been shown to reach the goal. Bottomed in the third quarter of 2009, gross domestic investment has increased steadily since then.
3.
Effects of the QE on financial markets
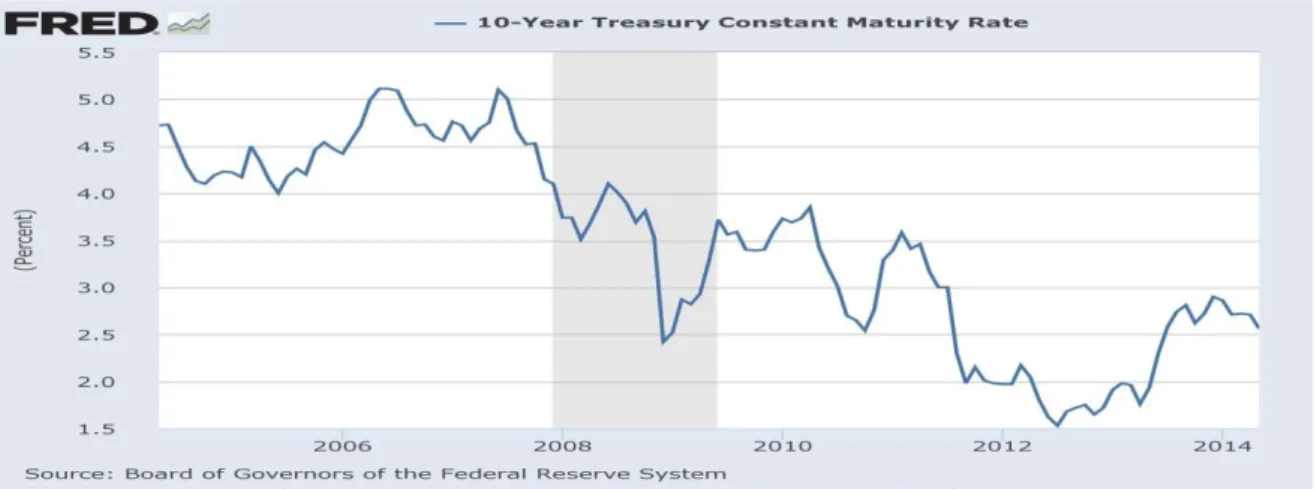
As mentioned earlier, central banks aim at boosting investments in the economy through raising the price of assets. It is clear that QE passes through various channels to reach this goal. The initial effect of the Fed’s bond purchasing is falling interest rates through raising price of bonds. To measure the fall of the interest rates 10-year U.S. Treasury bond prices will be accepted as indicator. As mentioned earlier, the rise in price of bonds means a fall in interest rates. As can be seen in the graph below, although, it is not possible to mention about the 10- year U.S. Treasury bond rate has steady movement, from 2009 when QE started to be implemented to the beginning of 2014 it seems to fall.
(online) = ISSN 2285 – 3642 ISSN-L = 2285 – 3642
Journal of Economic Development, Environment and People Volume 3, Issue 4, 2014
URL: http://jedep.spiruharet.ro e-mail: office_jedep@spiruharet.ro
The impact of the decline in interest rates naturally causes increase prices of assets other than bonds too. In the scope of study we will accept S&P 500 index as a sample of financial markets because of its inclusiveness on global economy and its role as a international indicator of economic activity.
As can be seen from the chart given below, after each QE policy application a remarkable rise in the S & P 500 index was observed. If observed at the long term, thanks to QE policy, S&P 500 successively rises to historic levels.
Fig. 5: S&P 500
Experiencing the lowest point of GDP in the second quarter of 2009 when it was $14,342 billion rose to $17,016 billion in the first quarter of 2014, an increase of 18% has been realized. From the perspective of the S & P 500 index value of 915.5 in the same period to 1864, an increase of 103% points, performing much higher than the overall economy.
4.
Effects of the QE on the poor
From the perspective of financial markets and the general economy, it can be seen that QE reached its goal. However, the main question of the study is that how much of the effect of QE really was reflected to the poor. In this final section of the study will seek to answer this question.
The impact of the QE on poverty is not possible to measure with a single indicator. Therefore, these impacts will be discussed by using different indicators.
(online) = ISSN 2285 – 3642 ISSN-L = 2285 – 3642
Journal of Economic Development, Environment and People Volume 3, Issue 4, 2014
URL: http://jedep.spiruharet.ro e-mail: office_jedep@spiruharet.ro
Fig. 6: Income Gini Ratio for Households by Race of Householder, All Races
Another indicator relevant to poverty is food insecurity rate. In the figure below, food insecurity, very low food insecurity rates and also unemployment rate has shown. As a natural consequence of downturn, increase in the food insecurity and very low food insecurity rates was expected. Despite QE and other measures taken in the years following the crisis, in food insecurity rate and particularly in the very low rate of food insecurity, a significant decrease was not observed. Another important aspect shown on the chart, fall in the unemployment rate fail to have a significant effect on food insecurity and very low food insecurity rate.
(online) = ISSN 2285 – 3642 ISSN-L = 2285 – 3642
Journal of Economic Development, Environment and People Volume 3, Issue 4, 2014
URL: http://jedep.spiruharet.ro e-mail: office_jedep@spiruharet.ro
Another important indicator on poverty is the number of participants in Supplemental Nutrition Assistance Program. As seen in the chart below, in the years following the beginning of the crisis, the number of people benefiting from the program bounces dramatically. It is noteworthy that in the years following the crisis the number of participants in program did not decline; in fact it has continued to increase in 2013.
Fig. 8: SNAP Average Participation
Percentage of people below the poverty rate is the most important indicator for the study. As can be seen in the chart below, the rate bounced in 2008 and never has a significant decline after that year.
Fig. 9: Percentage of People in Poverty 0 10.000 20.000 30.000 40.000 50.000 60.000
2001 2002 2003 2004 2005 2006 2007 2008 2009 2010 2011 2012 2013
Th o u san d s
SNAP Average Participation
Source: http://www.fns.usda.gov/sites/default/files/pd/SNAPsummary.pdf
10 11 12 13 14 15 16
2001 2002 2003 2004 2005 2006 2007 2008 2009 2010 2011 2012
% o f To tal Pop u lation
Percentage of People in Poverty
(online) = ISSN 2285 – 3642 ISSN-L = 2285 – 3642
Journal of Economic Development, Environment and People Volume 3, Issue 4, 2014
URL: http://jedep.spiruharet.ro e-mail: office_jedep@spiruharet.ro
As can be understood from those described heretofore, QE policy has a significant impact on stock markets and a less significant impact on the overall economy. From the point of the poor, one cannot say QE has favour consequences. As there is not seen any improvement in povertyindicators from the year the QE policy started in 2009 until 2013, in contrast there is an undeniable deterioration in poverty indicators since 2009.
Although all these positive improvements experienced in the overall economy and stock markets, the poor could not benefit from these improvements. Reasons can be described as followings.
It is clear that the most benefited sector from QE policy is that the stock markets. And stock owners are the ones that have the higher savings rate, the rich. So ıf stock prices increase, it simply causes the rich get richer. The poor who has low rate of savings are unable to benefit from the stock market rally. The increase in the gini coefficient confirms that suggestion.
As noted in the charts mentioned above, the decline in the unemployment rate did not cause a significant decrease in the poverty rate. This can be explained with between the third quarter of 2009 and first quarter of 2014 employment cost index increased %7,812, but in the same period consumer price index increased %9,313. While asset prices increases, price of labour increase less than other assets. And that causes increase in the number of the poor in the working class.
It is actually requirement of the definition of the QE policy not to benefit the poor. As mentioned before, QE has effects first on the banks, then on companies and finally on working class. It is an expected result that the banks will use this low cost resource to make their balance sheets less risky. In various statements made by Fed, this result is counted as one of the purposes of the QE policy. The next stage after banks is companies where QE funds should have converted into investments. However, in real life companies transferred the funds that came from banks to developing country bonds and stock markets which provide higher return with less risk. This suggestion confirmed with developing country stock and foreign exchange markets collapses after the Fed’s decision to end both former QE policies and the decision to reduce current QE3 policy’s monthly bond purchase amount.
Therefore, it can be said that only a limited part of the resources created by the Federal Reserve turn into investment. However, as mentioned earlier, new investments and the decrease in the unemployment rate could not be effective in reducing poverty.
As a result, QE policy has tremendous effects on stock markets. However, it can be observed that QE policy has less positive effects on the overall economy and almost no positive effect on poverty. The point to note is that these results did not occur in practice, they are designed in this way from the beginning.
References
[1] Areuea Journal .(1978), Areuea Journal,Journal of the American Real Estate &Urban Economics. Available at http://web.a.ebscohost.com/ehost/pdfviewer
[2] AKYEL R. (2013); The President of Turkish Court of Accounts ,p.41.
12 http://research.stlouisfed.org/fred2/series/ECIWAG
(online) = ISSN 2285 – 3642 ISSN-L = 2285 – 3642
Journal of Economic Development, Environment and People Volume 3, Issue 4, 2014
URL: http://jedep.spiruharet.ro e-mail: office_jedep@spiruharet.ro
[3] Dutta M . (2003) New Economic Dimensions in Economic Thought: The Case of Environmental Economics, Journal of the Alumni Association of the Economics Department Calcutta University, pp.95–109.
[4] http://bbs.bartin.edu.tr/dosyalar/DersMateryal/44866u2ve3k%C4%B1tl%C4%B1kka nunualternmalyt.pdf [5] http://journal.dogus.edu.tr/ojs/index.php/duj/article/view/175/191
[6] http://nation.foxnews.com/2014/01/28/al-gore-suggests-fertility-management-fight-global-warming [7] http://tr.wikipedia.org/wiki/K%C3%BCresel_%C4%B1s%C4%B1nma
[8] http://www.bilgiustam.com/surdurulebilir-kalkinma-nedir
[9] http://www.nedirnedemek.com/%C3%A7evre-ekonomisi-nedir-%C3%A7evre-ekonomisi-ne-demek [10] http://www.ntvmsnbc.com/id/25436041; İsveç’in çöpü bitti
[11] http://www.sayistay.gov.tr/yayin/yayinicerik/145.k1Cevsemtr.pdf
[12] Mulder P.; Jeroen C.J.M.; Bergh V. D. (2001), Evolutionary Economic Theories of Sustainable Development, Blackwell Publishers.
[13] ÖZDEK, Y. E. (1993) İnsan Hakkı Olarak Çevre Hakkı, TODAIE Yayınları. [14] Press Release. (2000) “Sierra Club Endorses Gore”.
[15] Stavins; R. N. (2000) A Draft- A Two-Way Street between Environmental Economics and Public Policy, Edward Elgar Publishing Inc.
[16] Yıldırım U.; Marin M. C. (2004) Çevre Sorunlarına Çağdaş Yaklaşımlar, Beta Yayınları.