ABSTRACT
Barium sulfate (barite) is one of the widely used weighting materials in the preparation of drilling fluid for deep oil and gas wells. Barite is not soluble in the regular solvents; such as, hydrochloric acid (HCl) and other acids. Therefore, in this study, we focused on evaluating the dissolution of the industrial barite particles in different chelating agents. Chelating agents; such as, diethylene triamine penta acetic (DTPA), ethylene diamine tetra acetic (EDTA), and hydroxyethyl ethylene diamine tri acetic (HEDTA) acids with high and low pH values were used in this study. The effect of the base of chelating agents, namely alkali and alkali earth hydroxides, on the dissolution of barite was also investigated. For the first time, the optimum pH, concentration, and base (sodium or potassium) of chelating agents which yielded the maximum dissolution were investigated in this study at a high temperature. Previous studies did not consider the wellbore constraints during their experiments and they used chelating agent volume to barite weight ratio, which could not be implemented in the real wells. In this study and for the first time, we considered the wellbore volume (chelating agent volume that can be used) and the barite weight (filter cake) during the dissolution experiments. Based on the results obtained from this study, potassium base DTPA-K5 and EDTA-K4 of a concentration of 20 wt.% were found to be the most effective chelating agents to dissolve barite. The solubility of barite was found to be 26.8 g/L in a solution containing 20 wt.% of DTPA-K5 and 25.6 g/L in a solution containing 20 wt.% of EDTA-K4 during a soaking time of 24 hrs and a pH value above 11 at 200°F.
Keywords: Barium Sulfate (Barite) Solubility, Barite Solubility, Chelating Agents, DTPA, EDTA
Badr Salem Bageri*, Mohamed A. Mahmoud, Reyad A. Shawabkeh, and Abdulazeez Abdulraheem King Fahd University of Petroleum & Minerals, Dhahran, 31261, Kingdom of Saudi Arabia
Evaluation of Barium Sulfate (Barite) Solubility Using Different Chelating
Agents at a High Temperature
*Corresponding author Badr Salem Bageri
Email: [email protected] Tel: +96 61 38601324
Fax:+96 61 38604234
Article history
Received: September 05, 2015
Received in revised form: December 21, 2015 Accepted: January 12, 2016
Available online: February 20, 2017
INTRODUCTION
Barium sulfate (barite) is one of the common weighting materials used in drilling fluid for deep oil and gas wells. It is mostly preferred over other weighting materials; such as, iron oxides, calcium carbonate, and others due to its high density which provides adequate weight at a low cost [1].
The low solubility of barium sulfate in water (2.3 mg/L) leads to the formation of barium sulfate scale in oil and gas wells [3]. On the other hand, contacting the high sulfate seawater with barium in the underground formations is another source of barite scale precipitation [4,5].
The solubility of barite in chelating agents has been investigated, but the optimum conditions for dissolution have not completely been addressed. Lakatos et al. [6,7] compared seven different barite dissolvers. Their work provided with the determination of the dissolution capacity of each solvent. The following chelating agents were used in their study; Diethylene triamine penta acetic acid (DTPA), ethylene diamine tetra acetic acid (EDTA), hydroxyethyl ethylene diamine tri acetic acid (HEDTA), dioxaocta methylene dinitrilo tetra acetic acid (DOCTA), nitrile tri acetic (NTA), (DCTA), and tri ethylene tetra amine hexa acetic acid (TTHA). They conducted the experiments at 25°C which does not simulate the downhole conditions in oil and gas wells. Their results showed that the barite particles solubility in the DTPA was about (8 g/L) in a solution containing a DTPA concentration of 0.1 mol/L. The chelating agents were prepared by the sodium base (NaOH) in Lakatos’ study [7]. Another study was conducted by Putnis et al. [8,9] to investigate the dissolution rate of barite in DTPA at different concentrations and temperatures. The DTPA in their study was prepared by a potassium base (KOH). The solubility test in their study was carried out using barite with a particle size ranged from 104 to 150 μm and the DTPA solution with a concentration ranged from 0.001 M to 0.5 M. The particle size of the barite they used is completely different than the one used in oil and gas well drilling fluid. In this study, we used industrial grade
barite that is typically used in drilling fluids for deep oil and gas wells.
The results obtained by Putnis et al. [8] indicated that the lower concentration of DTPA resulted in a good dissolution rate at a low temperature, where the solubility of barite was found to be 1.17 g/L (650 ppm of Ba) in a 0.05 M DTPA solution during 19 hours at 22°C. Increasing the temperature to 80°C showed that a 0.5 M solution of DTPA gave better results, where 5280 ppm of barite dissolved in 0.5 M DTPA, while 4936 ppm dissolved in a 0.05 M solution. Two barite dissolvers were evaluated using DTPA or ETDA as the main solvents to dissolve the barite scale by Nasr-El-Din et al. [10]. The solubility test was conducted to test the two formulations and the results showed that the EDTA and DTPA yielded a barite solubility of 23.7 g/L Although the results of the two formulations were effective, the composition was not disclosed.
agents using Fourier Transformation Infra-Red (FTIR) and scanning electron microscopy (SEM). The results of this work will help formulate a treating formulation for cleaning the barite scale from surface and subsurface facilities and cleaning the wellbore after drilling operations of deep oil and gas wells drilled using barite-based mud.
EXPERIMENTAL PROSEDURES
Materials
Industrial grade barite (barium sulfate) was used to carry out the experimental work of this study. The barite particles were sieved using a 75 micron mesh size to insure that the same particle size range of barite (less than 75 micron) is used in all the experimental studies. Eight chelating agents were used in this study; Diethylene triamine penta acetic acid (DTPA) potassium salt and sodium salt base, ethylene diamine
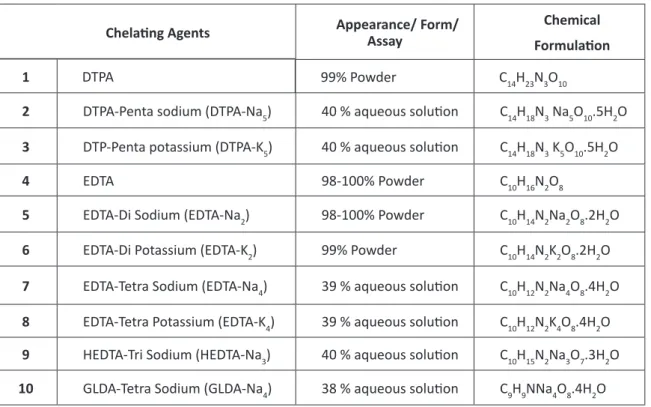
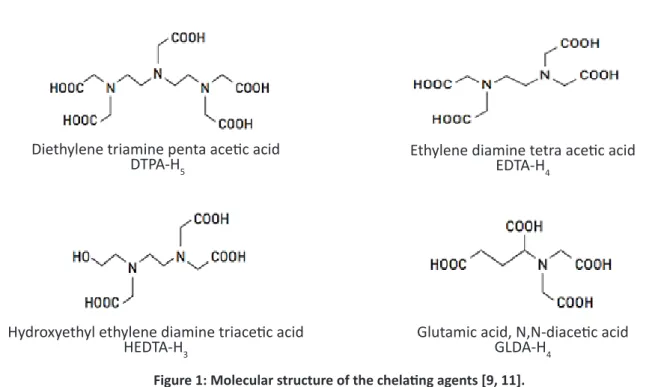
tetra acetic acid (EDTA) potassium salt and sodium salt base, hydroxyethyl ethylene diamine triacetic acid (HEDTA) sodium salt and glutamic diacetic acid (GLDA) sodium salt (GLDA). Table 1 lists the details of the chelating agents used in this study. The schematic diagrams of the chelating agent molecular structures of DTPA, EDTA, HEDTA, and GLDA are shown in Figure 1. The molecular structure shows that each chelating agent has a certain number of carboxylate functional groups (ligands) which bind to metal center having different numbers of nitrogen atoms [8,11]. For example, DTPA has five ligands linked with three nitrogen atoms in the center. At a high pH, the ligand forms strong 1:1 chelates in solution [11]. Based on that, the ligand can be either Na or K based on the used base to prepare the solution; in our study, NaOH and KOH were used to prepare the solutions.
Table 1 : Chelating agents used in this study.
Chelating Agents Appearance/ Form/ Assay Chemical
Formulation
1 DTPA 99% Powder C14H23N3O10
2 DTPA-Penta sodium (DTPA-Na5) 40 % aqueous solution C14H18N3 Na5O10.5H2O
3 DTP-Penta potassium (DTPA-K5) 40 % aqueous solution C14H18N3 K5O10.5H2O
4 EDTA 98-100% Powder C10H16N2O8
5 EDTA-Di Sodium (EDTA-Na2) 98-100% Powder C10H14N2Na2O8.2H2O
6 EDTA-Di Potassium (EDTA-K2) 99% Powder C10H14N2K2O8.2H2O
7 EDTA-Tetra Sodium (EDTA-Na4) 39 % aqueous solution C10H12N2Na4O8.4H2O
8 EDTA-Tetra Potassium (EDTA-K4) 39 % aqueous solution C10H12N2K4O8.4H2O
9 HEDTA-Tri Sodium (HEDTA-Na3) 40 % aqueous solution C10H15N2Na3O7.3H2O
Ethylene diamine tetra acetic acid
EDTA-H4
Diethylene triamine penta acetic acid
DTPA-H5
Hydroxyethyl ethylene diamine triacetic acid
HEDTA-H3 Glutamic acid, N,N-diacetic acidGLDA-H4
Figure 1: Molecular structure of the chelating agents [9, 11].
The structure of the DTPA-K5/ Na5 (and similarly the others) is the same as DTPA with replacing H5 with K5.
Experimental Work
The solubility experiments were carried out using 4 g of barite in 100 ml of solvent. This ratio was obtained based on the ratio of barite solids weight to solvent volume as given in Equation 1. For a barite filter cake or scale formed around the wall of the well, the ratio of barite solids to the solvent is limited by the thickness of the formed cake and the diameter of the wellbore as well as the porosity of the filter cake [12].
( ) ( )
( )
2 2
2
2 1 2
h h f fc
R
h f
d d th c
W
d th
ρ ∅
− − × −
=
−
(1)
where, dh (cm) is the diameter of the open hole section; Thf (cm)is the thickness of the filter cake;
ρfc (g/cc) stands for the density of filter cake solids, and ϕc (fraction) represents the porosity of the filter cake.
Although the filter cake formed downhole should be very thin to avoid pipe sticking, using a ratio of
4 g/100 ml covers even the worst case of filter cake thickness that reached 1.5 mm [13] for open hole section with a hole size of 8 inches and above (Figure 2).
Figure 2: Recommended solid-to-liquid ratio based on filter cake thickness and hole size.
a) Mixing 4 g of the industrial barite with 100 ml of a chelating agent (1), for example DTPA-Na. The concentration of the chelating agents ranged between 10 wt.% to 40 wt.%. The experiments were carried out at 95°C (200°F) in a constant time (24 hrs) and at high pH values ranged from 11 to 12.
b) Repeating step (a) using different chelating agents (DTPA-Na5, DTPA-K5), (EDTA-Na2, EDTA-Na4,
EDTA-K2, EDTA-K4), (GLDA-Na4), and (HEDTA-Na3) at different concentrations.
c) The dissolution rate of barite in the optimal type and at the optimal concentration of chelating agents (obtained from steps a and b) was studied as a function of time and pH. The pH was varied by preparing the powder chelating agent at different concentrations of NaOH and KOH solutions. d) The weight of the barite at the beginning and the end of the experiment was measured. The solubility of the barite was measured using the following equation:
(2)
where, the initial barite weight is 4 g in 100 ml of solvent; the dissolved barite weight is the difference between the initial barite (start of the test) and the remaining barite (at the end of the test).
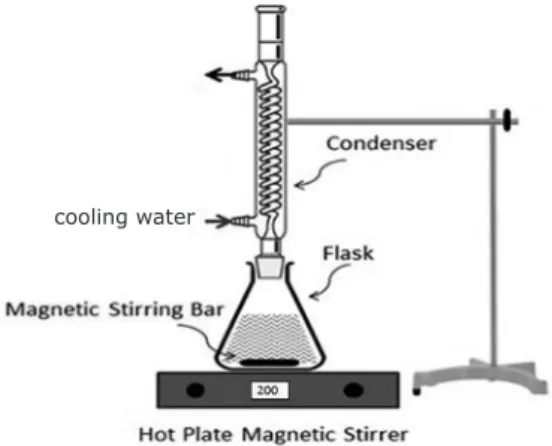
Figure 3: Assembled solubility test setup at high temperatures.
Scanning Electron Microscopy (SEM)
Characterization and Analysis
The chemical composition of the industrial barite was determined using scanning electron microscopy (SEM-EDS) to evaluate the purity of barite before the dissolution with the chelating agent. Similarly, the composition of the solids remaining after the dissolution was evaluated to study the change of the chemical composition during the solubility test. The surface area structure of the barite was estimated according the high resolution SEM pictures before and after the dissolution with the chelating agent. The samples were dried for at least 6 hrs and then gold-coated to be viewed using the SEM specimens.
Particle Size Analysis
The particle size distribution of the industrial barite solids was measured using the wet dispersion unit ANALYSETTE 22 Nano Tec plus.
X-Ray Diffraction Analysis
X-ray diffraction spectroscopy was used to measure the mineralogy of the industrial barite (using with PANalytical X-ray, Philips Analytical). The XRD data were used as a confirmation for the EDS analysis results. The XRD was also carried out to determine the mineralogy of the solids precipitated at the end of the solubility test.
Fourier Transform Infrared Spectroscopy
(FTIR)
The surface functional groups of industrial barite before and after the dissolution were evaluated using Fourier transform infrared (FPC FTIR Perkin Elmer spectrophotometer) analysis. A pellet was prepared by mixing (1-2 mg) of the barite with 100 mg of KBr. Then, the sample was exposed to a laser beam in the FTIR instrument. The instrument wave number ranged from 4000 to 400 cm-1.
cooling water
Solubility % 100
dissolved bariteweight initial bariteweight
RESULTS AND DISCUSSION
Solubility of Barite in Diethylene Triamine
Penta Acetic Acid (DTPA)
As shown in Table 1, the diethylene triamine penta acetic acid (DTPA) is available in a powder form (99%; Mw=393.4) and as an aqueous solution at a concentration of 40 wt.%. The DTPA solution exists either as potassium base or sodium base, viz.,
diethylene triamine penta potassium (DTPA-K5) and
penta sodium acetic acid (DTPA-Na5) respectively.
The DTPA solution was prepared as an aqueous solution using either NaOH [7] or KOH [8-9]. The hydroxide compounds were used to increase the pH of the distilled water. Since the chelating agent (DTPA-H5 powder) solubility in the distilled water is limited, the pH of the water must be raised to prepare the aqueous solution. Increasing the pH of the water either by using the NaOH or KOH increased the chelating agent solubility.
The DTPA solution potassium base was tested at variable concentrations ranging from 10 to 40 wt.%. These concentrations were prepared by diluting the
40 wt.% DTPA-K5. The pH of the DTPA was kept in
the range of 11-12. The dissolution capacity of the barite in DTPA potassium base is shown in Figure 4.
The results show that the DTPA-K5 concentration of
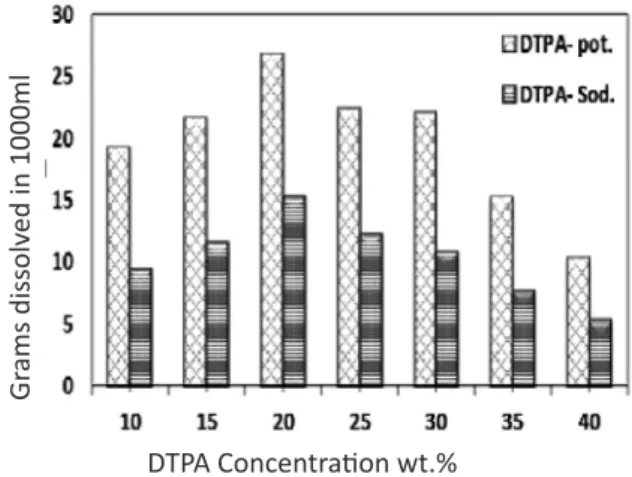
20 wt.% at a high pH (11-12) yielded the maximum dissolution rate of barite particles. The test was run for 24 hrs at 200 °F. The maximum removal capacity was about 67 wt.% (equal to 26.8 grams of industrial barite per liter of 20 wt.% DTPA-K5), as shown in Figure 4 and Figure 5.
Sodium hydroxide was used to increase the pH to 12 to prepare the sodium base of the DTPA-Na5. The same experimental conditions of 200 °F and 4 g of barite in 100 ml of solvent were applied for this purpose. Various
concentrations of DTPA-Na5 were prepared to optimize the concentration of DTPA-Na5. The pH of the solution was kept in the range of 11 to 12. The experimental results show that about 15 g of barite particles was dissolved (a solubility percentage of 38 wt.%) at the optimum concentration of DTPA (20 wt.%) as shown in Figure 4 and Figure 5.
The potassium base of the DTPA chelating agent (DTPA-K5) yielded a higher dissolution rate of barite compared to the sodium base (Figure 4). Therefore, special attention was given here to study the effect of pH on the dissolution of barite in 20 wt.% DTPA-K5 solution (optimum concentration as shown in Figure 4).
Figure 4: Barite solubility (in percentage) with DTPA-potassium/sodium base (pH=11-12; T= 200 °F; Duration= 24 hr).
Figure 5: Comparing DTPA potassium/sodium base solubility in grams per liter (pH=11-12; T= 200 °F; Duration= 24 hr).
DTPA Concentration wt.%
Barit
e Solubility w
t.%
DTPA Concentration wt.%
Gr
ams dissolv
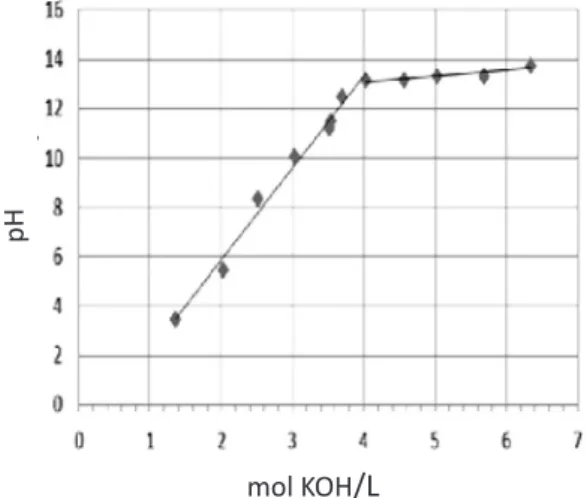
The solubility of DTPA powder is limited in water, so adding KOH is required to increase the solubility. This also helps to increase the pH. 1.3 M of KOH (Mw=56.11) solution was found to be sufficient to make DTPA at a concentration of 20 wt.% with a pH around 3.5 as shown in Figure 6. The required concentration of KOH needed to prepare a certain pH of the DTPA solution of 20 wt.% is shown in Figure 6. As the pH of the solution reaches a value higher than 12.5, the DTPA becomes fully deprotonated and less sensitive to the concentration of KOH.
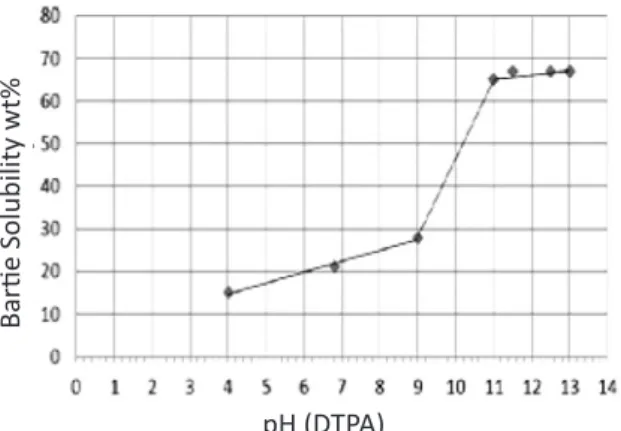
The dissolution capacity of industrial barite particles increases by increasing the pH of 20 wt.% DTPA potassium base (Figure 7). The barite solubility reached the maximum value at a pH greater than 11, which is prepared by 3.5 M of KOH. It was noted that increasing the KOH concentration from 3.5 to 4.5 M (to obtain a pH greater than 11) has no effect on the barite dissolution in a 20 wt.% DTPA solution. Higher concentrations of the KOH, more than 4.5 M, have a reverse effect on barite dissolution rate in the 20 wt.% DTPA solution. Therefore, for preparing DTPA penta potassium using DTPA powder, it is recommended that the KOH concentration be kept in the range of 3.5 to 4.5 M to achieve the maximum barite dissolution.
Figure 6: Molarity of KOH to prepare a DTPA solution of 20 wt.%.
Figure 7: Effect of pH on barite solubility (T= 200 °F; Duration= 24 hr).
The rate of the dissolution of Ba2+ from BaSO
4 using chelating agents is affected by several resistances based on the concentration of the chelating agent and the pH of the solution [14]. At a low pH, where the chelating agent exists in the acidic form, the presence of hydrogen ions compacts the chelating agent and minimizes the dissolution of Ba2+. The
chelating ability is increased by increasing the pH and reaches the maximum for fully deprotonated chelating agent. In our case, at a high pH, higher than 11, the dissolution is affected by the concentration of DTPA in the solution. At a low concentration of DTPA, lower than 15 wt.%, the driving force between the bulk concentration of DTPA in solution and to the one on the surface of barite is low. Therefore, the rate of dissolution is mainly controlled by the mass transport of DTPA. However, at high concentrations, this effect is negligible compared to the effect of the adsorption of DTPA on the surface of barite and the solution complexation reaction thereafter. Thus the DTPA is first adsorbed onto the surface followed by solution complexation reaction between DTPA and
BaSO4 according to the following equation:
4 5
2
HY− +OH Y− − +H O (3) mol KOH/L
pH
pH (DTPA)
Bartie Solubility w
Figure 8: Stability of DTPA solution with time.
The above results were conducted based on 24-hr solubility test. Therefore, the effect of time on the dissolution rate of barite in 20 wt.% DTPA-K5 was tested here. The relationship between the industrial barite solubility in the 20 wt.% DTPA penta potassium and time indicated that there
was a significant increase in the percentage of barite solubility at the time period up to 24 hrs. The maximum value of barite solubility was 67 wt.% at 24 hrs. Afterwards, the dissolution rate of barite in DTPA remained almost the same in the range of 67 wt.% up to 70 wt.% (Figure 9). Based on this result, 24 hrs can be taken as the optimum time to achieve good barite solubility. Increasing the time for more than 24 hrs is not recommended due to the minor impact on the barite dissolution beyond this time.
Figure 9: Relationship between time and barite dissolution in 20 wt.% DTPA-K5 (T= 200°F).
Solubility of Barite in Ethylene Diamine
Tetra Acetic Acid (EDTA)
The EDTA sodium base solutions can be prepared using the NaOH from the EDTA powder (C10H16N2O8).
EDTA tetra sodium (EDTA-Na4) was available at 39
wt.% aqueous solution. The results show that the maximum dissolution capacity of the industrial barite solids was around 26 wt.% using 20 wt.% of
EDTA-Na4 as shown in Figure 10. The pH of the
EDTA-Na4 solution was 12 and the test was conducted for 24 hrs at 200 °F.
The other type of EDTA sodium base was EDTA disodium (EDTA-Na2 98-100% powder; C10H14N2Na2O8.2H2O). The disodium EDTA solution was prepared using
Bartie Solubility w
t.%
Time, hr
(4)
(5)
A higher concentration of DTPA, greater than 25 wt.%, leads to a decrease in the rate of dissolution due to increasing the competitive adsorption of DTPA on the surface of barite, thereby decreasing the rate of desorption of Ba2+ into the solution (increasing desorption
resistance of Ba2+). Moreover, when the concentration is
increased by more than 20 wt.% of DTPA, the viscosity rises and the reaction is retarded [15].
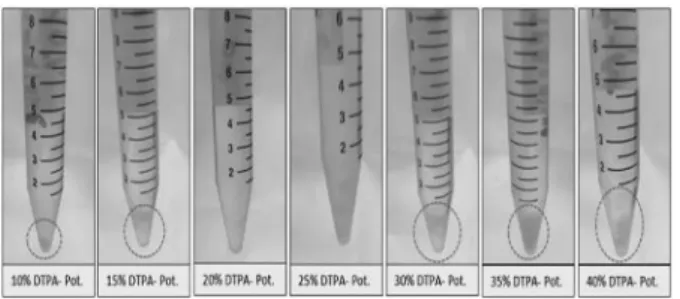
The stability of the solution after the solubility test was monitored for one hour after the test. The stability test gives another confirmation that 20 wt.% DTPA-K5 is the most stable concentration because it was able to hold the soluble barite in the solution. Figure 8 shows that there was a precipitation of barite solids in the solution after 1 hr. This precipitation increases with increasing the DTPA concentration. The concentration range of 20 to 25 wt.% was the most stable with time. Monitoring these solutions for longer times up to 48 hrs showed that the 20 wt.% yielded constant stability.
(4 ) (3 ) (2 )
4 4 2
BaSO HY+ − +OH−→BaY − +SO − +H O
5 3 2
4 4
BaSO +Y− BaY−+SO −
�
-5 -3 -2
distilled water and NaOH. The solubility of EDTA disodium (EDTA-Na2) in water was limited, so the pH of the solution was increased by NaOH. Where EDTA disodium becomes soluble, the lowest pH value is around 8.5. The dissolution of the solids was very small in EDTA disodium at concentrations ranging from 10 to 30 wt.%. The maximum dissolution capacity of the solids was around 6 wt.% using 20 wt.% of EDTA-Na2 during 24 hrs at 200 °F.
Di potassium EDTA-K2 (99% Powder) was used to prepare different concentrations of EDTA-K2 to evaluate the barite dissolution rate. The di potassium EDTA 20 wt.% is soluble in water at a pH around 5. In this condition, the solubility of barite was limited in EDTA-K2; the barite solubility reached 10 wt.% as the maximum value using 20 wt.% EDTA-K2 in 24 hours.
The potassium base EDTA-K4 was prepared using EDTA powder (C10H16N2O8) and the KOH water solution. The results of EDTA-K4 potassium base is shown in Figure 10. 20 wt.% of EDTA-K4 dissolved 64 wt.% of the barite. Altering the base of EDTA from sodium to potassium using KOH enhanced the solubility of industrial barite by 38% from 26 to 64 wt.% (Figure 10). The capacity of barite dissolution reached 25.6 g/L by using potassium base EDTA compared to sodium base (Figure 11).
Figure 10: Barite solubility (%) with EDTA- potassium/ sodium base (pH=11-12; T= 200°F; Duration= 24 hr).
Figure 11: Comparing EDTA potassium/sodium base solubility in grams per liter (pH=11-12; T= 200 °F; Duration= 24 hr).
1.7 M of KOH (Mw=56.11) solution is sufficient to make a concentration of 20 wt.% of EDTA powder soluble in distilled water at a pH of 4.8 as shown in Figure 12. The required concentration of KOH needed to prepare an EDTA solution 20 wt.% with a certain pH is shown in Figure 12. Using KOH solution at concentrations ranging from 4 to 5 M is sufficient to prepare 20 wt.% EDTA with pH ranging from 11 to 12.5. From the point of view of the dissolution of barite, it is not recommended that the concentration of KOH solution be increased to more than 5 M to prepare the EDTA solution.
Figure 12: Molarity of KOH to prepare a 20 wt.% EDTA solution.
Barlt
e Solubility w
t.%
EDTA Concentration wt%
EDTA Concentration wt.%
Gr
ams dissolv
ed in 1000 ml
pH
Hydroxyethyl Ethylene Diamine Triacetic
Acid (HEDTA)
The dissolution rate of industrial barite was evaluated using sodium base hydroxyethyl ethylene diamine triacetic acid (HEDTA-Na3) at high pH values. The results show that the dissolution of barite particles in HEDTA was low. The optimum concentration of HEDTA is 20 wt.%, where 6.5 g of barite was soluble in one litter of 20 wt.% HEDTA-Na3.
Glutamic Acid, N, N-Diacetic Acid (GLDA)
Two types of GLDA sodium base high pH (11-12) and low pH (3.5) were used to evaluate the dissolution rate of barite. It was found that the barite gave zero solubility in the GLDA at both low and high pH values.Characterization of Barite before and
after Solubility Using DTPA-K
54.5.1 SEM, XRD, and Particle Size Analysis
The solubility experiments showed that DTPA-K5 and
EDTA-K4 were the most effective chelating agents in dissolving barite. Several analyses were conducted to understand the mechanism of the dissolution
of barite in DTPA-K5. The SEM-EDS analysis for the
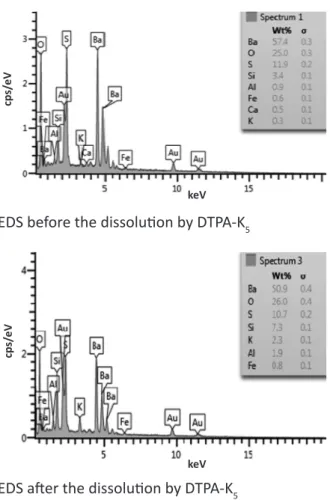
barite was conducted in different spectrum ranges to cover the variable sites of the same sample. Figure 13 shows the chemical composition of the industrial barite used in this work before and after the dissolution in DTPA-K5. The data presented that the main elements are barium and sulfur which
obtained form barium sulfate (BaSO4). Based on EDS
data, the impurities including (Si, Al, Ca, etc.) was ranged from 5 to 7 wt.% in average over the whole spectrum range. Although the EDS result showed that the purity of the barite is around 94%; besides, the XRD considered the purity of the barite as
99-100 wt.%. The impurities were not observed by XRD. An untreated sample demonstrated 10 major peaks related to pyrite crystalline phases. These peaks appeared at 2θ values of 20.46 (011), 22.79 (111), 24.87 (002), 25.86 (210), 26.85 (102), 28.75 (211), 31.53 (112), 32.81 (020), 42.59 (113), and 42.93 (122). Upon treatment, the intensity of these peaks reduced by 50% and became wider, which lead to more amorphous phases.
The particle size results indicated that the industrial barite used in this study had a narrow distribution with a mean particle size ranged from 30 to 40 micron. The 200 μ scale high resolution image of SEM in Figure 14 shows that the majority of the barite particles have a sharp edge and most of the particles have a size of 30 to 50 micron. This observation about the particle size of the industrial barite using SEM confirmed the collected data from the particle size distribution analysis.
The lower scale picture (5 μ) focuses on one particle to display the size of the pores in the barite particles; in addition to, the pore size of the barite particles was found to be around 2-3 μ in length and 1-2 μ in width. The pore size on the surface of the barite particles increased due to the dissolution of DTPA-K5 which increased the area of the reaction and the dissolution rate. The composition of the solid remaining after the dissolution was analyzed to evaluate the precipitated solids. The EDS showed that the precipitated solids contained only barium, which indicated that no new composition formed and the precipitate was barite (Figure 13). The appearance of potassium was due to the base of the DTPA (potassium base). The XRD results of the precipitated showed that there is quartz (SiO2)
EDS before the dissolution by DTPA-K5
EDS after the dissolution by DTPA-K5
Figure 13: SEM (EDS) analysis of barite solids before and after the dissolution in DTPA-K5.
SEM image of barite particles before the
dissolution by DTPA-K5
200 μ, and 5 μ
SEM image of barite particles after the
dissolution by DTPA-K5
200μ, and 5 μ Figure 14: SEM images of barite particles before and after dissolution with DTPA-K5.
4.5.2 FTIR Analysis
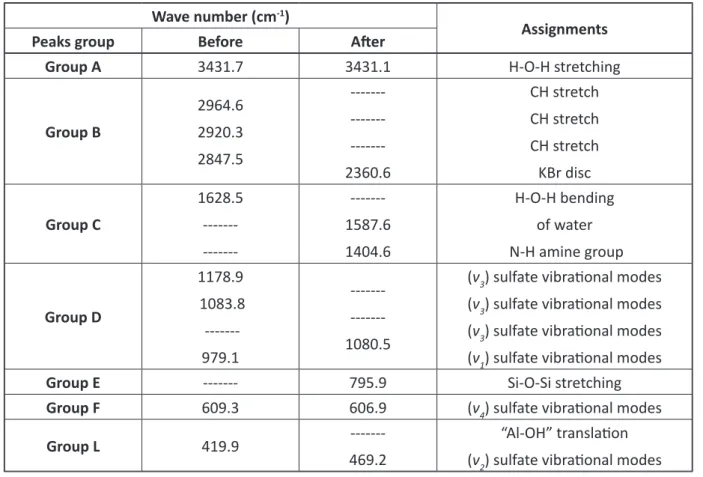
The upper section of Figure 15 shows the FTIR spectroscopy for the barite solids before the dissolution, whereas the FTIR for the solids remaining after the solubility with DTPA-K5 is shown in the bottom section of the figure. Table 4 shows that the major FTIR absorption bands for barite solids before dissolution (BSB), and barite solids after the dissolution (BSAD) can be divided into seven groups depending on the different frequencies of the band position. The comparisons between the FTIR peaks for BSB and BSAD and possible assignments for each peak are presented in Table 4. There are four fundamental vibrational modes of sulfate bands
called nondegenerate (v1), one doubly degenerate
(v2), and two triply degenerate (v3 and v4) [16–21].
Figure 15: FTIR analysis for barite particles before and after the dissolution in DTPA-K5.
Wavenumbers (cm-1)
Tr
ansmitt
ance(%)
keV
cp
s/
eV
keV
cp
s/
Table 2: Infrared band positions of the studied barite. Wave number (cm-1)
Assignments
Peaks group Before After
Group A 3431.7 3431.1 H-O-H stretching
Group B
2964.6 2920.3 2847.5
---2360.6
CH stretch CH stretch CH stretch KBr disc
Group C
1628.5
---1587.6 1404.6
H-O-H bending of water N-H amine group
Group D
1178.9 1083.8
---979.1
---1080.5
(v3) sulfate vibrational modes
(v3) sulfate vibrational modes
(v3) sulfate vibrational modes
(v1) sulfate vibrational modes
Group E --- 795.9 Si-O-Si stretching
Group F 609.3 606.9 (v4) sulfate vibrational modes
Group L 419.9
---469.2
“Al-OH” translation
(v2) sulfate vibrational modes
FTIR spectroscopic analyses for the BSB and BSAD solid materials showed that the dissolution of barite particles in DTPA-K5 affected the bands position and the absorbance intensity. Group-A shows two bands at 3431.7 cm-1 in BSB and 3431.1 cm-1 in BSAD, which signifies the presence of O–H stretching mode of hydroxyl groups and absorbed water [22,23]. The
peak at 3431.1 cm-1 in BSAD becomes broader after
the dissolution and the absorbance intensity of this peak was decreased when the barite was dissolved in DTPA-K5 (potassium hydroxides base). In group-B,
the peaks at 2964.6, 2920.3, and 2847.5 cm-1
appeared in BSB with a very low intensity, which are related to CH stretch [23,24]. These peaks are completely disappeared after the dissolution. The
peak at 2360.6 cm-1 in BSAD was appeared which
is not diagnostic of any mineral in the used barite
sample, and it appeared due to the use of KBr in the sample preparation for FTIR [21].
On the other hand, in group-C, the peak at 1628.5 cm-1 in BSB is subsequent to a slight amount of water being present in barite crystal [19]. The intensity of this peak increased and shifted to 1587.6 cm-1 in BSAD as an indication of the capability of barite to absorb water due to the dissolution of barite solids
in DTAP [23,25]. The new peak at 1404.6 cm-1 was
found only in BSAD, which indicated the presence of N-H bending in the amine group created by using the DTPA.
In group-D, the peaks at 1178.9 and 1083.8 cm-1
appeared at 1080.5 cm-1 in BSAD as a result of the
dissolution of barite in DTPA-K5. The new peak at
1080.5 cm-1 is attributed to (v
3) sulfate vibrational
mode [17,18]. The decrease of the 1080.5 cm-1 peak
intensity means that some of the sulfate functional groups were removed due to the dissolution. The new peaks at 795.9 cm-1 was related to Si-O-Si group [26]. This peak confirmed the SEM results, where the weight percentage of Si increases after the dissolution of barite in DTPA. The peak at 609.3 cm-1, which is related to the (v
4) vibrational modes of sulfate, was shifted to 606.9 cm-1 with the same intensity for the same vibrational mode [17,18]. This was an indication that the v4 vibrational mode of sulfate was not easy to break during the dissolution of barite. The peak at 419.9 cm-1 refers to the presence of the Al-OH translation modes in BSB [27]. Al was seen also in the SEM results as one of the impurities in the industrial barite used in this study. The intensity of this peak was decreased as result of the dissolution of barite in DTPA. The peak at 469.2 cm-1 in BSB was seen in low intensity, and, in the BSAD, it was displayed as an indication of (v2)
sulfate vibrational modes [18,19,28].
CONCLUSIONS
Based on the results obtained from evaluating the dissolution rate of the industrial barite particles in different chelating agents at a high temperature (95°C) in the current study, the following conclusions can be drawn from this current study:
• Potassium base DTPA-K5 and EDTA-K4 at a
concentration of 20 wt.% provided the maximum barite dissolution capacity, viz. 26.8 g/l and 25.6 g/l during 24 hrs respectively.
• The recommended pH of DTPA-K5 and EDTA-K4
should be greater than 11 to achieve the maximum solubility of barite.
• At a high pH, the dissolution of barite is controlled by the adsorption of DTPA on the surface and the solution complexation reaction thereafter.
• Using sodium base DTPA, EDTA, and HEDTA at a high
or low pH is not recommended for dissolving barite.
• The barite dissolution rate in chelating agents DTPA-K5 and EDTA-K4 increases with time up to 24 hrs. The soaking process after 24 hrs has a minor effect on barite dissolution.
• The FTIR results showed the high capability of the DTPA potassium base to break the v3 and v1 sulfate vibrational modes; however, the v4 sulfate vibrational mode was hard to break during the dissolution.
• The original barite consisted of v1, v3, and v4 vibrational sulfate modes. After dissolution, the barium sulfate was found to be in v2 and v4 vibrational sulfate modes. The v2 mode was formed during the dissolution.
• The dissolution capacity of other chelating agents was found to be as follows: DTPA-Na5 (15.2 g/L), EDTA-Na4 (10.5 g/L, HEDTA-Na3 (6.7 g/L), GLDA-Na4 (zero), EDTA-K2 (4 g/L), and EDTA-Na2 (2.4 g/L) during a soaking time of 24 hours at 95°C.
REFERENCES
1. Fink J. K., “Petroleum Engineer’s Guide to Oil Field Chemicals and Fluids,” Waltham, MA: Gulf Professional Pub., 2012.
2. Bageri B. S., Al-Majed A. A., Al-Mutairi S. H., Ul-Hamid A., et al., “Evaluation of Filter Cake Mineralogy in Extended Reach and Maximum Reservoir Contact Wells in Sandstone Reservoirs,” SPE/IADC163519, Presented at SPE/IADC Drilling Conference, Amsterdam, The Netherlands, 2013, 5-7 March.
Dissolution of Barite: A Morphology Approach.,”
J. Colloid Interface Science, 1999, 214, 427–437. 4. Clemmit A. F., Ballance D. C., and Hunton
A. G., “The Dissolution of Scales in Oilfield Systems,” SPE-14010, Presented at Offshore Eur. Aberdeen, United Kingdom, 1985, 10-13 Sept. 5. Morris R. L. and Paul J. M., “Method for
Removing Sulfate Scale,” US Patent, 1990. 6. Lakatos I., Lakatos-Szabo J., and Kosztin B., “Optimization of Barite Dissolvers by Organic Acids and pH Regulation,” SPE 74667, Presented at International Symposium on Oilfield Scale, Aberdeen, United Kingdom, 2002, 30-31 January.
7. Lakatos I., Lakatos-Szabo J., and Kosztin B., “Comparative Study of Different Barite Dissolvers: Technical and Economic Aspects,” SPE 73719, Presented at International Symposium and Exhibition on Formation Damage Control, Lafayette, Louisiana, 2002, 20-21 February. 8. Putnis C. V., Kowacz M., and Putnis A., “The
Mechanism and Kinetics of DTPA-Promoted
Dissolution of Barite,” Appl. Geochemistry,
2008, 23, 2778–2788.
9. Putnis A., Putnis C. V., and Paul J. M., “The Efficiency of a DTPA-based Solvent in the Dissolution of Barium Sulfate Scale Deposits,” SPE 29094, Presented at SPE International Symposium on Oilfield Chemistry, 14-17 February, 1995, 773-785.
10. Nasr-El-Din H. A., Al-Mutairi S. H., Al-Hajji H. H., and Lynn J. D., “Evaluation of a New Barite Dissolver: Lab Studies,” SPE 86501, Presented at SPE International Symposium on Exhibition and Formation Damage Control, 2004,18-20 February.
11. “Akzo Nobel Dissolvine Product Guide 10-2012” [Online]. Available: (https://www.akzonobel. com/dissolvine/system/images/AkzoNobel_ Dissolvine_Product_Guide_10-2012_tcm108-37894.pdf).
12. Bageri B. S., Mahmoud M. A., Al-Mutairi S. H., and Abdulraheem A., “Filter Cake Porosity and Permeability Profile along the Horizontal Well and,” International Petroleum Technology Conference held in Doha, Qatar, 2015, 6-9 December.
13. Bageri B. S., Mahmoud M., Al-Mutairi S. H., and Abdulraheem A., “Effect of Sand Content on the Filter Cake Properties and Removal During Drilling Maximum Reservoir Contact Wells in Sandstone Reservoir,” J. Energy Resour. Technol., 2015, 138, 032901.
14. Fred C. and Fogler H., “The Influence of Chelating Agents on the Kinetics of Calcite Dissolution,” J. Colloid Interface Sci., 1998, 204, 187–197. 15. Mahmoud M. A., Nasr-El-Din H. A., Wolf C.
De, and James N., “Stimulation of Carbonate Reservoirs Using GLDA (Chelating Agent) Solutions,” SPE-132286, Presented at Trinidad and Tobago Energy Resources Conference, Port of Spain, Trinidad, 2010, 27-30 June.
16. Ramaswamy V., Vimalathithan R. M., and Ponnusamy V., “Synthesis of Well Dispersed, Elliptical Shaped Barium Sulfate Nanoparticles
via Water-chloroform Mixed Solvent,” Arch.
Phys. Res., 2010, 1, 217–226.
17. Povnnennykh A. S., “The Use of Infrared
Spectra for the Determination of Minerals,” Am.
Mineral., 1978, 63, 956–959.
18. Dimova M., Panczer G., and Gaft M., “Spectroscopic Study of Barite from the Kremikovtsi Deposit (Bulgaria) with Implication for its Origin,” Geol. Anal. Balk. Poluostrva,
2006, 67, 101–108.
19. Lane M. D., “Mid-infrared Emission Spectroscopy of Sulfate and Sulfate-bearing Minerals,” Am. Mineral., 2007, 92, 1–18.
20. Myneni S. C. B., Traina S. J., Waychunas G. a., and Logan T. J., “Vibrational Spectroscopy of Functional Group Chemistry and Arsenate Coordination in Ettringite,” Geochim. Cosmochim. Acta, 1998, 62, 3499–3514.
21. Lugwisha E. H. J., “Identification of Clay Minerals of the Eastern Southern Region of Lake Victoria by Ethylene Glycol and Heat: X-Ray Diffraction and Infrared Spectroscopy Studies,” Tanz. J. Sci., 2011, 37, 167–178.
22. Shawabkeh R. A., “Synthesis and Characterization of Activated Carbo-aluminosilicate Material
from Oil Shale,” Journal of Microporous and
Infrared Spectroscopic Characterization of Kaolinite from Assam and Meghalaya, Northeastern India,” J. Mod. Phys., 2010, 01, 206–210.
24. Mendelovici E., Frost R. L., and Kloprogge J. T., “Modification of Chrysotile Surface by Organosilanes: An IR–photoacoustic Spectroscopy Study,” J. Colloid Interface Sci., 2001, 238, 273– 278.
25. Frost R., Martens W., Williams P., and Kloprogge J., “Raman and Infrared Spectroscopic Study of the Vivianite-Group Phosphates Vivianite, Baricite and Bobierrite,” Mineral. Mag., 2002,
66, 1063–1073.
26. Palanivel R. and Velraj, G., “FTIR and FT-Raman Spectroscopic Studies of Fired Clay Artifacts
Recently Excavated in Tamilnadu, India,” Indian
J. Pure Appl. Phys., 2007, 45, 501–508. 27. Kloprogge J. T., Hickey L., and Frost R. L.,
“FT-Raman and FT-IR Spectroscopic Study of
Synthetic Mg/Zn/Al-Hydrotalcites,” J. Raman
Spectrosc., 2004, 35, 967–974.
28. Simonescu C. M., “Application of FTIR
Spectroscopy in Environmental Studies,” Adv.
Asp. Spectrosc., 2012, 2, 49-84.