TEEN DATING VIOLENCE PERPETRATION AMONG MIDDLE SCHOOL YOUTH: THE ROLE OF BULLYING, SEXUAL HARASSMENT, AND GENDER
Stacey Leigh Cutbush
A dissertation submitted to the faculty of the University of North Carolina at Chapel Hill in partial fulfillment of the requirements for the degree of Doctor of Philosophy in the Department
of Health Behavior in the School of Public Health.
Chapel Hill 2015
© 2015
ABSTRACT
Stacey Leigh Cutbush: Teen Dating Violence Perpetration among Middle School Youth: The Role of Bullying, Sexual Harassment, and Gender
(Under the direction of Vangie Foshee)
Although teen dating violence (TDV) has been associated with bullying and sexual
harassment, the developmental relationship among all three behaviors has rarely been examined, especially by gender. This dissertation used structural equation modeling to investigate the temporal sequence among perpetration of bullying, sexual harassment, and dating violence, and to determine if the sequence varies by gender. Study Aim 1first determined if the aggression measures were invariant for girls and boys. Study Aim 2a then tested whether sexual harassment perpetration mediates the relationship between bullying perpetration and TDV perpetration, while Study Aim 2b tested moderated mediation by assessing whether the developmental pathway varies by gender among middle school-aged youth.
The data were collected from one cohort of 7th grade middle school students. Students were surveyed every 6 months during 7th and 8th grades for a total of four waves of data
collection. Study Aim 1 was assessed using baseline (wave 1) data, whereas Study Aims 2a and 2b were assessed using data from waves 1 through 3.
The first study examined measurement invariance by gender of all aggression measures: perpetration of bullying, sexual harassment, physical TDV, psychological TDV, and electronic TDV. Both the physical and psychological TDV perpetration measures and the sexual
the next most stringent test of measurement invariance by gender, partial strict invariance. Electronic TDV achieved the next most stringent test of invariance by gender, metric/scalar invariance.
The second study tested whether sexual harassment perpetration mediates the relationship between bullying perpetration and TDV perpetration (2a), and then tested moderated mediation by assessing whether the developmental pathway varies by gender (2b). Results indicate no evidence of mediation. However, in the overall model, bullying and sexual harassment both emerged as significant predictors of TDV at a later time point. Among girls, only bullying significantly predicted TDV at a later time point, and, among boys, only sexual harassment significantly predicted TDV at a later time point.
To my mother, Hope, whose unwavering support inspired my passion to pursue my education. To my partner, Hill, whose steadfast belief in me gives me strength.
ACKNOWLEDGEMENTS
TABLE OF CONTENTS
LIST OF TABLES ... x
LIST OF FIGURES ... xi
CHAPTER 1: STUDY OVERVIEW... 1
Introduction ...1
Study Aims...3
Approach ...4
CHAPTER 2: OVERVIEW OF LITERATURE ON AGGRESSION: BULLYING, SEXUAL HARASSMENT, DATING VIOLENCE ... 7
Definitions of Bullying, Sexual Harassment, and Dating Violence ...7
Definition of Bullying ... 7
Definitions of Sexual Harassment ... 9
Definition of Teen Dating Violence ... 12
Empirical Evidence Examining Gender Differences Among Key Variables of Interest: Bullying, Sexual Harassment, and Dating Violence ... 15
CHAPTER 3: TEEN DATING VIOLENCE, SEXUAL HARASSMENT, AND BULLYING AMONG MIDDLE SCHOOL YOUTH: EXAMINING MEASUREMENT INVARIANCE BY GENDER (MANUSCRIPT #1) ... 19
Introduction ...19
Testing Measurement Invariance ... 20
Types and Implications of Measurement Invariance ... 22
Existing Studies of Measurement Invariance among Key Variables of Interest ... 25
Current Study ... 27
Sample and Procedures ... 27
Measures ... 29
Analysis Strategy ... 31
Results ...34
Measurement Models ... 34
Measurement Invariance ... 36
Discussion ...40
CHAPTER 4: TEEN DATING VIOLENCE, SEXUAL HARASSMENT, AND BULLYING AMONG MIDDLE SCHOOL STUDENTS: EXAMINING MEDIATION AND MODERATED MEDIATION BY GENDER (MANUSCRIPT #2) ... 43
Introduction ...43
Conceptual Framework for Examining the Pathway among Bullying, Sexual Harassment, and Dating Violence ... 44
An Integrated Approach to Examining Dyadic Aggression ... 44
A Developmental Life Span Perspective on Aggression: Bullying, Sexual Harassment, and Dating Violence. ... 44
Examining Aggression at the Intersection of Two Frameworks: A Developmental Life Span Perspective—and Gender, Power, and the Construction of Masculinity ... 47
Existing Studies: Empirical Evidence Pointing to Interrelationships among Bullying, Sexual Harassment, and Dating Violence ... 50
Studies Examining Both Bullying and Sexual Harassment ... 50
Studies Examining Both Bullying and Dating Violence ... 52
Studies Examining Both Sexual Harassment and Dating Violence ... 53
Studies Examining Bullying, Sexual Harassment, and Dating Violence ... 54
Current Study ... 55
Methods...57
Procedures ... 58
Participants ... 58
Measures ... 59
Analysis Strategy ... 63
Moderated Mediation ... 68
Results ...69
Measurement Models ... 69
Mediation ... 71
Moderated Mediation ... 76
Results for Girls ... 76
Discussion ...81
CHAPTER 5: SUMMARY... 89
LIST OF TABLES
Table 1-1. Comparison Sample Size at Each Wave ...5
Table 3-1. Types of Measurement Invariance and Criteria for Concluding Invariance ...22
Table 3-2. Results—Measurement Models: Goodness-of-Fit Indices ...35
Table 3-3. Results—Tests of Measurement Invariance for Physical TDV Perpetration ...36
Table 3-4. Results—Tests of Measurement Invariance for Psychological TDV Perpetration ...37
Table 3-5. Results—Tests of Measurement Invariance for Electronic TDV Perpetration ...38
Table 3-6. Results—Tests of Measurement Invariance for Sexual Harassment Perpetration ...39
Table 3-7. Results—Tests of Measurement Invariance for Bullying Perpetration ...40
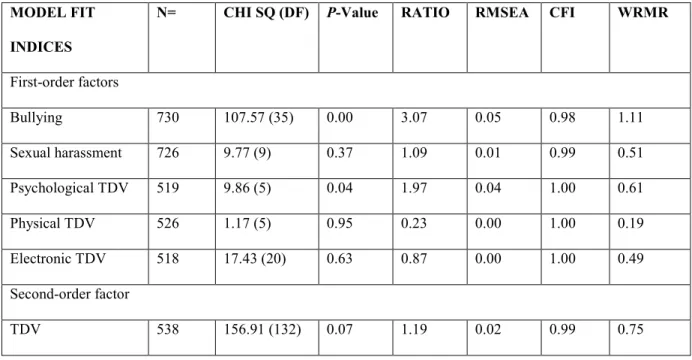
Table 4-1. Fit Indices for all First-order and Second-order Measurement Models ...71
Table 4-2. Fit Indices for Mediation Model—Overall Sample ...72
Table 4-3. Descriptive Statistics: Proportions of Key Outcomes of Interest for Mediation Model ...72
Table 4-4. Path Coefficients for Mediation Model—Overall ...73
Table 4-5. Factor Loadings on TDV for Mediation Model ...75
Table 4-6. Path Coefficients for Moderated Mediation—Girls...76
Table 4-7. Factor Loadings on TDV for Moderated Mediation—Girls ...79
Table 4-8. Path Coefficients for Moderated Mediation—Boys ...80
Table 4-9. Factor Loadings on TDV for Moderated Mediation—Boys ...81
LIST OF FIGURES
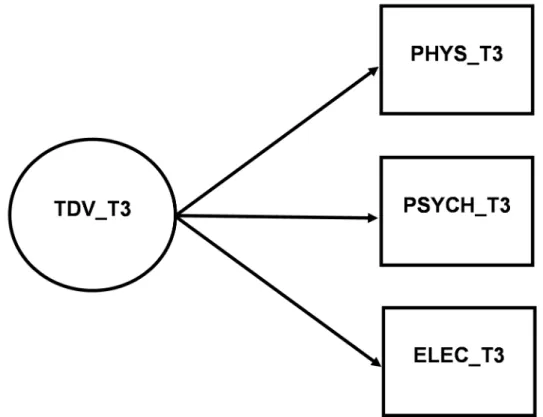
Figure 4-1. Second-Order TDV Factor Model ...64
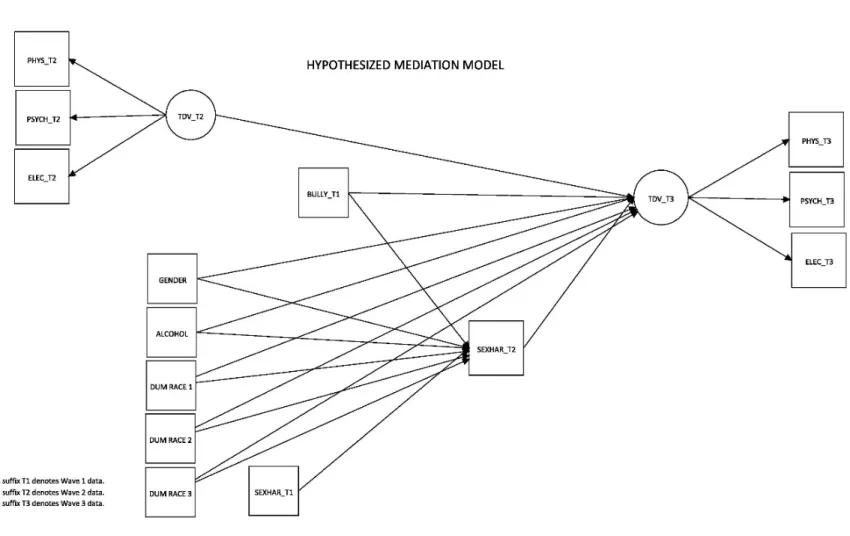
Figure 4-2. Hypothesized Mediation Model ...66
Figure 4-3. Results from Test of Mediation with Overall Sample ...74
Figure 4-4. Results from Test of Moderated Mediation for Girls ...77
CHAPTER 1: STUDY OVERVIEW
Introduction
Teen dating violence (TDV) is a growing public health concern that is garnering increased attention from researchers, practitioners, and policymakers (Break the Cycle, 2008; Library of Congress, 2011). Nationally representative data indicate that about 1 in 10 high school students (9.4%) report being hit, slapped, or physically hurt on purpose by a boyfriend or girlfriend (Centers for Disease Control and Prevention, 2012). Miller and colleagues (2009) found that among 6th-grade youth who are dating, 29% (15% of the total sample) reported perpetrating at least one act of physical violence against their boyfriend/girlfriend. Retrospective data also indicate that approximately 1 in 5 women and 1 in 7 men who were victims of physical violence, rape, or stalking as adults also reported experiencing dating violence between 11 and 17 years of age (Black et al., 2011). Factors associated with TDV include physical injuries, depression, eating disorders, lower academic achievement, increased risk for alcohol and other drug use, and suicide thoughts or attempts (Ackard & Neumark-Sztainer, 2002; Banyard & Cross, 2008; Centers for Disease Control and Prevention, 2006, 2010). A longitudinal study of TDV (Foshee et al., 2013) suggests that victimization by a dating partner may lead to deleterious
Knowledge about dating violence is in its infancy relative to other forms of violence. Most existing work relies on cross-sectional data, and studies of middle school-aged youth are
particularly scarce (Espelage, 2011). As a result, little information, particularly longitudinal data, exists to describe TDV among middle school students and inform prevention programming efforts. However, prevention science has begun shifting its focus to younger populations, namely middle school-aged youth—in its attempt to trace the etiology of TDV and thereby improve primary TDV prevention programming at an earlier age.
Developmentally, early adolescence is a time characterized by the onset of puberty, changing gender roles, more autonomous relationships with parents, and more mature relationships with peers, including dating interests in same- or opposite-sex peers. The emergence of dating relationships in middle school, therefore, signals an important time to investigate the onset of TDV. To investigate the onset of TDV any earlier—for example, in elementary schools—is unfeasible owing to the exceptionally low prevalence of dating and dating violence developmentally, coupled with resistance from schools and parents for probing young children on such behaviorally sensitive topics. To investigate the onset of dating and dating violence any later—for example, in high schools—misses an important opportunity for primary prevention in light of the high prevalence of dating and dating violence that already exists by later high school years. The middle school years, therefore, present a critical aperture for prevention that is developmentally salient and tolerated by most middle schools and parents.
developmental lifespan theoretical model that elucidates how aggressive behaviors diversify as children enter adolescence and encounter new age-relevant challenges. Such challenges include emerging sexuality and romantic interests, shifting norms that support aggressive behaviors, mixed-gender peer groups, and heightened gender role expectations, scrutiny, and adherence— each of which are affected by gender. This developmental lifespan theoretical framework thus underscores the interrelationships among bullying, sexual harassment, and dating violence, including how the developmental pathway from one form of aggression to another between girls and boys may be different. Because other types of peer aggression likely precede and/or exist outside of teen dating relationships, this study aims to identify whether and how bullying perpetration and sexual harassment perpetration among peers function as gateway behaviors to TDV behaviors, such as psychological, physical, and electronic TDV perpetration.
Study Aims
Two manuscripts were developed for the dissertation. Manuscript 1 addressed Study Aim 1 and Manuscript 2 addressed Study Aims 2a and 2b.
Approach
SEM is the analytic approach for the longitudinal data analyses in the proposed study. This analytic approach provides tools that can assess measurement invariance across gender for both latent and observed variables (Study Aim 1). SEM also enables testing of models that estimate mediational analyses; mediation, which explains how or why effects hold, will be used to determine whether bullying perpetration predicts TDV perpetration through sexual harassment perpetration (Study Aim 2a). SEM also allows for tests of mediated moderation analyses—or, contrasts of mediated effects—to assess gender differences between girls and boys for the hypothesized developmental pathways (Study Aim 2b).
The sequencing of Study Aim 1 (measurement invariance) followed by Study Aims 2a and 2b (mediation and moderated mediation, respectively) is purposeful in its scaffolding: Study Aim 1 will first test the reliability of measures across groups, while Study Aims 2a and 2b will then conduct longitudinal analyses invoking said measures.
Study Aims will be addressed using a longitudinal dataset collected by RTI International (RTI) as part of an independent evaluation (Principal Investigator Shari Miller) of Start Strong: Building Healthy Teen Relationships, a national program of the Robert Wood Johnson
11 and 2011–12 academic school years. Study Aim 1 (addressed in manuscript 1) was assessed using baseline (wave 1) data, whereas Study Aims 2a and 2b (addressed in Manuscript 2) were assessed using data from waves 1 through 3.
Because the primary goal of this study is to examine developmental pathways rather than evaluate program effectiveness, only comparison data will be used from this quasi-experimental evaluation, yielding the following analysis sample from each of the four waves of data
collection:
Table 1-1. Comparison Sample Size at Each Wave
N=754 Wave 1 Fall ‘10 (n=754)
Wave 2 Spring’11 (n=724)
Wave 3 Fall ‘11 (n=653)
Wave 4 Spring ‘12 (n=639) Grade 7th 7th 8th 8th
results will point to whether, when, and to what extent content on bullying prevention and sexual harassment prevention should be delivered to middle school youth as part of a TDV prevention strategy, or even to elementary school youth in a developmental appropriate way. In addition to advancing the TDV literature, this study will similarly contribute to the fields of bullying and sexual harassment.
CHAPTER 2: OVERVIEW OF LITERATURE ON AGGRESSION: BULLYING, SEXUAL HARASSMENT, DATING VIOLENCE
Although an upsurge in theoretically and methodologically sound TDV research has occurred during the last few years, relatively few well-designed TDV studies existed until recently (for a review, see Foshee & Matthew, 2007). Consequently, TDV prevention
programs—including the Start Strong initiative (2008–2012) from which this study’s data are drawn—have been largely informed by cross-sectional data to identify risk factors and
appropriate intervention targets. The need for longitudinal research to assess temporality and consequences of TDV remains. In this dissertation, longitudinal data will be used to address two Study Aims: measurement invariance by gender (Study Aim 1), mediation (Study Aim 2a) and moderated mediation by gender (Study Aim 2b).
This chapter (Chapter 2) defines key terms used in the proposed study—specifically, the varying definitions presented in bullying, sexual harassment, and TDV literatures, including how the proposed study will define them, as well as prevalence rates noted in the literature. The chapter then presents empirical evidence examining gender differences in prevalence of the key aggression behaviors.
Definitions of Bullying, Sexual Harassment, and Dating Violence
Definition of Bullying
of relationship aggression in which (1) the behavior is hostile in intent and intended to harm or disturb, (2) the behavior occurs repeatedly over time, and (3) there is a power imbalance, such that a more powerful person or group is attacking a less powerful one (Nansel et al., 2001; Olweus, 1993; Pepler et al., 2006). The abuse of power may be physical or psychological and characterized by either verbal aggression (e.g., name-calling threats), physical aggression (e.g., hitting), or psychological aggression (e.g., rumors, shunning/exclusion) (Nansel et al., 2001; Olweus, 1993; Pepler et al., 2006). The first nationally representative survey in the United Sates to focus on bullying, conducted by The National Institute of Child Health and Human
Development, found that 30% of 6th through 10th graders reported moderate to frequent involvement in bullying at school (Nansel et al., 2001).
Olweus, in his pioneering work on bullying, noted that bullying can be direct (e.g., open attacks that are physical and verbal) and indirect (e.g., shunning, exclusion). Among researchers in the field, the term bullying has been further delineated in several different ways. Researchers have also coined the term homophobic bullying, defined as the negative beliefs, attitudes,
stereotypes, and behaviors directed toward gay, lesbian, and bisexual people (Wright, Adams, & Bryant, 1999); homophobia functions as the underlying attitude informing this type of bullying. While this study’s bullying measures capture both direct and indirect forms of bullying, the measures do not distinguish whether the bullying was homophobic. The term sexual bullying has also been coined and is discussed in the next section.
have no significant history as bullies or victim. This study focuses on bullying perpetration, so any youth who endorse bullying perpetration—with or without having also experienced bullying victimization—are included in this study.
Bullying is a form of aggression that unfolds in the context of a relationship when one child asserts interpersonal power over another child (Pepler et al., 2006)—either through
personal characteristics, such as size, strength, or age (Olweus, 1993) and/or from knowledge of others’ vulnerabilities (Sutton, Smith, & Swettenham, 1999). Children also derive power from bullying via position in a social group, either from a high social status (Olweus, 1993) or by membership in a group of peers that support bullying (Salmivalli, Huttunen, & Lagerspetz, 1997). For instance, bullying may be used to renegotiate dominance within newly formed peer groups in middle school (Pelligrini, 2002).
Understanding the phenomenon of bullying is important because it may provide the earliest opportunity to intervene in aggressive behaviors in the lives of youth. The emergence of bullying perpetration may be the first sign of relationship aggression that, if left unchecked, could lead to further maladaptive relationship behaviors, for example, sexual harassment and dating violence.
Definitions of Sexual Harassment
had experienced nonphysical sexual harassment (e.g., sexual rumor spreading) at some point in their lives.
Among researchers in the field, however, there exist noteworthy differences in the way sexual harassment has been defined. The definition of sexual harassment, first delineated by MacKinnon in the 1970s, was originally outlined as a behavior by boys who exercised organizational power or sociocultural privilege to coerce sexual favors from women
(MacKinnon, 1979). Since then, the U.S. Department of Education has reshaped and expanded that definition: “Sexual harassment is defined as unwelcome sexual advances, requests for sexual favors, and other verbal, nonverbal, or physical conduct of a sexual nature by an employee, by another student, or by a third party, that is sufficiently severe, persistent, or pervasive to limit a students’ ability to participate in or benefit from an education program or activity, or to create a hostile or abusive educational environment” (U.S. Department of Education, 1997, p. 12038).
Although most researchers have historically defined sexual harassment under the aegis of the U.S. Department of Education, others increasingly use and define the term sexual violence (Basile et al., 2009; Espelage, Holt, & Poteat, 2010) as including sexual harassment: “Sexual violence encompasses a continuum of acts from unwanted noncontact exposures of a sexual nature (e.g., verbal harassment) to forcible penetration” (Basile & Saltzman, 2002). This recent shift to subsume sexual harassment within sexual violence stems in large part from the Centers for Disease Control and Prevention’s (CDC) efforts to decrease consistent use of terminology and data elements for sexual violence, including in their definition “nonconsensual noncontact acts of a sexual nature such as voyeurism and verbal or behavioral sexual harassment.”
between bullying and more advanced forms of sexualized violence. This claim is often premised upon Pellegrini’s contention (2002) that “bullying in adolescence may take the form of sexual harassment.”
Gruber and Fineran (2007, 2008), however, insist on conceptual clarity while leveraging these terms, suggesting that sexual bullying has muddled the definition both of sexual
harassment and bullying (Gruber & Fineran, 2008) and that such confusion may be harmful. Specifically, they point out that bullying is not illegal but sexual harassment is, thereby
suggesting that students and parents who perceive sexual harassment as a form of bullying may not exercise their rights for schools to take action—as schools are legally mandated to do. Moreover, they submit that when sexually based experiences are couched as bullying and not identified specifically as sexual harassment, victimization stemming from gender or sexuality “may be interpreted as private or interpersonal troubles experienced by unfortunate students who are caught up in difficult situations” (p 2).
Alongside incongruent terminology and definitions, these terms (sexual bullying, sexual harassment, and sexual violence) vary substantially in how they are conceptualized and operationalized across a spectrum of behaviors (Cunningham et al., 2010; Gruber & Fineran, 2007, 2008). Adding still further complexity, some researchers combine sexual harassment and sexual violence measures into a sexual violence scale, justifying the collapse per the notion that sexual harassment is a point on the continuum of sexual violence (Basile et al., 2009; Basile & Saltzman, 2002).
theory and research focuses on the personal or psychological, as well as situational factors, as the backdrop for the aggression. Their premise is that merely adding the term sexual to bullying as a means to describe a type of bullying that involves gender and sexuality is insufficient because the concept remains situated within the personal or psychological. The concept fails to account for historical, social, and political relations endemic to the behaviors (see Chapter 3 for a detailed discussion of this framework). Rather, they instead suggest that the concept of “sexual
harassment is more directly and clearly related to hegemonic masculinity and therefore taps into potent structural and culturally-sanctioned roles and meanings (masculine-feminine,
heterosexual-homosexual) that are central components of social stratification” (p 2).
Second, although CDC has put forward a viable conceptualization and measurement of sexual harassment as existing within the construct of sexual violence, per Basile and Saltzman’s inclusion of sexual harassment as noncontact sexual abuse (Basile & Saltzman, 2002), this study was unfortunately unable to capitalize on it. Several of the middle schools participating in the current study flatly refused to field any survey instruments containing measures explicitly referencing sexual violence. Therefore, the measure used in the proposed study were derived from the American Association of University Women Educational Foundation (AAUW) Sexual Harassment Survey (2001), also used by Gruber and Fineran (2007, 2008). In sum, for both conceptual and methodological rationales, this proposed study investigates sexual harassment, rather than either sexual bullying or sexual violence.
Definition of Teen Dating Violence
within a dating relationship, as well as stalking. It can occur in person or electronically and may occur between a current or former dating partner.” This study uses CDC’s definition of TDV; however, because the instrument in this study did not contain measures of sexual violence or stalking, only measures of physical TDV, psychological TDV, and electronic TDV are addressed. (Refer to Measures sections in Chapters 2 and 3 for more detail.)
Prevalence of Teen Dating Violence
A significant percentage of middle and high school youth experience TDV, as perpetrators and/or victims. Although no nationally representative studies of TDV perpetration exist,
nationally representative studies of TDV victimization indicate that about 1 in 10 high school students (9.4%) reported being hit, slapped, or physically hurt on purpose by a boyfriend or girlfriend (Centers for Disease Control and Prevention, 2012). Many nonrepresentative
prevalence estimates of TDV perpetration come from local studies, though these estimates vary widely due to inconsistencies in the time frames assessed, the specific behaviors included and measured, and the ages studied, and the sample characteristics (Foshee & Matthew, 2007). Nonetheless, Foshee and Matthew’s review (2007) showed local studies consistently
demonstrating high rates of adolescent dating violence perpetration, ranging from 11% to 41% for physical abuse and 14% to 82% for psychological abuse (Foshee & Matthew, 2007).
(2008) found that among 7th graders who had dated in the past year, 23% reported dating violence perpetration, and 30% reported dating violence victimization. Taylor et al. (2010) similarly found that among a sample of 6th and 7th grade students, 21% reported perpetrating at least one act of dating violence in their lifetime. These high prevalence rates suggest that TDV is a problem, presenting significant physical and psychological consequences for victims and perpetrators in middle school.
Health Correlates of Teen Dating Violence
Much TDV research focuses on correlates of TDV rather than consequences of TDV. This section highlights key health-related correlates of TDV. Most cross-sectional TDV studies concentrate findings on the host of risk factors associated with dating violence. Correlates include victims’ reduced mental health and posttraumatic stress (Wolitzky-Taylor et al., 2008), lower rates of self-esteem and higher rates of eating disorders (Ackard & Neumark-Sztainer, 2002), higher rates of suicidal thoughts and attempts (Ackard & Neumark-Sztainer, 2002; Howard, Wang, & Yan, 2007; Ramisetty-Mikler et al., 2006) and higher rates of substance use (Champion, Foley, et al., 2008; Ramisetty-Mikler et al., 2006). However, because most of the study designs are cross-sectional, it is impossible to conclude whether the correlates are predictors or consequences.
Health Consequences of Teen Dating Violence
stresses the physical injuries and even fatalities resultant from TDV, estimating that as many as 25% of male and female abuse victims experience injury (O'Leary et al., 2008). Most studies, however, focus on psychological outcomes and other health indicators. Long-term consequences include increased levels of depressive symptomatology among girls (Exner-Cortens, Eckenrode, & Rothman, 2013; Foshee et al., 2013) and boys (Foshee et al., 2013); antisocial behavior for girls (Exner-Cortens, Eckenrode, & Rothman, 2013; Roberts, Klein, & Fisher, 2003) and boys (Exner-Cortens, Eckenrode, & Rothman, 2013); suicidal ideation for girls (Exner-Cortens, Eckenrode, & Rothman, 2013; Roberts, Klein, & Fisher, 2003) and boys (Exner-Cortens, Eckenrode, & Rothman, 2013); nonillicit substance use for girls (Exner-Cortens, Eckenrode, & Rothman, 2013); illicit substance use for girls and boys (Exner-Cortens, Eckenrode, & Rothman, 2013; Foshee et al., 2013), as well as an increased likelihood of experiencing intimate-partner violence as an adult (Exner-Cortens, Eckenrode, & Rothman, 2013; Smith, White, & Holland, 2003; Wekerle & Wolfe, 1999).
Empirical Evidence Examining Gender Differences Among Key Variables of Interest:
Bullying, Sexual Harassment, and Dating Violence
Gender Differences in Prevalence among Behaviors of Interest
Bullying and Gender. Research consistently reports boys both bullying and being bullied significantly more than girls in the United States and worldwide (DeSouza & Ribeiro, 2005; Nansel et al., 2001; Pellegrini, 2001; Pellegrini & Bartini, 2001). Some studies indicate twice as many boys as girls report bullying (Charach, Pepler, & Ziegler, 1995; Craig & Pepler, 1997).
Beyond examining differences in bullying by gender, however, research also points to differences in types of bullying by gender—i.e., direct and indirect bullying (Archer & Coyne, 2005; Björkqvist, 2001; Feshbach, 1969; Lagerspetz, Björkqvist, & Peltonen, 1988). Direct bullying refers to physical aggression such as hitting, pushing, and tripping, as well as overt verbal aggression, such as name calling, taunting, and threatening. Indirect bullying, on the other hand, includes indirect aggressive behaviors that have been given various labels—including indirect, covert, relational, and social aggression—and that typically converge around a common theme of behaviors that include hurtful manipulation of relationships and that damage the
target’s social position in ways that often (though not always) avoid direct confrontation. This bifurcation of direct and indirect bullying is often supported by factor-analytic studies indicating two forms of aggressive behavior (Break the Cycle, 2008; Crick & Grotpeter, 1995; Grotpeter & Crick, 1996; Hart et al., 1998; Vaillancourt et al., 2003). Card et al. (2008)conducted a meta-analysis of gender differences in direct and indirect aggression; results regarding overall gender differences were consistent with prior reviews of the literature (Archer & Coyne, 2005): for direct aggression, boys tend to perpetrate more than girls, but for indirect aggression, there is little gender difference (i.e., although girls perpetrate statistically significantly more than boys, the difference was trivial in magnitude).
sexually harassed a peer (American Association of University Women Educational Foundation, 2001). Other studies buttress these findings: specific to sexual forms of aggression, studies consistently point to higher levels of sexual harassment perpetuated by both middle and high school-aged boys than girls and higher levels of victimization for girls (DeSouza & Ribeiro, 2005; Felix & McMahon, 2007; Fineran & Bennett, 1999; Fineran & Bolen, 2006; Fineran & Sacco, 2001; Hand & Sanchez, 2000; McMaster et al., 2002). However, there are two notable exceptions: Pellegrini (2001) and Gruber and Fineran (2008) found no statistically significant differences in sexual harassment experiences between boys and girls.
TDV and Gender.To date, gender remains a highly controversial topic within the dating violence literature; the question of whether the prevalence of dating violence perpetration vary as a function of gender is still unresolved. Much of the research on aggression within adolescent romantic relationships suggests similar rates of dating violence perpetration between girls and boys (Connolly, Pepler, Craig, & Tardash, 2000), with some suggesting slightly higher rates of perpetration among girls than boys (Champion, Wagoner, et al., 2008; McDonell, Ott, &
Mitchell, 2010; Rothman et al., 2010; Simon et al., 2010). Across multiple studies (Archer, 2000; Foshee et al., 2001), gender differences are rare, and when they do exist, boys report being victimized by dating partners more than girls.
When investigating severe acts of physical dating violence perpetration, however, others (Bennett & Fineran, 1998) found no gender differences in prevalence rates, or that boys reported higher prevalence rates than girls from ages 13 to 19 years (Foshee et al., 2009). A recent
CHAPTER 3: TEEN DATING VIOLENCE, SEXUAL HARASSMENT, AND BULLYING AMONG MIDDLE SCHOOL YOUTH: EXAMINING MEASUREMENT INVARIANCE
BY GENDER (MANUSCRIPT #1)
Introduction
Much research has examined gender differences in the prevalence and etiology of three forms of relational aggression among youth: teen dating violence (TDV), sexual harassment, and bullying. Despite copious research examining such gender differences and the practical and theoretical implications of this research, researchers have given only scant attention to
determining whether boys and girls perceive the scales used to measure these forms of relational aggression in the same manner. If the scales measuring these constructs do not function the same for both boys and girls, any observed differences in scores (or lack thereof) may be a function of flawed measurement and may not reflect true variability among items by gender. Stated another way, if boys and girls interpret the items comprising scales differently, this variation has
implications for the validity of the findings from prior studies that have examined gender differences in the prevalence and etiology of these behaviors. When measurement tools are perceived the same or “mean the same thing” to all respondents in a study, they demonstrate measurement invariance (McDonald, 1999; Millsap & Kwok, 2004; Williams et al., 2010).
gender, future studies can more confidently assert that any gender differences noted are due to actual differences in group means rather than artifacts of poor measurement. If differences are not measurement invariant, findings from past research using them should be interpreted in that light.
Testing Measurement Invariance
Measurement invariance indicates that an instrument measures a construct the same way across populations or groups (McDonald, 1999; Millsap & Kwok, 2004; Widaman & Reise, 1997). When measurement invariance holds, respondents from two groups with the same value on the underlying construct generate the same observed scores (Meredith & Millsap, 1992; Williams et al., 2010). Alternatively, two respondents from different groups may be equal on the underlying construct of interest but may result in different observed values if the measurement tools, or instrument, violate measurement invariance (Williams et al., 2010).
The consequences of violating measurement invariance are serious. Existing studies have assumed measurement invariance across gender. Should commonly used scales fail to achieve measurement invariance by gender, prior and future research findings could be invalidated. Systematic group differences in score items may bias results, and any differences on the items will be confounded by the differences due to the lack of measurement invariance (Millsap, 2011). Researchers must, therefore, carefully consider the measurement properties of the constructs prior to model estimation, because a lack of measurement invariance could seriously bias or alter conclusions (i.e., Type 1 or Type 2 errors) from tests of conceptual models
Measurement invariance is a statistical property of measures that can be tested with confirmatory factor analyses (CFA). CFA involves modeling the latent variable and observed (i.e., measured) variables relationship. CFA models include the following measurement
parameters for each specified indicator (item) of a latent variable: factor loadings, intercepts, and unique variances. Factor loadings refer to regression weights when the latent variable or factor is regressed on the observed variables or indicators. Intercept refers to the observed mean of the respective indicators. The residual term of an indicator contains both item-specific unique variance and random measurement error; unique variance is the amount of variance in the item that is not explained by the latent construct or factor.
Several typologies, or degrees, of measurement invariance exist, including configural invariance, metric (or weak) invariance, scalar (or strong) invariance, and strict invariance. CFA can be used to assess these varying types of measurement invariance by determining whether relevant model parameters (i.e., intercepts, loadings, or unique variances) are the same across groups—in this case, boys and girls.
Table 3-1. Types of Measurement Invariance and Criteria for Concluding Invariance Type of Measurement Invariance Criteria for Concluding Invariance
Configural invariance Requires indicators load on the same factor across groups Metric invariance Requires factor loadings be invariant across groups, but not
indicator intercepts and unique variances
Scalar invariance Requires both factor loadings and indicator intercepts be invariant across groups, but not unique variances Strict invariance Requires factor loadings, indicator intercepts, and unique
variances be invariant across groups
Types and Implications of Measurement Invariance
Configural Invariance
The weakest form of measurement invariance is configural invariance, which involves the nonmetric invariance of the factor pattern across groups (Widaman & Reise, 1997). If a measure demonstrates configural invariance, the indicators load onto the same factor(s), or latent
construct(s), across groups (e.g. boys and girls). In other words, the measure has the same configuration of loadings on factors and configural invariance is achieved.
Metric Invariance
If configural variance is achieved, the next most stringent form of measurement invariance is tested: metric invariance. Metric invariance requires not only that the same items load on the same factor(s) in the groups (i.e., as is required for configural invariance), but also that the magnitude of the factor loadings for each item be equivalent across groups. This form of invariance, however, does not require that the intercepts and unique variances associated with each indicator be invariant across groups.
Achieving metric invariance suggests that equivalent item-level reliability exists across groups, i.e., that there are equivalent factor loadings or weights—that the items are of equivalent importance for girls and boys. Metric invariance is a requirement for deriving scale scores.
Lack of support of a metric invariance model suggests differential item functioning,
meaning that one or more items is behaving differently across groups. In other words, each group is interpreting the item differently. Consequently, the item is not reliable because it is not
measuring the same “thing” for each group and may be of different importance, or weight, for each group. For example, in a study examining gender differences in the amount of TDV perpetrated, failure to achieve metric invariance suggests that the importance of any particular item, e.g., “pushed, grabbed, shoved, or kicked them” may exert undue influence on the latent factor, e.g., physical TDV perpetration, in ways that will bias the scale scores.
Because a failure to achieve metric invariance essentially calls into question the
Scalar Invariance
If metric invariance is achieved, the next most stringent form of measurement invariance is tested—scalar invariance—which requires that both the magnitude of the factor loadings and the indicator intercepts be invariant across groups. This form of invariance, however, does not require that the unique variances of the indicator be invariant across group. Scalar invariance is a prerequisite to the comparison of latent means; it is necessary for any testing of group mean differences.
Although achieving metric invariance indicates the established loadings are the same, achieving scalar invariance conveys the intercepts are the same—i.e., the function of the factor means will be equivalent across groups. If scalar invariance is achieved, the data suggest that differences between groups at the item level can be explained in terms of differences at the latent factor mean level (Marsh et al., 2011). For example, when scalar invariance is achieved, a
physical TDV factor model regressed on gender will yield unbiased effects. Significant differences will be meaningful, real, and valid. For this reason, support for scalar invariance models lends credibility to study results using measures under examination.
Strict Invariance
If scalar invariance is achieved, the next most stringent form of measurement invariance is tested: strict, or full, measurement invariance. Strict measurement invariance holds when there are no group differences in any of the said model parameters (i.e., factor loadings, intercepts, and unique variances). If strict invariance is achieved, the data suggest that groups are equivalent on the underlying latent construct and that the measurement tools accurately capture this
group (e.g., gender) differences on the latent factor itself (e.g., TDV perpetration). It indicates that unique variances—i.e., independent influences that affect each item’s variability —are the same across groups. Because of its exacting requirements, strict invariance is an ideal not often achieved. For this reason, achieving scalar invariance, rather than strict invariance, is typically acceptable for measurement purposes.
In summary, ignoring possible gender differences in measurement models can influence the magnitude of results, if not entirely alter conclusions about model results (Williams et al., 2010); understanding the typology and degree of measurement invariance will have implications for conclusions. If, for example, a TDV perpetration measure achieves scalar or strict
measurement invariance by gender, it lends support to the validity of study results from prior studies that have used that measure to examine gender differences. If, however, a TDV perpetration measure achieves only metric, or worse yet, configural, invariance, the results of analyses using that measure should be treated as tenuous. Failure to achieve metric or configural invariance suggests the need for revisions to the TDV perpetration scale and its items to ensure its validity for use in future studies of TDV perpetration and gender.
Existing Studies of Measurement Invariance among Key Variables of Interest
To date, only two studies have assessed any form of measurement invariance by gender on the key study constructs. Marsh et al. (2011) studied measurement invariance by gender of a bullying measure—the Adolescent Peer Relations Instrument—among a sample of middle and high school students in Australia, concluding support for configural, metric, and scalar
results should be interpreted accordingly. It is unclear whether similar findings would hold among a sample of middle school students in the United States.
Nocentini et al. (2011) conducted a study of measurement invariance of the Physical Dating Aggression Scale among high school samples in Canada and Italy. This scale is a revised version of the CTS (Conflict Tactics Scale) Physical Aggression Scale modified to make the items more appropriate for teens (Straus, 1979; Straus et al., 1996; Williams et al., 2008). They examined multiple-group models by testing configural invariance and then metric and scalar invariance. The responses to the items on the scale examined were categorical rather than continuous; having categorical rather than continuous indicators requires special statistical considerations that result in the need to test metric and scalar invariance simultaneously (Muthén & Muthén, 1998–2012). Configural invariance was achieved. On their test of metric/strict
invariance, results indicated partial measurement invariance across gender in each of the two countries. Partial measurement invariance exists when some, but not all, parameters are invariant. Their results suggest that one item did not achieve metric invariance: “slapping, kicking or biting;” the factor loadings for that one item differed significantly by gender. They, therefore, used the term partial invariance to suggest that some, but not all, of the items were invariant.
Current Study
The current study addresses a key issue relevant for research on TDV, sexual harassment, and bullying among youth: comparability of measurement across gender. The overarching goal of the proposed study is to determine whether frequently used measures of sexual harassment, bullying perpetration, and TDV, including measures for assessing physical, psychological, and electronic dating violence, are invariant for middle school girls and boys. CFA using structural equation modeling (SEM) will be used to test all types of invariance. SEM provides tools that can assess measurement invariance across gender for both latent and observed variables. Findings have important implications for the interpretation of past research and will inform future studies.
Methods
Sample and Procedures
socio-historical and cultural city contexts. Data for this study were derived from baseline data completed in fall 2010 from seventh grade students enrolled in the four comparison schools only.
Prior to baseline survey administration, students were recruited, parental consent was then obtained, and finally students were assented—in that order. Eligibility criteria for student participation included ability to complete the questionnaire in English or Spanish, and not being in a self-contained special education class; students in self-contained classes were not included owing to severe mental and physical handicaps that precluded their ability to complete the instruments in ways that would protect their confidentiality. Several weeks prior to data
collection, eligible students were given a letter explaining the study and were asked to deliver the letter to their parent(s). Only those students who provided written parent permission were
enrolled in the study.
The data were collected using paper-and-pencil, self-administered questionnaires in either small- or large-group settings, depending on the preference of the school, during regular school hours. Each survey administration had at least two trained field data collectors present. Teachers were asked to remain present when possible to maintain order; however, they were instructed not to circulate or answer questions about the survey. The study and data collection procedures were approved by the Institutional Review Board of RTI International.
Measures
In this study the students self-reported the measures used, which included perpetration of the following behaviors: physical dating violence, psychological dating violence, electronic dating violence, sexual harassment, and bullying. For this study, response options for each of the key variables of interest were coded dichotomously: never (0), any (1).
TDV Behavioral Measures
Physical TDV perpetration. Students were asked to complete a modified Families for
Safe Dates physical dating violence perpetration scale (Foshee et al., 2012). Students were asked to respond to the question, “How many times in the last 6 months have you done these things to a boyfriend or girlfriend? Do not count it if you did it in self-defense.” Five items were used to assess physical dating violence perpetration: “scratched or slapped them;” “physically twisted their arm or bent back their fingers;” “pushed, grabbed, shoved, or kicked them;” “hit them with your fist or with something else hard;” “beat them up.”
Psychological TDV perpetration. Students were asked to complete the Families for Safe
Dates (FSD) Psychological Dating Abuse Perpetration Scale (Foshee et al., 2012). Studentswere asked to respond to the question, “How many times in the last 6 months have you done these things to a boyfriend or girlfriend?” Five items were used to assess psychological TDV perpetration: “said something to hurt their feelings on purpose;” “insulted them in front of
others;” “would not let them do things with other people;” “made them describe where they were every minute of the day; “threatened to hurt them.”
Electronic TDV perpetration. Students were asked to complete amodified Youth
done the following things to a boyfriend or girlfriend using a cell phone, email, IM, text
messaging, Web chat, a blog, or a networking site like MySpace or Facebook?” Eight items were used to assess electronic dating violence perpetration: “called them names, put them down, or said really mean things to them;” “contacted them when they did not want you to, just make them mad;” “tried to make them afraid;” “spread rumors about them;” “made them afraid to not respond to you because of what you might do;” “showed private or embarrassing pictures/video of them to others;” “threatened to hurt them physically;” “repeatedly checked up on them to see where they were.”
Sexual Harassment Perpetration
Students were asked to complete a modified American Association of University Women Sexual Harassment Survey (AAUW, 2001). Students were asked to respond to the question, “In the last 6 months, how many times have you done any of these things to someone at school?” Six items were used to assess sexual harassment perpetration: “touched, grabbed, or pinched
someone in a sexual way;” “spread sexual rumors about them;” “made sexual jokes about someone;” “made sexual gestures or looks at someone;” “showed, gave, or left someone sexual pictures, messages, or notes;” “wrote sexual messages about someone on bathroom walls, locker rooms, or black boards.”
Bullying Perpetration
hurt or hit someone;” “left someone out from your group of friends;” “made fun of someone;” “called someone names;” “started a physical fight with someone.”
Analysis Strategy
The study aim was addressed by conducting SEM in two stages: tests of measurement models and then tests of measurement invariance.
Measurement Models
Measurement Invariance
Following the assessment of measurement models, and only when good model fit was achieved, multiple-group confirmatory factor analysis (MG-CFA) was used to test for
measurement invariance by gender in the physical TDV, psychological TDV, electronic TDV, sexual harassment, and bullying measures. Specifically, these MG-CFA analyses tested whether girls and boys perceived items differently. For these analyses, constraints were added to the measurement models to equate various parameters (i.e. factor loadings, intercepts, unique variances) across gender and tested the degree of measurement equivalence in each construct (Williams et al., 2010). Stated differently, invariance constraints were systematically added until either strict invariance was achieved or any further constraints produced lack of model fit, i.e., until the model did not fit the data as indicated by unacceptable goodness-of-fit indices.
strict invariance were followed by conducting yet another MG-CFA with all parameters constrained to be equal for boys and girls.
All analyses were conducted in MPlus 6.11 (Muthén & Muthén, 1998–2012). Owing to the binary coding of response options, MPlus employed the mean and variance-adjusted
least-squares estimator WLSMV (weighted least squared mean variance). Although delta
parameterization is the default using WLSMV estimation, measurement invariance analyses specified theta parameterization precisely because of the binary coding of response options. Using delta parameterization is unsuitable when running multiple-group models that include testing residual variances for the factor indicators because the delta parameters are functions of factor variances, factor loadings, and residual variances. When researchers test for measurement invariance of binary measures across groups, they must use theta parameterization instead because it allows access to the residual variances of the factor indicators as parameters. In other words, it allows specification of and information about the residual variances (unexplained variance in the observed indicators of factors), which is necessary for testing strict invariance (Muthén & Muthén, 1998–2012).
Fit Indices
Fit indices are measures of how well the observed and model-indicated covariance
Additionally, chi-square ratio tests were calculated by dividing the chi-square by the degrees of freedom (DF); a chi-square ratio under 2 is an acceptable cutoff, and indicates good model fit. Chi-squared difference tests (DIFF test) were used to test differences between nested models in CFA, i.e., models that are identical except that one of the models constrains
parameter(s) that the other one does not; significant results indicate a lack of measurement invariance by group, whereas nonsignificant results indicate measurement invariance by group. While the chi-square ratio test may be computed mathematically, MPlus automatically produces the DIFF test results.
Missing Data
MPlus’s WLSMV estimation accommodates for missing data using listwise deletion. Listwise deletion removes cases (subjects) if any of the variables included in the analyses has a missing value. Therefore, the N varied across CFA models; the sample size used in models ranged from 526 to 730 depending on missing data on the scale measuring each type of relational aggression: bullying (N=730); sexual harassment (N=726); physical TDV (N=526);
psychological TDV (N=519); electronic TDV (N=518). When one is testing for measurement invariance in MPlus using the DIFF test command, multiple imputation is not permissible (Mplus Home, 2006; Muthén & Muthén, 1998–2012).
Results
Measurement Models
Prior to conducting tests of measurement invariance, measurement models were conducted on each of the five scales of interest. CFAs yielded sound goodness-of-fit indices when
and the sexual harassment measure. As mentioned previously, an EFA was first conducted on the bullying scale, stratifying by gender, to determine if a one- or two-factor solution was a better fit to the data, followed by a CFA. Both the one-factor and two-factor solutions from the EFAs yielded strong goodness-of fit indices for boys and girls. Despite the fact that the chi-square ratio
was slightly elevated (RATIO=3.07), taken together, the goodness-of-fit indices suggest the data
fit the model well (RMSEA=0.05; CFI=0.98; WRMR=1.11). In addition, in both the boy and girl
models, the one-factor models had the largest eigenvalues when compared to the two-factor
models. Further, a one-factor solution is more parsimonious than a two-factor solution. The
scientific principle of parsimony suggests that “other things being equal, fewer factors are better
than many factors” (Goldberg & Velicer, in press). Therefore, owing to strong fit, largest
eigenvalues, the principle of parsimony, and also in line with the developer’s intent (Espelage & Holt, 2001), a single-factor model was retained for subsequent analyses (see Table 3-2).
Table 3-2. Results—Measurement Models: Goodness-of-Fit Indices
N=
Chi-Square
(DF)
RATIO P-Value RMSEA CFI WRMR
Measurement Invariance
Physical TDV Perpetration (Table 3-3)
The MG-CFA for configural invariance (unconstrained model) across gender was
achieved. Overall fit indices (RMSEA= 0.00, CFI=1.00; WRMR=0.18) indicate goodness of fit. These results suggest that an equivalent factor item structure exists for girls and boys. To test metric/scalar invariance, constraints were imposed to factor loadings and intercepts to fix or equate the parameters across groups. The difference test between these nested models (the unconstrained model and the model that constrained the factor loadings and intercepts to be the same for boys and girls) was not significant (Diff= 5.36 (3), p = 0.15), indicating that the
loadings and intercepts were invariant by gender (metric and scalar invariance). To test for strict invariance, constraints to unique variances were then imposed by fixing or equating them across groups (the unconstrained model and the model that constrained the factor loadings, intercepts, and residuals to be the same for boys and girls); the difference test was nonsignificant (Diff= 1.78 (5), p = 0.88), indicating that strict measurement invariance by gender was achieved. This same analytical process was executed for all variables below.
Table 3-3. Results—Tests of Measurement Invariance for Physical TDV Perpetration N= girls; boys CHI SQ (DF) P-Value RATI O DIFF TEST (DF); P-value
RMSEA CFI WRM
R
Psychological TDV Perpetration (Table 3-4).
The MG-CFA test of configural invariance (unconstrained model) by gender was achieved. The model yielded strong goodness of fit (RMSEA=0.040, CFI=1.00; WRMR=0.73), indicating an equivalent factor structure by gender. The difference test between the unconstrained and constrained model was not significant (Diff=2.68 (3), p=0.44), suggesting metric/scalar
invariance. Results for the subsequent strict invariance test were also nonsignificant (Diff=2.61 (5) p=0.76), indicating the unique variances are also invariant by gender.
Table 3-4. Results—Tests of Measurement Invariance for Psychological TDV Perpetration N= girls;
boys
CHI SQ
(DF)
P-Value RATIO DIFF
TEST
(DF);
P-value
RMSEA CFI WRMR
Unconstrained 270; 242 13.97 (10) 0.17 1.40 -- 0.04 1.00 0.73 Metric/Scalar 270; 242 15.56 (13) 0.27 1.20 2.68 (3),
p=0.44
0.03 1.00 0.81
Strict 270; 242 17.55 (18) 0.49 0.98 2.61 (5) p=0.76
0.00 1.00 0.88
Note: CHI SQ=Chi-Square; DF=Degrees of Freedom; RATIO=Chi-Square ratio test; DIFF test= Chi-Square difference tests; RMSEA=root mean-square error of approximation; CFI=comparative fit index; TDV=teen dating violence; WRMR=weighted root mean square residual. Goodness of fit is indicated by ratio < 2; p-value > .05; RMSEA = .05 or lower; CFI = .95 or higher; WRMR =1.0 or lower; DIFF test criteria = p<0.05.
Electronic TDV Perpetration (Table 3-5)
metric/scalar invariance. Constraints to unique variances were then added to the model. The test between the metric/scalar model and strict model, however, indicated a significant difference (Diff= 21.16 (8), p = 0.01). Therefore, strict invariance was not achieved; the unique variances are not invariant by gender.
Table 3-5. Results—Tests of Measurement Invariance for Electronic TDV Perpetration N= girls; boys CHI SQ (DF) P-Value RATI O DIFF TEST (DF); P-value RMSE A
CFI WRM
R
Unconstrained 265; 240 38.67 (40) 0.53 0.97 -- 0.00 1.00 0.77 Metric/Scalar 265; 240 44.23 (46) 0.54 0.96 5.99 (6); p=0.42) 0.00 1.00 0.86 Strict 265; 240 65.30 (54) 0.14 1.21 21.26 (8), p=0.01) 0.03 1.00 1.18 Note: CHI SQ=Chi-Square; DF=Degrees of Freedom; RATIO=Chi-Square ratio test; DIFF test= Chi-Square difference tests; RMSEA=root mean-square error of approximation; CFI=comparative fit index; TDV=teen dating violence; WRMR=weighted root mean square residual. Goodness of fit is indicated by ratio < 2; p-value > 0.05; RMSEA = 0.05 or lower; CFI = 0.95 or higher; WRMR =1.0 or lower; DIFF test criteria = p<0.05.
Sexual Harassment Perpetration (Table 3-6)
Table 3-6. Results—Tests of Measurement Invariance for Sexual Harassment Perpetration N= girls; boys CHI SQ (DF)
P-Value RATIO DIFF TEST
(DF);
P-value
RMSE
A
CFI WRM
R
Unconstrained 367; 350 11.76 (18) 0.86 0.65 -- 0.00 1.00 0.54 Metric/Scalar 367; 350 14.90 (22) 0.87 0.68 3.34 (4);
p=0.525
0.00 1.00 0.62
Strict 367; 350 29.01 (28) 0.41 1.04 11.99 (6); p=0.06
0.01 1.00 0.98
Note: CHI SQ=Chi-Square; DF=Degrees of Freedom; RATIO=Chi-Square ratio test; DIFF test= Chi-Square difference tests; RMSEA=root mean-square error of approximation; CFI=comparative fit index; TDV=teen dating violence; WRMR=weighted root mean square residual. Goodness of fit is indicated by ratio < 2; p-value > 0.05; RMSEA = 0.05 or lower; CFI = 0.95 or higher; WRMR =1.0 or lower; DIFF test criteria = p<0.05.
Bullying Perpetration (Table 3-7)
Results from the test for configural invariance (unconstrained model) suggest the groups have equivalent factor structures by gender. Goodness-of-fit indices suggest the one-factor model fit the data well for girls and boys (RMSEA=0.05, CFI=0.98; WRMR=1.27). After constraints were added to test the metric/scalar model, the difference test between the unconstrained and constrained models was nonsignificant (Diff= 5.20 (8), p = 0.74). The measure, therefore,
achieved metric/scalar invariance by gender. After adding constraints to the unique variances, the strict test for measurement invariance was conducted. Difference tests between the metric/scalar and strict models were significant (Diff= 21.55 (10), p = 0.02), suggesting a lack of strict
(Diff=10.56 (9), p=0.31). In sum, this measure achieved partial strict invariance when this one item’s residual was unconstrained.
Table 3-7. Results—Tests of Measurement Invariance for Bullying Perpetration N=
girls;
boys
CHI SQ
(DF)
P-Value RATIO DIFF TEST
(DF); P-value
RMSE
A
CFI WRM
R
Unconstrained 361; 351 135.60 (70) 0.000 1.99 -- 0.05 0.98 1.27 Metric/Scalar 361; 351 138.50 (78) 0.000 1.78 5.20 (8), p=0.74 0.05 0.99 1.30 Strict 361; 351 154.92 (88) 0.000 1.75 21.55 (10), p=0.02 0.05 0.99 1.52 Strict _Partial
(freeing B7 residual among males)
361; 351 137.48 (87) 0.0005 1.58 10.56 (9), p=0.31 0.04 0.99 1.40
Note: CHI SQ=Chi-Square; DF=Degrees of Freedom; RATIO=Chi-Square ratio test; DIFF test= Chi-Square difference tests; RMSEA=root mean-square error of approximation; CFI=comparative fit index; TDV=teen dating violence; WRMR=weighted root mean square residual. Goodness of fit is indicated by Ratio < 2; p-value > 0.05; RMSEA = 0.05 or lower; CFI = 0.95 or higher; WRMR =1.0 or lower; DIFF test criteria = p<0.05.
Discussion
This present study contributes to the literature on the psychometric properties of measures commonly used in the fields of TDV, sexual harassment, and bullying among boys and girls. Despite the accelerated growth of these respective fields, no previous study has investigated measurement invariance on TDV measures, sexual harassment, or bullying measures in the United States.
variances are due to group (e.g., gender) differences on the latent factor itself (e.g., physical TDV perpetration). Therefore, a reasonable inference is that all of these measures are performing consistently for girls and for boys, i.e., that girls and boys perceive and respond to the items similarly, with no differences in factor loadings, intercepts, or unique variances attributable to gender.
Bullying perpetration demonstrated the next most stringent test of invariance by gender. The bullying measure achieved partial strict invariance, suggesting scale items performed equivalently for girls and boys with the exception of one item: “left someone out from your group of friends.” However, this one item did achieve metric/scalar invariance, which is acceptable for measurement purposes.
Electronic TDV perpetration, on the other hand, did not achieve strict invariance. Because of the exacting nature that strict invariance’s namesake implies, it is an ideal not often achieved. For this reason, achieving scalar invariance is acceptable for measurement purposes. This measure achieved configural and metric/scalar invariance. Therefore, comparisons and analyses of scores are acceptable and yield meaningful interpretations.
CHAPTER 4: TEEN DATING VIOLENCE, SEXUAL HARASSMENT, AND BULLYING AMONG MIDDLE SCHOOL STUDENTS: EXAMINING MEDIATION AND
MODERATED MEDIATION BY GENDER (MANUSCRIPT #2)
Introduction
Although theoretically and methodologically sound teen dating violence (TDV) research has markedly increased over the last few years, few well-designed longitudinal TDV studies existed until recently (for a review, see Foshee & Matthew, 2007). Consequently, TDV
prevention programs—including the Start Strong initiative (2008–2012) from which this study’s data are drawn—have been largely informed by cross-sectional data to identify risk factors and appropriate intervention targets. The need for longitudinal research to assess temporality and consequences of TDV remains. This study uses longitudinal data to investigate the
developmental pathway(s) among three forms of aggression: perpetration of bullying, sexual harassment, and dating violence among adolescents in middle school. Specifically, this study seeks to determine whether sexual harassment mediates the relationship between bullying and TDV and whether these relationships vary by gender.
sexual harassment prevention programming into existing TDV evidence-based prevention programming to reduce TDV. Examining this developmental pathway, including whether they vary by gender, will better position program developers and practitioners to more precisely target and intervene in peer aggression behaviors predictive of TDV earlier, thereby arresting the developmental pathway leading to TDV itself and also preventing the negative outcomes resulting from TDV.
Conceptual Framework for Examining the Pathway among Bullying, Sexual Harassment,
and Dating Violence
An Integrated Approach to Examining Dyadic Aggression
As Ozer et al. (2004) aptly note, research on bullying, sexual harassment, and dating violence among adolescents has largely been conducted in separate literatures. Advancing youth violence prevention requires a more sophisticated reckoning with aggressive behaviors. The question of whether aggressive behavior persists across various relationships and contexts—that is, whether and when certain types of aggressive behaviors (e.g., bullying) overlap with other types of aggressive behaviors (e.g., sexual harassment), as well as whether and when different types of aggressive behaviors share risk factors—is central to understanding aggression among youth. Increasing this understanding will advance the development of effective youth violence prevention programs—which tend to focus on bullying, sexual harassment, or dating violence— by integrating a more sophisticated, integrated approach to youth violence prevention
programming.
A Developmental Life Span Perspective on Aggression: Bullying, Sexual Harassment,
to sexual harassment to TDV. A developmental lifespan perspective is useful when considering the context of aggressive behavior in early adolescence and to understand the interconnections among bullying, sexual harassment, and dating violence. As children transition into adolescence, aggressive behaviors may transform as young teens are faced with new age-relevant challenges (Pepler et al., 2006). A number of defining social processes shift during the transition to early adolescence, including the composition of peer groups, emerging romantic interests, and changing norms that support problem behaviors (Miller et al., 2013).
Early adolescence and transition to middle school bring major changes in social
affiliations. Previously established peer groups become destabilized as children move from fairly structured, small elementary school settings to larger, more impersonal middle school
environments (Pellegrini & Bartini, 2001). At the same time, and with the onset of puberty, the gender-segregated childhood peer groups gradually shift to mixed-gender groups (Connolly, Pepler, Craig, & Tardash, 2000). Early dating emerges from these mixed-gender groups as youth explore budding romantic interests. Young adolescents in particular are concerned with how attractive they are and how mixed-gender forays will be perceived by their peers (Jones & Crawford, 2006). Moreover, puberty heightens vulnerability around sexuality and romantic interests.
Also changing in the transition to early adolescence are norms surrounding aggression. As youth enter adolescence, aggressive behaviors are increasingly linked with enhanced social status among peers (Cillessen & Mayeux, 2004). Compared with earlier childhood, aggressive
mixed-gender groups where aggressive behaviors are seen as a desired asset that enhances power and status. Young adolescents may view aggression positively as these behaviors serve the function of asserting power and control within social hierarchies.
In this context, bullying, sexual harassment, and TDV can be viewed as developmentally relevant aggression that is tied to pubertal development and social transitions in early
adolescence (Pepler et al., 2006). Within a developmental framework, adolescents may first exert power and control during early adolescence by bullying their peers. As they become increasingly engaged in mixed-gender groups and interested in dating, adolescents may generalize “power-over” aggression to other forms of relationship aggression, including sexual harassment and TDV (Pepler et al., 2006).
Consistent with Pepler et al. (2006), the premise of this proposed study is that the combined use of power and aggression inherent in bullying drives other developmentally relevant expressions of aggression that occur in relationships during a lifetime, including sexual harassment, dating violence, workplace harassment, marital aggression, and elder abuse (Pepler, Craig, & Connolly, 1997). Moffitt’s (1993) concept of heterotypicality also lends conceptual backing for said premise, suggesting that the inclination to use myriad forms of aggression changes as a function of age-relevant capacities and emergent developmental issues. This study specifically intends to determine whether adolescents’ enactment of different forms of