M. Wijzenbroek and G. J. Kroes
Citation: The Journal of Chemical Physics 140, 084702 (2014); doi: 10.1063/1.4865946 View online: http://dx.doi.org/10.1063/1.4865946
View Table of Contents: http://scitation.aip.org/content/aip/journal/jcp/140/8?ver=pdfcov Published by the AIP Publishing
Articles you may be interested in
Enhanced selectivity towards O2 and H2 dissociation on ultrathin Cu films on Ru(0001) J. Chem. Phys. 137, 074706 (2012); 10.1063/1.4746942
The role of exchange-correlation functionals in the potential energy surface and dynamics of N 2 dissociation on W surfaces
J. Chem. Phys. 128, 154704 (2008); 10.1063/1.2897757
Seven-dimensional microcanonical treatment of hydrogen dissociation dynamics on Cu(111): Clarifying the essential role of surface phonons
J. Chem. Phys. 125, 024704 (2006); 10.1063/1.2208362
The reaction rate for dissociative adsorption of N 2 on stepped Ru(0001): Six-dimensional quantum calculations J. Chem. Phys. 122, 234702 (2005); 10.1063/1.1927513
The effect of the exchange-correlation functional on H
2dissociation on Ru(0001)
M. Wijzenbroek and G. J. Kroes
Leiden Institute of Chemistry, Gorlaeus Laboratories, Leiden University, P.O. Box 9502, 2300 RA, Leiden, The Netherlands
(Received 25 November 2013; accepted 4 February 2014; published online 25 February 2014)
The specific reaction parameter (SRP) approach to density functional theory (DFT) has enabled a chemically accurate description of reactive scattering experiments for activated H2–metal systems
(H2+Cu(111) and Cu(100)), but its application has not yet resulted in a similarly accurate
descrip-tion of non-activated or weakly activated H2-metal systems. In this study, the effect of the choice of
the exchange-correlation functional in DFT on the potential energy surface and dynamics of H2
disso-ciation on Ru(0001), a weakly activated system, is investigated. In total, full potential energy surfaces were calculated for over 20 different functionals. The functionals investigated include functionals in-corporating an approximate description of the van der Waals dispersion in the correlation functional (vdW-DF and vdW-DF2 functionals), as well as the revTPSS meta-GGA. With two of the functionals investigated here, which include vdW-DF and vdW-DF2 correlation, it has been possible to accu-rately reproduce molecular beam experiments on sticking of H2and D2, as these functionals yield a
reaction probability curve with an appropriate energy width. Diffraction probabilities computed with these two functionals are however too high compared to experimental diffraction probabilities, which are extrapolated from surface temperatures (Ts)≥500 K to 0 K using a Debye–Waller model. Further
research is needed to establish whether this constitutes a failure of the two candidate SRP function-als or a failure of the Debye–Waller model, the use of which can perhaps in future be avoided by performing calculations that include the effect of surface atom displacement or motion, and thereby of the experimentalTs.© 2014 AIP Publishing LLC. [http://dx.doi.org/10.1063/1.4865946]
I. INTRODUCTION
To perform accurate dynamics calculations on molecule– surface reactions, such as the dissociation of small molecules on metal surfaces, accurate potential energy surfaces (PESs) are needed. Due to the large, delocalized nature of these systems, electronic structure calculations on such systems are computationally expensive. Efficient electronic structure methods are therefore needed if one wishes to study such a system in detail.
For molecule–surface reactions, one is limited to an electronic structure method with a favourable computational scaling, which in practice means density functional the-ory (DFT)1,2 using an approximate exchange-correlation (XC) functional on the generalized gradient approximation (GGA)3,4level. As of yet, it is not quantitatively known how large the error of using such an approximate XC functional is for barrier heights of molecule–surface reactions. Such stud-ies have been performed for gas-phase reactions,5,6 but re-main challenging for molecule–surface reactions because of the lack of benchmark databases available for these systems. For chemisorption energies a database of experimental values is available,7 but for barrier heights no such databases exist. Perhaps the closest one can get to such a database is a recently started database of molecule–surface barrier heights.8,9 This database, however, is based on DFT calculations using the RPBE10 functional, and can as such not be used to estimate the error made by the use of DFT in general.
For molecule–surface interactions, additional complica-tions arise because also the surface introduces many ad-ditional degrees of freedom: energy exchange is possible with surface phonons and electron-hole pair excitations are possible.11–13For H
2dissociation on metal surfaces, these
ef-fects can however be mostly avoided. Energy exchange with surface phonons may be expected to be a small effect14due to the large mass mismatch between the H2molecule and a
sur-face atom. It has furthermore been argued that electron-hole pair excitation should only have a small effect on H2–surface
reactions.15These effects are discussed further in Sec.II A. For dissociation of H2on Cu(111), an activated late
bar-rier molecule–surface reaction, it has been shown that nei-ther of two popular XC functionals in the surface science community, the PW9116 and the RPBE10 functionals, could give a good agreement with experiment.17,18 By employing a “specific reaction parameter” (SRP)19 approach adapted to molecule–surface reactions,17,18 a good agreement could be obtained with a broad range of reaction and scattering experi-ments. The functional that was obtained as a result of the SRP procedure for H2on Cu(111) was also found to work well for
H2 on Cu(100).20 In the SRP procedure previously used for
H2on Cu(111), a parameter (α) mixing two functionals by
ESRP=α·Ea+(1−α)·Eb, (1)
where Ea and Eb are the XC energies obtained from the two functionals, was fitted in such a way that the reaction
0021-9606/2014/140(8)/084702/17/$30.00 140, 084702-1 © 2014 AIP Publishing LLC
probability obtained from the SRP (mixed) functional matched the values measured in molecular beam experiments. As a result of this fitting procedure, the functional provides a reasonable description of the barrier height for reaction.17The test of a SRP functional is that it should also yield a good de-scription of other observables than the one it was fitted to for the system investigated. It should be pointed out however that it is possible that one particular functional can already yield a good description of the ongoing processes, and as such the mixing procedure may not be needed.
It is currently not clear to what extent such a procedure is valid for weakly activated early barrier molecule–surface reactions. H2dissociation on Ru(0001) is an example of such
an early barrier molecule–surface reaction. This reaction is also of catalytic importance, as ruthenium-based catalysts can be used to catalyse the production of ammonia from H2 and
N2,21–25and the dissociation of H2on ruthenium is one of the
elementary steps in this process. Although the dissociation of N2on ruthenium is thought to be the rate determining step in
this process,26,27it is nonetheless important to have a detailed understanding of the other steps.
Previously, PESs were constructed for H2dissociation on
Ru(0001),28 and quantum dynamics calculations have been performed29,30to compare two DFT XC functionals, PW9116 and RPBE,10 with each other. Comparisons have also been made to experimental molecular beam studies on dissociative adsorption31as well as diffractive scattering.30The results of the comparison with experiments showed that neither func-tional could properly describe reaction over the entire inter-val of incidence energy, in the sense that the calculated reac-tion probability curve as a funcreac-tion of incidence energy was too narrow compared to the experimental curve, suggesting the energetic corrugation of the used potential energy sur-faces to be too small.30,31 The same semi-empirical mixture of these two functionals as the one which worked well for H2dissociation on Cu(111)17,18 was also not able to describe
the reaction probability of H2 on Ru(0001) over the entire
range of incidence energies. Additionally, calculated diffrac-tion probabilities were generally (somewhat) higher than the experimental diffraction probabilities. This discrepancy was attributed to the used XC functionals.30It was argued that the van der Waals interaction, which is not taken into account in the usual (semi-)local XC functionals,32,33 could be impor-tant for an early barrier system such as H2 dissociation on
Ru(0001). To our knowledge, so far no studies exist in which the van der Waals interaction has been taken into account ex-plicitly in dynamics calculations on H2dissociation on metal
surfaces. Furthermore, in calculations on H2 on Ru(0001) in
which electron-hole pair excitations were incorporated by the use of electronic friction coefficients, the width of the reaction probability curve was found to be influenced only weakly by electronic friction.34
In the present work, an extensive study of XC functionals for H2 dissociation on Ru(0001) is reported. The goal of the
present work is twofold: first, to determine whether improved XC functionals, such as van der Waals-corrected functionals or meta-GGA functionals, can lead to an improved descrip-tion of this system, and second, to obtain a SRP funcdescrip-tional which is able to describe this system. To achieve this,
poten-tial energy surfaces were constructed for H2on Ru(0001)
us-ing more than 20 different XC functionals. Barrier heights for reaction are analysed and from this analysis, and based on reaction probabilities obtained from quasi-classical dynamics calculations, interesting functionals are identified. Quantum dynamics calculations are performed for the functionals giv-ing the best description of reaction to compare with diffrac-tion experiments.
In Sec.II, the methods used are explained, starting with the dynamical model and dynamics methods in Sec. II A. The construction of potential energy surfaces is discussed in
Sec.II B. SectionII Cfocuses on the calculation of
observ-ables. In Sec. II D, the computational details are given. In
Sec. III, the results of the calculations are shown and
dis-cussed, starting with an overview of the constructed potential energy surfaces in Sec. III A. State-resolved reaction prob-abilities and rotational quadrupole alignment parameters are discussed in Sec. III Band simulations of molecular beam sticking experiments are discussed in Sec.III C. Diffractive scattering and reaction at off-normal incidence are discussed in Sec.III D. Finally, in Sec.IV, the conclusions are given.
II. THEORY
A. Dynamical model
Both quantum dynamics and quasi-classical dynamics calculations have been performed. For all calculations, the Born-Oppenheimer Static Surface (BOSS) model is used. In the BOSS model, two approximations are made. First of all, the Born-Oppenheimer approximation35 is made. Second, a static surface approximation is made, in which the surface atoms are assumed to be fixed at their ideal lattice posi-tions, and therefore, only the 6 degrees of freedom of the H2
molecule are taken into account in the dynamics. The coordi-nate system used is shown in Figure1(a).
The use of these approximations for H2/metal surface
scattering is supported by previous work. For H2
dissoci-ation on Pt(111) it has previously been argued that non-adiabatic effects should not play an important role, for
(a) (b)
FIG. 1. (a) The center of mass coordinate system used for the description of the H2molecule. (b) The surface unit cell and the sites considered. The origin
reasons that are generic to H2/metal systems.15Non-adiabatic
effects have been incorporated in calculations on H2
disso-ciation on Cu(111),36,37 Cu(110),38 and Ru(0001),34 using electronic friction. No large non-adiabatic effects were found in these dynamics calculations, suggesting that the Born-Oppenheimer approximation works well for these systems.
The validity of the static surface approximation has been tested recently for H2dissociation on Cu(111) usingab initio
molecular dynamics (AIMD) calculations,39in which surface atoms in 3 layers of a 2×2 unit cell were allowed to move, and static corrugation model (SCM) calculations,40which ex-cluded energy exchange with the surface but inex-cluded the dis-placement of surface atoms and surface expansion effects. In these studies, good agreement was found between static sur-face calculations and calculations at the experimental sursur-face temperature (Ts=120 K). These calculations suggested
ther-mal expansion of the surface to be important, which has been tested recently.41
For H2 dissociation on Ru(0001), the neglect of surface
temperature is not expected to have a big effect. The impor-tance of energy exchange is not expected to be large. Due to the large mass mismatch between a H2 molecule and a
sur-face atom, motion of the H2molecule and the surface atoms
should only be weakly coupled, i.e., the effect of energy ex-change should be small. The effect of the static displacement of surface atoms is also expected to be small. This is because H2 dissociation on Ru(0001) is an early barrier system: the
barriers are located far from the surface, therefore the cou-pling between the H2 molecule located at the barrier and the
closest surface atoms should be small. Finally, also thermal expansion is expected to be a rather small effect. Bulk ruthe-nium expands by about 0.24% inaand 0.36% incfrom 0 K to 500 K.42The first interlayer spacingd12contracts slightly
with increasing surface temperature.43It should be noted that the surface temperature used in the diffraction experiments (Ts=500 K30) is somewhat higher than the surface
tempera-ture used in the molecular beam experiments (Ts=180 K31),
which suggests that if surface temperature does play a role it would do so predominantly in the diffraction experiments.
1. Quantum dynamics
For the quantum dynamics calculations, a time-dependent wave packet (TDWP)44,45 method was used. To represent the wave packet in Z,r,X, andY, a discrete vari-able representation (DVR)46 was used, and to represent the wave packet in the angular degrees of freedom, a finite base representation (FBR)47,48 was used. To transform the wave function from the FBR space to the DVR space, and vice versa, Fast Fourier transforms49 and discrete associated Gauss–Legendre transforms47,48were used. To propagate the wave packet according to the time dependent Schrödinger equation, the split operator method50is used. The initial wave packet is placed far away from the surface, where only a neg-ligibly small interaction is present, and is written as a product of a Gaussian wave packet for motion perpendicular to the surface, plane waves for motion parallel to the surface and a rovibrational wavefunction describing the initial state of the
molecule.45 The reflected wave packet is analysed using the scattering amplitude formalism51–53 atZ =Z∞, yielding S-matrix elements for state-to-state scattering. For large r or Z, optical potentials54 are used to absorb the reacted (r) or analysed (Z) wave packet. Scattering probabilities were ob-tained from S-matrix elements over the entire range of ener-gies present in the wave packet. The fully initial state-resolved reaction probability is defined as
Pr(v, J, mJ)
=1−
v,J,mJ, n,m
Pscat(v, J, mJ →v, J, mJ, n, m), (2)
wherePscat(v, J, mJ →v, J, mJ, n, m) are the state to state scattering probabilities, v (v),J(J),mJ(mJ) the initial (fi-nal) vibrational, rotational, and magnetic rotational quantum numbers, respectively, andnandmthe quantum numbers for diffraction.
2. Quasi-classical dynamics
In the quasi-classical dynamics55calculations, the Hamil-ton equations of motion were integrated with the predictor-corrector method of Bulirsch and Stoer.56 The initial condi-tions of the H2molecules are selected using standard Monte
Carlo methods. To obtainmJresolved reaction probabilities, the initial angular momentum of the molecule is fixed by L=√J(J+1)¯and its orientation is chosen randomly with the constraint cosϑL=mJ/
√
J(J+1), whereϑLis the an-gle between the angular momentum vector and the surface normal. At each point on a reaction probability curve, to get accurate results, at least 104trajectories were computed. The H2 molecule was initially placed at Z=9 Å. The molecule
was considered to have dissociated whenr>2.25 Å.
B. Construction of potential energy surfaces
Full six-dimensional (6D) PESs were constructed from self-consistent DFT calculations with various XC function-als. To construct a PES, a number of DFT calculations are performed. First, to obtain the lattice constantsaandcto use for ruthenium, a bulk HCP unit cell containing two atoms was set up. This unit cell was relaxed, during which the size and shape of the unit cell was allowed to change. Second, to obtain the structure of the slab to use, a slab was set up with a struc-ture resembling the bulk strucstruc-ture obtained in the first step, after which the positions of the atoms were allowed to relax in the direction perpendicular to the slab. Finally, to map out the molecule–surface interaction on various sites in the Ru(0001) surface unit cell, a H2molecule was added to the unit cell
ob-tained in the second step, and a large number of single point calculations were carried out with the H2molecule in various
geometries.
To interpolate the results from the single point cal-culations, the corrugation reducing procedure (CRP) was
used.57,58In the CRP, the PES is written as
V6D(r)=I6D(r)+
2
i
Vi3D(ri), (3)
in whichV6D is the full 6D PES of the H
2/surface system,
r is a vector representing the coordinates of the H2molecule
with respect to the surface, I6D is the so-called 6D
interpo-lation function of the H2/surface system, Vi3D is the three-dimensional (3D) PES of the H/surface system, and ri is a vector representing the coordinates of the ith H atom with respect to the surface. To interpolate the 3D PES of the H/surface system the CRP is applied again using
Vi3D(ri)=Ii3D(ri)+ N
j
V1D(Rij), (4)
in whichIi3D is the 3D interpolation function describing the H/surface system, Nis the number of surface atoms to take into account in the summation,V1Dis a one-dimensional (1D) function mimicking the interaction of a hydrogen atom and a single surface atom andRijis the distance between the hydro-gen atomiand surface atomj. It should be noted at this point that a goodV1Dfunction reduces the corrugation inI3D, but
the choice of this function is somewhat arbitrary.57
In the interpolation a 60◦ skewed coordinate system (u,v) is used (see also Figure1(b)). In the discussion below this (u,v) coordinate system is assumed to be scaled such that the closest surface atom-surface atom distance within a layer is unity. The CRP allows for a much smoother interpolation of the PES than a direct interpolation, because the 6D interpo-lation functionI6Dis much less corrugated in theu,v,θ, and φdegrees of freedom thanV6D.57
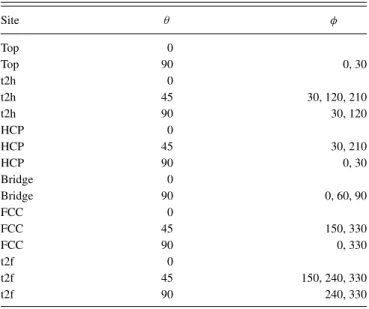
For the interpolation ofI6D, a total of 29 configurations (u,v,θ,φ) are used, spread over 6 different sites (u,v) (see also Figure1(b)). The used configurations have been listed in TableI. The interpolation is done in several steps, similar to
TABLE I. Configurations used in the interpolation of H2/Ru(0001) PES.
The sites listed here correspond to the sites listed in TableII, and are also shown graphically in Figure1.
Site θ φ
Top 0
Top 90 0, 30
t2h 0
t2h 45 30, 120, 210
t2h 90 30, 120
HCP 0
HCP 45 30, 210
HCP 90 0, 30
Bridge 0
Bridge 90 0, 60, 90
FCC 0
FCC 45 150, 330
FCC 90 0, 330
t2f 0
t2f 45 150, 240, 330
t2f 90 240, 330
TABLE II. Sites used in the interpolation of the H/Ru(0001) PES.
Site u v
Top 0 0
Bridge 1/2 0
HCP 1/3 1/3
t2h 1/6 1/6
1/3 1/6
τ 1/6 0
η 1/3 0
t2f 1/3 −1/6
1/2 −1/6
FCC 2/3 −1/3
the method used for H2/Cu(100) by Olsenet al.58 First, for
every configuration, the interpolation over therandZdegrees of freedom is performed. This interpolation is performed over a 14×15 (r ×Z) grid using a two-dimensional (2D) cubic spline interpolation. Then, on every site, the interpolation is performed over theθandφdegrees of freedom using symme-try adapted sine and cosine functions. Finally, the interpola-tion overuandvis performed, again using symmetry adapted sine and cosine functions.
For the interpolation of I3D, a total of 10 sites in (u,v)
are used. The used configurations have been listed in Table II. The interpolation is performed in two steps. First, for every site, a 1D cubic spline interpolation over 57 points inZis performed. Then the interpolation over theuandv de-grees of freedom is performed, using symmetry adapted sine and cosine functions. ForV1D, the spline interpolation of the interaction of the H atom above the top site is used, similar to previous studies.57
FromZ=3.4 Å toZ=4 Å, the PES is switched from the fullV6Dto a 2D gas phase interactionV2D, as the dependence
on the other degrees of freedom far away from the surface is small. This gas phase potential is given by
V2D(r, Z)=Vext(Z)+Vgas(r), (5)
whereVextis a function describing the dependence of the PES
onZbeyondZ=4 Å andVgasis the interaction atZ=Z max.
In the present work, these functions are represented by 1D cubic splines, withZmaxtaken to be 6 Å.
C. Calculation of observables
1. Initial state-resolved reaction probability
Degeneracy averaged reaction probabilities Pdeg were
computed by
Pdeg(v, J)= J
mJ=0
2−δmJ0
Pr(v, J, mJ)/(2J+1), (6)
2. Rotational quadrupole alignment
The rotational quadrupole alignment parameter is a mea-sure of the dependence of the reaction on the orientation of the molecule with respect to the surface. It can be written as
A(2)0 = 3 cos2ϑL−1, (7)
in whichϑLis the angle between the angular momentum vec-tor and the surface normal. It can also be computed as59
A(2)0 (v, J)=
mJPr(v, J, mJ)
3m2 J J(J+1)−1
mJPr(v, J, mJ)
. (8)
3. Molecular beams
Molecular beams used in experiments do generally not consist of molecules in a single state with one particular in-cidence energy. To compare with the molecular beams used in experiments,31 two things have to be taken into account. First, the state-resolved reaction probabilities should be aver-aged over the rovibrational states populated in the molecular beam. Second, the experimental spread of incidence energies should be taken into account. The first point is addressed by
Rmono(Ei;Tn)=
v,J
FB(v, J;Tn)Pdeg(Ei, v, J), (9)
in whichRmonois the mono-energetic reaction probability
av-eraged over all states present in the molecular beam with a nozzle temperatureTn. The reaction probability of each state is weighed with the Boltzmann factor
FB(v, J;Tn)=
w(J)F(v, J;Tn)
v,J≡J (mod 2)
F(v, J;Tn)
(10)
with
F(v, J;Tn)=(2J+1) exp (−Evib(v, J)/(kBTn))
·exp (−Erot(v, J)/(0.8·kBTn)). (11)
In Eq.(10), the summation runs only over the values ofJ which have the same parity asJ.kBis the Boltzmann constant andEvibandErotare the vibrational and rotational energy,
re-spectively, of the (v,J) state. In these equations, it is assumed that the rotational temperature of the molecules in the beam is lower than the nozzle temperature (Trot =0.8 · Tn).60 In
the research reported below it is also assumed that the ratio of ortho- and para-H2or D2is equivalent to the high temperature
limit, given byw(J), which is the case in experiments, as the gas cylinder is stored at room temperature and conversion of ortho- and para-hydrogen does not happen on the time scale of the experiment. For H2,w(J) is equal to 1/4 for evenJand
3/4 for oddJ. For D2 it is equal to 2/3 for evenJand 1/3 for
oddJ.
The mono-energetic reaction probability then has to be averaged over the translational energy distribution by18
Rbeam= ∞
0 f(vi;Tn)Rmono(Ei;Tn)dvi
∞
0 f(vi;Tn)dvi
. (12)
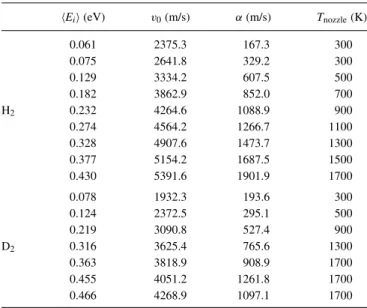
TABLE III. Parameters used for the molecular beam simulations of H2and
D2on Ru(0001). The parameters were obtained from fits of Eq.(14)to the
experimental time of flight spectra.63
Ei(eV) v0(m/s) α(m/s) Tnozzle(K)
0.061 2375.3 167.3 300
0.075 2641.8 329.2 300
0.129 3334.2 607.5 500
0.182 3862.9 852.0 700
H2 0.232 4264.6 1088.9 900
0.274 4564.2 1266.7 1100 0.328 4907.6 1473.7 1300 0.377 5154.2 1687.5 1500 0.430 5391.6 1901.9 1700
0.078 1932.3 193.6 300
0.124 2372.5 295.1 500
0.219 3090.8 527.4 900
D2 0.316 3625.4 765.6 1300
0.363 3818.9 908.9 1700 0.455 4051.2 1261.8 1700 0.466 4268.9 1097.1 1700
Herefis the flux weighted velocity distribution, which is given by61,62
f(vi;Tn)dvi =Cvi3exp[−(vi−v0)2/α2]dvi. (13)
In this equationCis a constant,vi is the velocity of the molecule,v0is the stream velocity, andαis a parameter
de-scribing the width of the velocity distribution. The parame-ters for the H2 and D2 beams of Grootet al.31 are shown in
TableIII. These parameters were obtained by fitting
G(t;Tn)=c1+c2v4exp[−(vi−v0)2/α2] (14)
to the experimental time of flight spectra.63 It is noted here that the parameters describing the H2molecular beam differ
somewhat from the parameters presented earlier,30as an error was made in the analysis of the TOF measurements.63
4. Diffraction probabilities
To compare with the experimental diffraction probabilities,30 first rovibrationally elastic diffraction probabilities were computed by
Pnm(v, J, mJ)
= J
mJ=0
((2−δmJ0)
·Pscat(v, J, mJ →v=v, J=J, mJ, n, m)), (15)
wherePnmis the rovibrationally elastic probability for scatter-ing into the diffraction state denoted by thenandmquantum numbers. These probabilities are then degeneracy averaged by
Pnm(v, J)= J
mJ=0
(2−δmJ0)Pnm(v, J, mJ)/(2J+1). (16)
Because in experiments mostlyJ=0 andJ=1 H2were
present with a narrow energy distribution,30,64 in particular
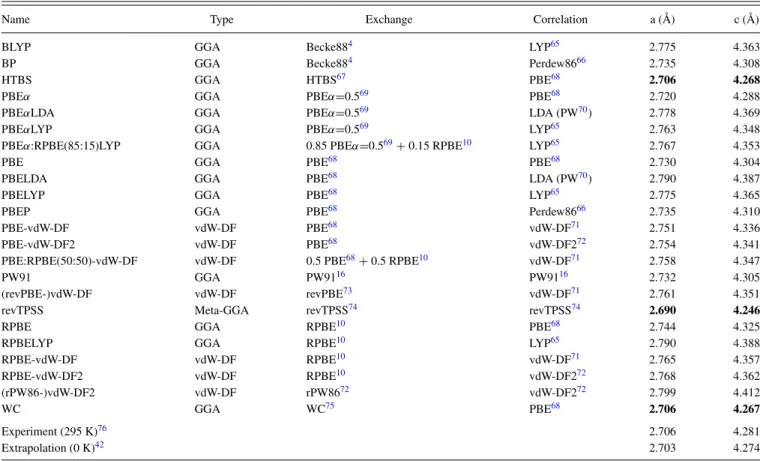
TABLE IV. The exchange-correlation functionals used in this work. Also shown are the lattice constants obtained for ruthenium (best matches shown in bold typeface).
Name Type Exchange Correlation a (Å) c (Å)
BLYP GGA Becke884 LYP65 2.775 4.363
BP GGA Becke884 Perdew8666 2.735 4.308
HTBS GGA HTBS67 PBE68 2.706 4.268
PBEα GGA PBEα=0.569 PBE68 2.720 4.288
PBEαLDA GGA PBEα=0.569 LDA (PW70) 2.778 4.369
PBEαLYP GGA PBEα=0.569 LYP65 2.763 4.348
PBEα:RPBE(85:15)LYP GGA 0.85 PBEα=0.569+0.15 RPBE10 LYP65 2.767 4.353
PBE GGA PBE68 PBE68 2.730 4.304
PBELDA GGA PBE68 LDA (PW70) 2.790 4.387
PBELYP GGA PBE68 LYP65 2.775 4.365
PBEP GGA PBE68 Perdew8666 2.735 4.310
PBE-vdW-DF vdW-DF PBE68 vdW-DF71 2.751 4.336
PBE-vdW-DF2 vdW-DF PBE68 vdW-DF272 2.754 4.341
PBE:RPBE(50:50)-vdW-DF vdW-DF 0.5 PBE68+0.5 RPBE10 vdW-DF71 2.758 4.347
PW91 GGA PW9116 PW9116 2.732 4.305
(revPBE-)vdW-DF vdW-DF revPBE73 vdW-DF71 2.761 4.351
revTPSS Meta-GGA revTPSS74 revTPSS74 2.690 4.246
RPBE GGA RPBE10 PBE68 2.744 4.325
RPBELYP GGA RPBE10 LYP65 2.790 4.388
RPBE-vdW-DF vdW-DF RPBE10 vdW-DF71 2.765 4.357
RPBE-vdW-DF2 vdW-DF RPBE10 vdW-DF272 2.768 4.362
(rPW86-)vdW-DF2 vdW-DF rPW8672 vdW-DF272 2.799 4.412
WC GGA WC75 PBE68 2.706 4.267
Experiment (295 K)76 2.706 4.281
Extrapolation (0 K)42 2.703 4.274
at the lowest incidence energies, a reasonable approximation should be the use of a beam of cold n-H2 (25%J=0, 75% J=1) with a monochromatic energy. In the calculations per-formed here this approximation is made.
D. Computational details
For the electronic structure calculations VASP77–79 (version 5.2.12) was used. To allow the use of XC functionals not present in VASP, the LibXC80 library (version 1.2.0) has been used.
Potential energy surfaces have been constructed for a wide range of XC functionals. The functionals used are listed in Table IV. For the GGA functionals, except for the PBELDA and PBEαLDA functionals, the standard81 VASP ultrasoft pseudopotentials82were used. For all other function-als, PAW83 potentials84 were used. The vdW-DF function-als were evaluated within the scheme of Román-Pérez and Soler.85
Tests were performed on the bulk system and the molecule–surface system to find ak-point sampling and plane wave cutoff yielding converged results. The convergence was found to be nearly independent of the XC functional, although for vdW-DF functionals the convergence was somewhat less good, but still good enough. For this reason, as well as consis-tency, thek-point sampling and plane wave cutoff were cho-sen to be equal for all functionals. For the bulk calculations, a 20×20×20-centered Monkhorst-Pack grid was used with a plane wave cutoff of 450 eV. For the slab calculations, a 20×20×1 -centered Monkhorst-Pack grid was used with
the same plane wave cutoff. For the single point calculations to determine the molecule–surface interaction, a 8×8×1 -centered Monkhorst-Pack grid was used with a plane wave cutoff of 350 eV. A 2×2 supercell with a vacuum of 13 Å between images of the slab was used. For all calculations, to speed up convergence, Fermi smearing was used with a width of 0.1 eV. Finally, in all calculations a five-layer slab was considered. Convergence tests with respect to the num-ber of layers for two geometries close to the transition state for the top(θ = 90◦,φ =0◦) and hcp(θ =90◦, φ = 30◦) configurations, showed that for a range of GGA functionals the difference between using a five- and seven-layer slab was on average about 5 meV for the top to bridge case and about 10 meV for the hcp case. This error was found to not depend much on the chosen XC functional.
For the quantum dynamics calculations on reaction at normal incidence, two wave packets with different energy ranges were propagated. The lower energy range was taken from 40 meV to 200 meV, the high energy range from 150 meV to 600 meV. For calculations on diffraction at off-normal incidence however, only the lower energy range was calculated. Convergence tests indicated that the same param-eters could be used for all calculations. The paramparam-eters used are shown in TableV.
III. RESULTS AND DISCUSSION
A. Potential energy surfaces
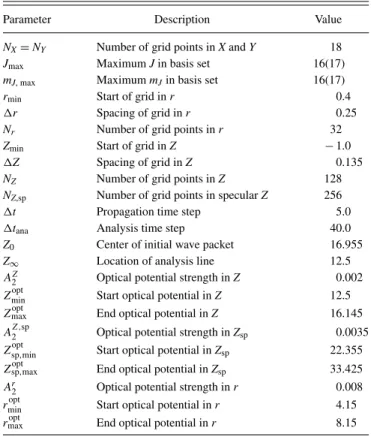
TABLE V. Parameters for quantum dynamics calculations on H2
dissocia-tion and scattering from Ru(0001). Values for odd values ofJ, where differ-ent, are listed in parentheses. All values are in atomic units.
Parameter Description Value
NX=NY Number of grid points inXandY 18 Jmax MaximumJin basis set 16(17)
mJ, max MaximummJin basis set 16(17) rmin Start of grid inr 0.4
r Spacing of grid inr 0.25
Nr Number of grid points inr 32 Zmin Start of grid inZ −1.0
Z Spacing of grid inZ 0.135 NZ Number of grid points inZ 128 NZ,sp Number of grid points in specularZ 256
t Propagation time step 5.0
tana Analysis time step 40.0
Z0 Center of initial wave packet 16.955
Z∞ Location of analysis line 12.5
AZ
2 Optical potential strength inZ 0.002
Zoptmin Start optical potential inZ 12.5
Zoptmax End optical potential inZ 16.145
AZ,2 sp Optical potential strength inZsp 0.0035
Zoptsp,min Start optical potential inZsp 22.355
Zoptsp,max End optical potential inZsp 33.425
Ar
2 Optical potential strength inr 0.008
rminopt Start optical potential inr 4.15
rmaxopt End optical potential inr 8.15
paper. It is nonetheless important, however, to highlight sev-eral features of the created PESs, thereby extending the pre-vious analysis by Luppiet al.28
Contour plots of all 2D cuts that were used for the con-struction of the PES were made and the transition states on these contour plots were identified. In Figure2, contour plots of several high symmetry configurations are shown, from one of the PESs which was found to give the best description of the molecular beam experiments (see also Sec.III C). Consis-tent with previous calculations,28 the barrier height increases in the order top<t2h/t2f<bridge<hcp/fcc. In most cases, except for the rPW86-vdW-DF2 functional, the hcp barrier was found to be slightly higher (up to 46 meV for the revTPSS functional) than the fcc barrier. It should be emphasized that most of the trends seen in Figure 2 are qualitatively repro-duced by most functionals, but quantitatively (large) differ-ences can be found.
A notable feature of the H2on Ru(0001) PES is the
pres-ence of two transition states on several 2D cuts. On the top site two transition states are found with a well in between. This feature is general for all functionals. This is also, for several functionals, found to be the case for the t2h(θ=90◦, φ =120◦) and t2f(θ =90◦,φ=240◦) configurations. Dif-ferences were found with respect to the relative energy of the early and late transition states present in 2D cuts above the top site. For most exchange-correlation functionals, the early transition state was found to be highest in energy, but for sev-eral others the late transition state was found to be highest in energy. The difference between the two transition state en-ergies (Elate
top −E early
top ) was found to vary between−0.64 eV
0.5 1.0 1.5 2.0 2.5
0.5 1.0 1.5 0.5
1.0 1.5 2.0 2.5 3.0
0.5 1.0 1.5 2.0
r (Å)
Z(
Å
)
bridge = 90°
top = 0°
t2h = 120°
hcp = 30°
FIG. 2. Contour plots of the H2 on Ru(0001) PES for four high
symme-try configurations withθ =90◦, for the PBE-vdW-DF2 functional. Transi-tion states are indicated by (red) crosses, while local minima in the potential are indicated by (blue) plus symbols. The spacing between contour lines is 0.1 eV.
for the WC functional to 0.14 for the rPW86-vdW-DF2 functional. These results suggest that care should be taken with the choice of an exchange-correlation functional, as this could have a drastic influence on the dynamics. Transition state geometries and energies for the geometries depicted in Figure 2 are given in Table VI, for the PBE-vdW-DF2, PBE:RPBE(50:50)-vdW-DF, and PBE functionals. The two vdW-DF functionals, included because they yield the best de-scription of the molecular beam experiments (see Sec.III C), yield similar transition state geometries and energies, and in all cases transition states which are closer to the surface than obtained with the reference PBE functional.
The energetic corrugation has also been considered. The energetic corrugation is defined here as the difference be-tween the hcp(θ=90◦,φ=30◦) transition state energy and the top(θ =90◦,φ =0◦) transition state energy. The ener-getic corrugation of a PES is a useful quantity as it is typically found to correspond to the “width” of the reaction probabil-ity curve for activated dissociation systems.86 By the width, one usually means the range of energies over which the reac-tion probability increases more or less linearly from an onset energy that is close to the reaction threshold to an energy at which the reaction probability starts to plateau. As such, the width of the reaction probability curve is inversely related to the slope of the reaction probability over this energy region, and the slope of the curve is therefore also related to the en-ergetic corrugation of the PES. In this paper, the width of the reaction probability curve is rather loosely defined in this way. In some cases reaction probability curves may be fitted rather well with sigmoidal functions like
S(E)= A
2 1+erf
E−E0
W
, (17)
TABLE VI. Transition state geometries and transition state energies, relative to the gas phase minimum, for the four geometries depicted in Figure2. Where available, both transition states have been indicated. With MIX-vdW-DF the PBE:RPBE(50:50)-MIX-vdW-DF functional is meant.
Parameter Top 1 Top 2 t2h 1 t2h 2 bri hcp
φ 0◦ 0◦ 120◦ 120◦ 90◦ 30◦
ZPBE-vdW−DF2(Å) 2.605 1.557 2.139 1.473 1.858 1.661
ZMIX-vdW−DF(Å) 2.605 1.559 2.122 1.474 1.830 1.646
ZPBE(Å) 2.736 1.544 2.350 . . . 2.069 1.926
rPBE-vdW−DF2(Å) 0.751 1.247 0.771 1.071 0.796 0.857
rMIX-vdW−DF(Å) 0.751 1.249 0.771 1.072 0.799 0.861
rPBE(Å) 0.757 1.251 0.767 . . . 0.785 0.805
EPBE-vdW−DF2(eV) 0.004 −0.073 0.115 0.061 0.276 0.432
EMIX-vdW−DF(eV) 0.004 −0.044 0.125 0.096 0.295 0.459
EPBE(eV) 0.022 −0.366 0.092 . . . 0.198 0.304
as used for instance in Refs.60and87, and in such cases the width has a well-defined meaning and is given by the value of a specific parameter of the fit function (W in the example given, furthermore A is the maximum value of the reaction probability, andE0is the energy at which the reaction
proba-bility becomes half its maximum value).
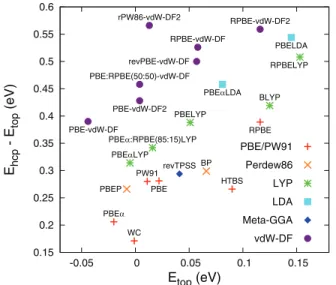
For facilitating a comparison of the energetic corruga-tion between various funccorruga-tionals, in all cases the early tran-sition state energy on the top site was used, even if the late transition state was higher in energy than the early transi-tion state. Luppi et al.previously noted that the PW91 and RPBE functionals showed a large difference in the energetic corrugation.28Figure3, in which the energetic corrugation is plotted against the top to bridge barrier height, shows that the results obtained here support this. A number of features should be pointed out. No very clear overall correlation is found between the lowest barrier height and energetic corru-gation of the potential. Functionals with LYP or LDA corre-lation however show a higher energetic corrugation than the functionals with PBE or Perdew86 correlation, while func-tionals using vdW-DF or vdW-DF2 correlation show an even
0.15 0.2 0.25 0.3 0.35 0.4 0.45 0.5 0.55 0.6
-0.05 0 0.05 0.1 0.15
Ehcp
- E
top
(eV)
Etop (eV)
PBE/PW91
Perdew86
LYP
LDA
Meta-GGA
vdW-DF
BLYP
BP
HTBS
PBEα
PBEαLDA
PBEαLYP
PBE
PBELDA
PBELYP
PBEP PBE-vdW-DF
PBE-vdW-DF2
PW91 revPBE-vdW-DF
revTPSS
RPBE RPBELYP RPBE-vdW-DF
RPBE-vdW-DF2 rPW86-vdW-DF2
PBE:RPBE(50:50)-vdW-DF
WC
PBEα:RPBE(85:15)LYP
FIG. 3. Energetic corrugation of the potential versus lowest barrier height for the constructed potential energy surfaces. The functionals are grouped (symbols) by correlation functional.
higher energetic corrugation. For the functionals considered here, it seems that the energetic corrugation is higher for the functionals which yield a higher top (θ=90◦,φ=0◦) bar-rier height. The functionals within a correlation group (i.e., a group of functionals with the same correlation, as indicated in Figure3by the use of one specific symbol), show a some-what stronger correlation between the top (θ =90◦,φ=0◦) barrier height and the energetic corrugation, in the sense that functionals with a higher top to bridge barrier height mostly give a larger energetic corrugation. Such a trend is especially apparent for functionals incorporating a “PBE-like” exchange functional, namely, the exchange functional sequence PBEα
→PBE→RPBE, but less so for other exchange functionals such as rPW86 or HTBS. It is not fully understood at present why there is an almost linear correlation between the ener-getic corrugation and the minimum barrier height for func-tionals with PBE-like exchange within correlation groups. It is also not completely clear why for H2on Ru(0001) the
ener-getic corrugation varies so strongly with the minimum barrier height. It should, however, be pointed out that this could be related to the rather large difference in distance to the surface (Z) of the top(θ =90◦,φ=0◦) and hcp(θ =90◦,φ=30◦) transition state (also referred to as geometric corrugation28): the top(θ=90◦,φ=0◦) transition state is much further away from the surface than the hcp(θ =90◦,φ=30◦) transition state (see Table VI). For the H2on Cu(111) system, the
ge-ometric corrugation is smaller (all barriers are late and their positions fall between Z =2.2 and 2.6 bohrs), and for this system no large differences in energetic corrugation between PW91 and RPBE were found, while larger differences were found between PW91 and RPBE barrier heights.17,18
−0.06 −0.04 −0.02 0 0.02 0.04 0.06 0.08 0.1 0.12 0.14 0.16
2.25 2.5 2.75 3 3.25
Etop
(eV)
Ztop (Å)
PBE/PW91
Perdew86
LYP
LDA
Meta−GGA
vdW−DF
BLYP
BP HTBS
PBEα:RPBE(85:15)LYPPBE
PBEα PBEαLDA
PBEαLYP PBELDA
PBELYP
PBEP
PBE−vdW−DF PBE−vdW−DF2, PW91 revPBE−vdW−DF revTPSS
RPBE RPBELYP
RPBE−vdW−DF RPBE−vdW−DF2
rPW86−vdW−DF2
PBE:RPBE(50:50)−vdW−DF
WC
FIG. 4. Height of the top to bridge barrier versus position of the top to bridge barrier for the constructed potential energy surfaces. The functionals are grouped (symbols) by correlation functional.
height. This rather large shift can have dramatic effects on the anisotropy or corrugation of the potential barrier which is ex-perienced by the H2molecule. For the functionals considered
here, it seems that the barriers are higher the closer they are to the surface, but it should be noted that the correlation is rather weak.
The lattice constants for ruthenium obtained with vari-ous functionals were compared to experiment.76 Because no experimental data are available for low temperatures, also a comparison is made to an extrapolation of experimental data to 0 K.42 The computed values for the lattice constants are shown in Table IV. It is clear that most functionals over-estimate the lattice constant. Of all the functionals which were tested only the revTPSS, WC, and HTBS functionals yield a lattice constant in reasonable agreement with experi-ment. This is not surprising because the WC functional is a functional created for describing solids,75and the HTBS and revTPSS functionals are functionals created to yield a good description of both solids and molecules67,74at the GGA and meta-GGA level, respectively.
Finally, in Figure5the height of the top to bridge barrier and the energetic corrugation have been plotted against the lattice constant a. There is, as shown in the bottom panel, a rather clear overall correlation between the energetic corruga-tion and the lattice constant, in the sense that funccorruga-tionals giv-ing a higher energetic corrugation also predict a larger lattice constant. In spite of this clear trend, there is still some vari-ation. In particular, the LYP and LDA functionals considered here, as well as the rPW86-vdW-DF2 functional, yield a rel-atively low energetic corrugation for the obtained lattice con-stant. The HTBS and revTPSS functionals yield a relatively high energetic corrugation (similar to the PBE value) for the lattice constants obtained with these functionals. As shown in the top panel of Figure 5, there seems to be no clear over-all correlation between the minimum (top to bridge) barrier height and the lattice constant, although a clearer and near-linear correlation is present for functionals containing
PBE-−0.05 0 0.05 0.1 0.15 0.2 a (Å) Etop (eV) Ehcp − E top (eV) BLYP BP HTBS
PBEα:RPBE(85:15)LYP PBE
PBEα
PBEαLDA
PBEαLYP
PBELDA
PBELYP
PBEP
PBE−vdW−DF PBE−vdW−DF2 PW91
revPBE−vdW−DF revTPSS
RPBE
RPBELYP
RPBE−vdW−DF RPBE−vdW−DF2
rPW86−vdW−DF2 PBE:RPBE(50:50)−vdW−DF
WC 0.15 0.2 0.25 0.3 0.35 0.4 0.45 0.5 0.55
2.68 2.7 2.72 2.74 2.76 2.78 2.8
a (Å) Etop (eV) Ehcp − E top (eV)
PBE/PW91
Perdew86
LYP
LDA
Meta−GGA
vdW−DF
BLYP
BP
HTBS
PBEα:RPBE(85:15)LYP
PBE
PBEα
PBEαLDA
PBEαLYP
PBELDA
PBELYP
PBEP PBE−vdW−DF PBE−vdW−DF2
PW91
revPBE−vdW−DF
revTPSS
RPBE
RPBELYP RPBE−vdW−DF
RPBE−vdW−DF2
rPW86−vdW−DF2
PBE:RPBE(50:50)−vdW−DF
WC
FIG. 5. Height of the top to bridge barrier (top panel) and energetic cor-rugation (bottom panel) versus lattice constant for the constructed poten-tial energy surfaces. The functionals are grouped (symbols) by correlation functional.
like exchange and belonging to the same correlation group, as in Figures 3and4. In fact, this is not so surprising, as a similar correlation has been observed before between the CO adsorption energy on specific metal surfaces and the metal surface energy computed with GGAs88,89 (interestingly, sim-ilar to what is found here, the revTPSS meta-GGA result fell away from the line correlating the CO adsorption en-ergy and the surface enen-ergy89). A correlation would then be expected also between barrier heights and lattice constants because adsorption energies and reaction barrier heights are correlated (as described by the so-called Brønsted–Evans– Polanyi relations90,91), while the metal surface energy and the lattice constant of the metal are both functions of the cohesive strength of the metal.
B. Initial state-resolved reaction and rotational quadrupole alignment
In Figure 6, the initial-state resolved (degeneracy aver-aged) reaction probability Pdeg(Ei;v, J) for H2 dissociating
0 0.2 0.4 0.6 0.8
1
Normal incidence energy (eV)
Reaction pro
b
a
b
ility
PBE-vdW-DF2 (v = 0, J = 0) H2
QCT QD
PBE-vdW-DF2 (v = 0, J = 4) H2
0 0.2 0.4 0.6 0.8
0 0.1 0.2 0.3
PBE:RPBE(50:50)-vdW-DF (v = 0, J = 2) H2
0 0.1 0.2 0.3 0.4
PBE:RPBE(50:50)-vdW-DF (v = 0, J = 8) H2
FIG. 6. Comparison between the initial state-resolved reaction proba-bility calculated with quantum dynamics and quasi-classical trajectory calculations.
on Ru(0001) obtained from quasi-classical trajectories (QCT) is compared to quantum dynamics (QD) calculations for the PBE-vdW-DF2 and PBE:RPBE(50:50)-vdW-DF functionals. At the lowest energies some small oscillations are present in the QD results. In spite of this, the agreement between QCT and QD is found to be excellent, in particular for the higher ro-tational states. This good agreement makes it possible to use QCT instead of QD results for the simulation of molecular beams.
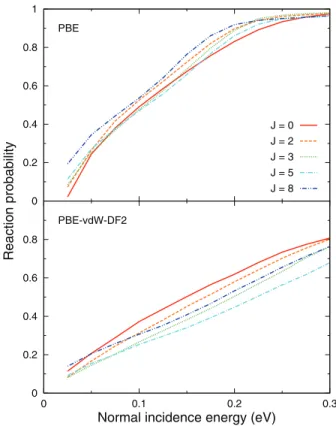
In Figure7, the degeneracy averaged reaction probability for H2dissociating on Ru(0001) obtained from QCT is
com-pared for various initial rovibrational states for the PBE and PBE-vdW-DF2 functionals. It is clear that the PBE-vdW-DF2 functional gives rise to less steep reaction probability curves than the PBE functional. This can be understood from the increased energetic corrugation (see Figure 3) of the poten-tial energy surface. Furthermore, the ordering of the curves is different. With the PBE-vdW-DF2 functional first reac-tion decreases with increasing J up to about J = 5, after which reaction increases again with increasing J. With the PBE functional, reaction first slightly increases with J up to J = 2, then slightly decreases with J up to J = 5, and then increases further with increasingJ. This shows that the PBE and PBE-vdW-DF2 functionals clearly have a differ-ent anisotropy, as the anisotropy of the potdiffer-ential determines the rotational dependence of reaction. The precise feature of the PES responsible for this difference is however not clear and should be considered beyond the scope of this paper. Because the PBE-vdW-DF2 functional gives barriers which are closer to the surface than the PBE functional however, a larger anisotropy is expected for the PBE-vdW-DF2 func-tional, which is also found in the potential energy surfaces (see Table VI). The PBE functional gives smaller rotational effects than the PBE-vdW-DF2 functional, consistent with the differences in anisotropy.
0 0.2 0.4 0.6 0.8
1
Normal incidence energy (eV)
Reaction pro
b
a
b
ility
PBE
J = 0 J = 2 J = 3 J = 5 J = 8
0 0.2 0.4 0.6 0.8
0 0.1 0.2 0.3
PBE-vdW-DF2
FIG. 7. The degeneracy averaged reaction probability for the PBE and PBE-vdW-DF2 functionals for several rotational states in the vibrational ground state. The probabilities were computed with the quasi-classical trajectory method.
It should be noted that for H2 and D2 dissociation on
Cu(111) experimental studies60,92,93showed a behaviour sim-ilar to the one here observed with the PBE-vdW-DF2 func-tional, in the sense that reaction at first decreases withJ, after which it increases withJ. This trend could not be reproduced in recent calculations17,18in which the PW91 and RPBE func-tionals were used. In these calculations, a behaviour similar to the one here observed with the PBE functional was found. This therefore suggests that the use of vdW-DF functionals on H2 or D2dissociation on Cu(111) could lead to an improved
description of that system.
-0.2 0 0.2 0.4 0.6 0.8
1
Normal incidence energy (eV)
Rotational q
u
adr
u
pole alignment
PBE J = 1
J = 3 J = 5 J = 7 J = 9
-0.2 0 0.2 0.4 0.6 0.8
0 0.1 0.2 0.3
PBE-vdW-DF2
FIG. 8. The rotational quadrupole alignment parameter, computed with the quasi-classical trajectory method, for the PBE and PBE-vdW-DF2 function-als for several rotational states in the vibrational ground state.
rotational quadrupole alignment parameter, because the higher anisotropy leads to an increased preference for reac-tion of helicoptering molecules.
C. Molecular beam sticking
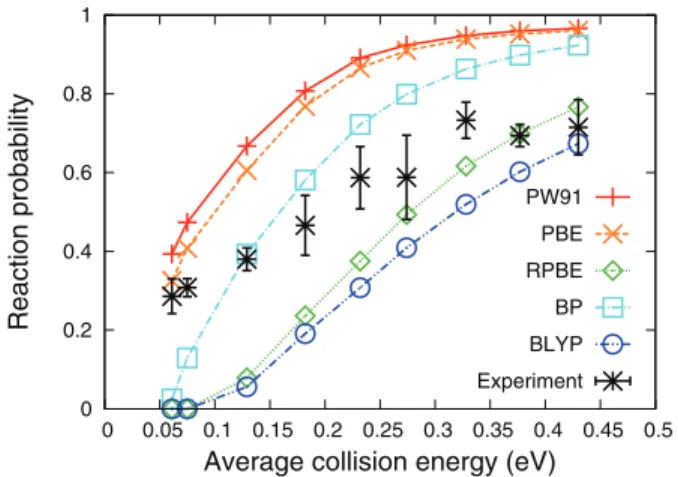
In Figure9, the molecular beam simulations for H2
dis-sociating on Ru(0001) are shown for several commonly used exchange-correlation functionals. It is clear that, similar to previous results by Nietoet al,30the computed reaction prob-ability curves are narrower than the experimental curve. For the width, the best agreement is found for the RPBE and BLYP functionals, but both of these underestimate the reac-tion probability for the lowest collision energies considerably. The potential energy surfaces obtained from these function-als therefore have too high minimum barriers. The PW91 and PBE reaction probability curves are quite similar, which is not surprising as the PBE functional is overall quite similar68 to PW91. It should be clear that the reaction probability follows the trends shown in Figure3for the energetic corrugation and lowest barrier height at least qualitatively.
In Figure10, the molecular beam simulations for H2
dis-sociating on Ru(0001) are shown for the revTPSS and HTBS functionals, with a comparison to results obtained with related functionals. The HTBS functional yields a reaction probabil-ity curve which is in between the reaction probabilprobabil-ity curves obtained with the WC and RPBE functionals. The reaction probability obtained with the HTBS PES at low energies is underestimated, while it is overestimated at high energies. The width of the HTBS reaction probability curve seems to
0 0.2 0.4 0.6 0.8
1
0 0.05 0.1 0.15 0.2 0.25 0.3 0.35 0.4 0.45 0.5
Reaction pro
b
a
b
ility
Average collision energy (eV)
PW91
PBE
RPBE
BP
BLYP
Experiment
FIG. 9. Reaction probability for molecular beams of H2 dissociating
on Ru(0001) computed with various standard functionals, compared to experiment.31
be equal to or even slightly smaller than the width of the PBE reaction probability curve. The revTPSS functional yields re-action probabilities which are slightly lower than PBE and are therefore in better overall agreement with the experiments. The width of the reaction probability curve is however not much changed and can in this sense not explain the exper-imental dependence of the reaction probability on the inci-dence energy. It is difficult to say much of general validity about the importance of the meta-GGA approximation for molecule–surface reactions, as only a single meta-GGA func-tional is tested here for a single system. For the system con-sidered here, however, the strength of the meta-GGA approx-imation seems to lie in the better simultaneous description of the surface, as evidenced by a better lattice constant (see TableIV), and the molecule–surface interaction, as evidenced by the reaction probabilities computed with the PBE and revTPSS functionals being similar. The better simultaneous description of the molecule and the surface is in agreement with previous results obtained with the revTPSS functional,89 and is consistent with construction principles used in the de-velopment of this functional (better simultaneous description
0 0.2 0.4 0.6 0.8
1
0 0.05 0.1 0.15 0.2 0.25 0.3 0.35 0.4 0.45 0.5
Reaction pro
b
a
b
ility
Average collision energy (eV)
PBE
revTPSS
WC
HTBS
RPBE
Experiment
FIG. 10. Reaction probability for molecular beams of H2 dissociating on
Ru(0001) computed with the revTPSS and HTBS functionals. For compar-ison, the PBE, WC, and RPBE molecular beam reaction probabilities are plotted, as well as experimental results.31
0 0.2 0.4 0.6 0.8
1
Average collision energy (eV)
Reaction pro
b
a
b
ility
LYP functional
PBEα PBE RPBE PBEα:RPBE(85:15) Experiment
0 0.2 0.4 0.6 0.8
0 0.1 0.2 0.3 0.4 0.5
vdW-DF functional
PBE RPBE PBE:RPBE(50:50) Experiment
FIG. 11. Reaction probability for molecular beams of H2and D2dissociating
on Ru(0001) computed with various functionals containing LYP and vdW-DF correlation, compared with experimental results.31In the legend, only the name of the exchange functional is given.
of molecules and solids).74The finding that the revTPSS func-tional yields similar values of the minimum barrier height and the energetic corrugation for H2on Ru(0001) but yield a
dif-ferent and somewhat better value of the Ru lattice constant suggests that meta-GGA functionals could be devised that give a systematically better simultaneous description of sur-face reactivity and the metal lattice. This could be relevant to being able to simulate reactive scattering processes in a spe-cific system over a large range of surface temperatures.94
The relatively high energetic corrugation of the LYP-and vdW-DF-based functionals suggests that if suitable ex-change functionals are chosen, they could be used for a mix-ing procedure similar to the one previously applied for H2
on Cu(111).17,18 The results of such a mixing procedure, in which only the exchange functional is mixed and the corre-lation functional kept fixed, are shown in Figure 11. For the LYP functionals, it is found that PBEαLYP and RPBELYP could form a pair for the mixing procedure, in the sense that one functional consistently overestimates the reaction prob-ability and the other consistently underestimates. The PBE-LYP functional already provides a reasonable description at higher energies, but underestimates the reaction probability at the lowest energies. A 85:15 mixture of the PBEαand RPBE functionals gives a good agreement for the lowest energies. For the vdW-DF functionals, the PBE-vdW-DF and RPBE-vdW-DF functionals could form such a pair. A 50:50 mixture of the PBE and RPBE functionals gives a good agreement over the whole energy range. For the vdW-DF2 functional, it was found that no mixing procedure was needed.
0 0.2 0.4 0.6 0.8
1
Average collision energy (eV)
Reaction pro
b
a
b
ility
H2
PBE PBE-vdW-DF2 PBE:RPBE(50:50)-vdW-DF PBEα:RPBE(85:15)LYP Experiment
0 0.2 0.4 0.6 0.8
0 0.1 0.2 0.3 0.4 0.5
D2
FIG. 12. Reaction probability for molecular beams for H2and D2
dissociat-ing on Ru(0001) computed with the PBE-vdW-DF2 functional and the two mixed functionals of Figure11, compared with experimental results.31For comparison, the PBE molecular beam reaction probability has been plotted.
In Figure 12, the molecular beam simulations for H2 and D2 dissociating on Ru(0001) are shown for
the PBE-vdW-DF2, PBE:RPBE(50:50)-vdW-DF, and PBEα: RPBE(85:15)LYP functionals. The PBE-vdW-DF2 reac-tion probability is at all points slightly higher than the PBE:RPBE(50:50)-vdW-DF reaction probability, even though the minimum barrier heights are almost the same for these functionals. The PBEα:RPBE(85:15)LYP functional gives a reaction probability curve which is slightly more re-active and narrower. The agreement with experiment is good for both vdW-DF functionals, except perhaps at the highest two energies. It should however be pointed out that a some-what oscillatory behaviour is present in the experimental data at the highest points, which is not reproduced by theory. Over-all, the agreement with experiment is quite good for the two vdW-DF functionals. This suggests that these functionals can be considered candidate SRP functionals.
D. Scattering and reaction at off-normal incidence
0 0.1 0.2 0.3 0.4 0.5 0.6 0.7
0.04 0.06 0.08 0.1 0.12 0.14 0.16 0.18 0.2
Reaction pro
b
a
b
ility
Normal incidence energy
Normal incidence
Epar = 35 meV, [101−0]
Epar = 35 meV, [112−0]
FIG. 13. Reaction probability for n-H2 reacting on Ru(0001), shown as
a function of normal incidence energy, computed with the PBE-vdW-DF2 functional for various incidence conditions.
previous calculations on H2 dissociation on Pt(111)45 and
model potentials.95It should furthermore be noted that small oscillations occur in the curve at low energies, suggesting that the hydrogen molecule can be temporarily trapped in one of the wells present in the PES. These oscillations were not present in previous PW91 results.30
In Figure 14, probabilities for various scattering pro-cesses computed with quantum dynamics are shown for cold n-H2 scattering from Ru(0001) with an initial parallel
en-ergy of 35 meV in the [1120] incidence direction. The re-action probability computed with the PBE-vdW-DF2 and
PBE:RPBE(50:50)-vdW-DF functionals is lower than the re-action probability previously obtained with the PW91 func-tional over the entire range of incidence energies considered. Rotational excitation into (v=0, J=2) for the vdW-DF functionals has a probability similar to the one previously ob-tained with the PW91 functional, and is the dominant rovi-brational excitation channel. Virovi-brational excitation is not an open channel at the energies considered here. The proba-bility for survival in (v=0, J=0) or (v=0, J=1) is higher with the PBE-vdW-DF2 and PBE:RPBE(50:50)-vdW-DF functionals than those previously obtained with the PW91 functional.
The total per-order diffraction probabilities obtained with the PBE-vdW-DF2 and PBE:RPBE(50:50)-vdW-DF func-tionals are generally higher than those obtained with PW91. The shape of the per-order diffraction probability curves is however almost the same for the different functionals con-sidered. The second and third order diffraction probabilities do not change much over the considered energy range, while the zeroth and first order diffraction probability curves in all cases decrease with increasing incidence energy. For the vdW-DF based functionals, the total first order diffraction proba-bility is higher than the zeroth order diffraction probaproba-bility, whereas they are almost the same for the PW91 functional, except at the lowest energies. The PW91 functional is the only functional reproducing the experimental trend that ze-roth order diffraction is more probable than first order diffrac-tion, but only at the lowest energies. All functionals predict a reasonable amount of second and third order diffraction, in
0 0.2 0.4 0.6 0.8
1
Normal incidence energy (eV)
Diffraction pro
b
a
b
ility
Pro
b
a
b
ility
PBE-vdW-DF2 PBE:RPBE(50:50)-vdW-DF PW91
survival scattering to (v’ = 0, J’ = 2) reaction
0 0.1 0.2 0.3
0.04 0.06 0.08 0.1
0th order 1st order 2nd order 3rd order
0.04 0.06 0.08 0.1 0.04 0.06 0.08 0.1 0.12
FIG. 14. Various scattering probabilities forn-H2scattering from Ru(0001) with an initial parallel energy of 35 meV in the [1120] incidence direction computed
with the PBE-vdW-DF2 and PBE:RPBE(50:50)-vdW-DF XC functionals. Theoretical results: lines, experimental results:30symbols. Top panels: rovibrationally
elastic scattering (survival), rotational excitation (v=0, J=2), and reaction. Bottom panels: per-order diffraction probabilities for rovibrationally elastic scattering. For comparison, previous PW91 results30are also shown.
0 0.05 0.1 0.15 0.2 0.25 0.3
Normal incidence energy (eV)
Diffraction pro
b
a
b
ility
[101-0] P(00)
PBE-vdW-DF2 PBE:RPBE(50:50)-vdW-DF PW91 Experiment
[112-0] P(00)
[101-0] P(01)+P(01-)
0 0.03 0.06 0.09 0.12
[101-0] P(1-0)+P(1-1-) [101-0] P(11)+P(10) [112-0] P(1-0)+P(01-)
0 0.03 0.06 0.09 0.12
0.04 0.06 0.08 0.1
[112-0] P(10)+P(01)
0.04 0.06 0.08 0.1
[112-0] P(1-1-)
0.04 0.06 0.08 0.1 0.12
[112-0] P(11)
FIG. 15. Diffraction probabilities forn-H2scattering from Ru(0001) with an initial parallel energy of 35 meV in the [1010] or [1120] incidence directions
computed with the PBE-vdW-DF2 and PBE:RPBE(50:50)-vdW-DF XC functionals. For comparison, experimental results30and previous PW91 results30are
also shown.
disagreement with experiments (in experiments, second or-der diffraction channels were found to be an oror-der of magni-tude lower in intensity than first order diffraction channels30). For the [1010] incidence direction similar results were obtained.
In Figure15, diffraction probabilities for rovibrationally elastic scattering of cold n-H2 computed with quantum
dy-namics are shown for the PBE:RPBE(50:50)-vdW-DF and PBE-vdW-DF2 functionals, and compared to experiments and previous results30 obtained with the PW91 functional. The two vdW-DF functionals considered here, PBE-vdW-DF2 and PBE:RPBE(50:50)-vdW-DF, give results in good agree-ment with each other. Furthermore, the order of the curves is mostly in agreement with the previous PW91 calcula-tions. The diffraction probability at higher energies is however somewhat higher than obtained with the PW91 calculations, especially at higher incidence energies. The results from the vdW-DF functionals overestimate the experimental
diffrac-tion probability by at most about a factor 2 for zeroth order diffraction and by around a factor 3 for first order diffraction. The agreement with the diffraction experiments is clearly not as good as the agreement obtained for the reaction proba-bility in Sec.III C. The computed diffraction probabilities are too high compared to the experiments, in particular for first order diffraction. There are several possible explanations for this and these will be discussed below.
First, the effects of surface temperature should be con-sidered. For the reaction probability, no large surface tem-perature effects are expected. This has several reasons. The surface temperature used in the experiments, Ts =180 K,31
is rather low. In ab initiomolecular dynamics calculations39 and static corrugation model calculations,40almost no effects were found for H2dissociating on Cu(111) at a surface
tem-perature Ts =120 K. While the surface temperature for the
molecular beam experiments on H2dissociation on Ru(0001)


![FIG. 14. Various scattering probabilities for n-H 2 scattering from Ru(0001) with an initial parallel energy of 35 meV in the [1120] incidence direction computed with the PBE-vdW-DF2 and PBE:RPBE(50:50)-vdW-DF XC functionals](https://thumb-us.123doks.com/thumbv2/123dok_us/8177016.2167656/14.918.118.797.632.1054/scattering-probabilities-scattering-parallel-incidence-direction-computed-functionals.webp)
