Mendelian
randomization
of
inorganic
arsenic
metabolism
as
a
risk
factor
for
hypertension-and
diabetes-related
traits
among
adults
in
the
Hispanic
Community
Health
Study/Study
of
Latinos
(HCHS/SOL)
cohort
Molly
Scannell
Bryan
,
1Tamar
Sofer
,
2,3Yasmin
Mossavar-Rahmani,
4Bharat
Thyagarajan
,
5Donglin
Zeng,
6Martha
L
Daviglus
1and
Maria
Argos
7*
1
Institute
for
Minority
Health
Research,
University
of
Illinois
at
Chicago,
Chicago,
IL,
USA,
2Brigham
and
Women’s
Hospital,
Boston,
MA,
USA,
3Harvard
Medical
School,
Boston,
MA,
USA,
4Department
of
Epidemiology
and
Population
Health,
Einstein
College
of
Medicine,
Bronx,
New
York,
USA,
5Department
of
Laboratory
Medicine
and
Pathology,
University
of
Minnesota,
Minneapolis,
MN,
USA,
6Department
of
Biostatistics,
University
of
North
Carolina,
Chapel
Hill,
NC,
USA
and
7Division
of
Epidemiology
and
Biostatistics,
School
of
Public
Health,
University
of
Illinois
at
Chicago,
Chicago,
IL,
USA
*Correspondingauthor. Division of Epidemiology and Biostatistics, School of Public Health, University of Illinois at Chicago,1603W.TaylorStreet,MC923,Chicago,IL60612,USA.E-mail:[email protected]
Editorialdecision26February2019;Accepted7March2019
Abstract
Background:
Hypertension
and
diabetes
have
been
associated
with
inefficient
arsenic
metabolism,
primarily
through
studies
undertaken
in
populations
exposed
through
drinking
water.
Recently,
rice
has
been
recognized
as
a
source
of
arsenic
exposure,
but
it
remains
unclear
whether
populations
with
high
rice
consumption
but
no
known
water
exposure
are
at
risk
for
the
health
problems
associated
with
inefficient
arsenic
metabo-lism.
Methods:
The
relationships
between
arsenic
metabolism
efficiency
(%
inorganic
arsenic,
%
monomethylarsenate
and
%
dimethylarsinate
in
urine)
and
three
hypertension-
and
seven
diabetes-related
traits
were
estimated
among
12
609
participants
of
the
Hispanic
Community
Health
Study/Study
of
Latinos
(HCHS/SOL).
A
two-sample
Mendelian
ran-domization
approach
incorporated
genotype-arsenic
metabolism
relationships
from
liter-ature,
and
genotype-trait
relationships
from
HCHS/SOL,
with
a
mixed-effect
linear
model.
Analyses
were
stratified
by
rice
consumption
and
smoking.
point increase;
P
¼
0.021) and diastolic (1.33 mmHg/percentage point increase;
P
¼
0.005)
blood pressure.
Dimethylarsinate, a marker of efficient metabolism, was associated
with lower systolic (
0.92 mmHg/percentage point increase;
P
¼
0.025) and diastolic
(-0.79 mmHg/percentage point increase;
P
¼
0.004) blood pressure. Among low rice
consumers and ever smokers, the results were consistent with no association. Evidence
for a relationship with diabetes was equivocal.
Conclusions:
Less efficient arsenic metabolism was associated with increased blood
pressure among never smokers with high rice consumption, suggesting that arsenic
ex-posure through rice may contribute to high blood pressure in the Hispanic/Latino
community.
Key words:
Arsenic, arsenic methylation, arsenic metabolism, cardiovascular disease, hypertension, blood
pres-sure, diabetes, Mendelian randomization, Hispanic/Latino health
Introduction
The health consequences of inorganic arsenic (iAs) have
largely been identified from populations who were exposed
to arsenic through drinking water. In these studies, water
ar-senic concentrations typically exceed the WHO
recom-mended level of 10
m
g/L.
1–5Chronic exposure to elevated
levels of iAs is associated with increased risk of hypertension
and diabetes.
6–8Furthermore, risk is further related to
differ-ences in the ability to metabolize iAs.
1,2Metabolism of iAs is
accomplished through a series of reduction, oxidation and
methylation reactions.
9During this process, the most
abun-dant
intermediate
metabolite
is
monomethylarsenate
(MMA), which can then be further methylated to produce
dimethylarsinate (DMA).
9Among individuals with the same
level of iAs exposure, inefficient metabolizers (higher % iAs
and % MMA in their urine) have been found to have higher
risk of arsenic-associated disease, and efficient metabolizers
(higher % DMA) typically have lower risk.
10,11Rice, a staple of many Hispanic/Latino diets,
12has
re-cently been recognized as a significant contributor of dietary
iAs. Previous research has found that in populations with no
known water exposure but high rice consumption,
bio-markers of internal arsenic exposure approach those of
popu-lations with water exposure above 10
m
g/L.
13–16This suggests
that within communities with rice-centred diets, poor arsenic
metabolizers may be at increased risk of arsenic-associated
diseases. However, few studies have measured iAs
metabo-lism in populations without water exposure, making direct
assessment of this hypothesis challenging.
In populations in which urinary arsenic metabolites have
not been directly measured but genotypes have, it is possible
to estimate the influence of iAs metabolism using a
two-sample Mendelian randomization.
17,18This approach
incor-porates previous research that has identified multiple single
nucleotide variants (SNVs) that affect iAs metabolism.
19–22These are combined with study-specific SNV-outcome
asso-ciations to estimate iAs metabolism-outcome relationships.
This study estimates the relationship between iAs
metabo-lism and hypertension- and diabetes-related traits in
partici-pants of the Hispanic Community Health Study/Study of
Latinos
(HCHS/SOL) by
implementing a
two-sample
Mendelian randomization approach, stratifying by rice
con-sumption and smoking status.
Methods
Study population
The Hispanic Community Health Study/Study of Latinos
(HCHS/SOL) is a community-based cohort study of
Hispanic and Latino adults in four cities in the USA:
Key Messages
• Never smokers who are poor metabolizers of arsenic face an increased risk of hypertension.
• The association was observed for those with levels of arsenic exposure that can be acquired through diets high in
rice.
• Future research should examine other populations with high levels of rice consumption, who may also be at
in-creased risk.
Chicago, Miami, the Bronx and San Diego. The study
de-sign has been described previously.
23This analysis
in-cluded the 12 609 HCHS/SOL participants with complete
genotype data and active consent.
Assessment of hypertension- and diabetes-related
traits
Hypertension- and diabetes-related traits were assessed at
baseline, as described elsewhere.
24Systolic and diastolic blood
pressures were measured three times with a tested automated
sphygmomanometer (Omron model HEM-907 XL; Omron
Healthcare Inc., Bannockburn, IL) with seated participants.
The average was recorded. Pulse pressure was calculated as
the difference between systolic and diastolic blood pressures.
For individuals treated with blood pressure-lowering
medica-tion, the following adjustments to the observed values were
made: systolic
þ
10 mmHg and diastolic
þ
5 mmHg.
25Fasting glucose, insulin, triglycerides and HbA1c were
measured at the baseline interview from blood collected after
an 8-h fast. For individuals treated with diabetic medication,
the following adjustments were made: fasting glucose
þ
30
mg/dl, fasting triglycerides
þ
30 mg/dl and HbA1c
þ
1.5%.
26Three diabetes-related indices were calculated:
homeostatic model assessment of beta cell function
(HOMA-B),
27homeostatic model for insulin resistance
(HOMA-IR)
27and McAuley insulin sensitivity index.
28Thirty participants did not fast; their glucose, insulin and
tri-glycerides were set to missing. A small number of
partici-pants were outliers; these participartici-pants were top-coded at the
following levels: fasting glucose (400 mg/dl, 10 participants),
HbA1c (15%, eight participants), HOMA-IR (100 mg/
dlmU/L, 17 participants), HOMA-B [2500 (mU/L)/(mg/dL),
six participants], fasting insulin (200 mU/L, six participants)
and fasting triglycerides (2000 mg/dl, one participant).
Classifying rice consumption
The HCHS/SOL participants completed two 24-h recalls of
their food intake; the first at enrolment, and the second
within 1 month of the baseline interview.
29Three questions
queried the number of servings of grains, flour and dry mixes
consumed (pasta and corn tortillas were assessed separately).
These questions could have referred to consumption of
ama-ranth, barley, buckwheat, corn flour, millet, oats, rye,
sor-ghum, spelt, teff, triticale, quinoa and wheat flour as well as
rice. Comparisons with the food propensity questionnaire
(
Supplementary Figure 1
, available as
Supplementary data
at
IJE
online) confirm that rice is the primary grain. The total
number of servings of grain from the two 24-h recalls were
averaged. The top decile of grain consumers averaged more
than 4.7 servings of grains (
n
¼
1261 high consumers).
Identifying variants associated with arsenic
metabolism efficiency
PubMed was searched to identify studies that investigated
genetic associations with arsenic metabolism efficiency. The
study was considered if arsenic metabolism efficiency was
measured linearly as % iAs, % DMA, and % MMA, and a
variant met the customary threshold for genome-wide
signif-icance (
P
<
5
10
–8). Three SNVs in two studies met these
cri-teria (
Table 1
), with all of the studies undertaken in
populations of South Asian ancestry.
20,21Two of the SNVs
are located in chromosome 10 near the region of
AS3MT
:
rs9527 and rs11191527.
20,30The third, rs61735836,
21is
lo-cated within a coding region of
FTCD
on chromosome 21.
Smoking status
Smoking has a complex and inconsistent relationship with
blood pressure in population-level studies.
31–34In order to
avoid this complicating the interpretation, the analysis was
stratified by ever- and never-smoking status (
n
¼5074 and
7535, respectively), as assessed during the baseline interview.
Genotyping in HCHS/SOL
The genotyping and quality control for the HCHS/SOL
participants are described elsewhere.
35Briefly, DNA was
extracted from blood and genotyped on an Illumina
cus-tom array expanded from the Illumina Omni 2.5 M array
(HumanOmni2.5-8v1-1). Samples were excluded for sex
mismatch, gross chromosomal anomalies, duplicates,
high missing call rates, and evidence of contamination or
batch effects. A total of 12 689 samples passed quality
control and had active consent at the time of analysis.
SNVs were excluded for high missing call rates,
Mendelian errors, duplicate-sample discordance and
devi-ation from ancestry-specific Hardy-Weinberg equilibrium
(
P
<
10
5).
One of the three variants identified above was directly
measured by the array (rs11191527). The other two were
imputed to the 1000 Genomes Project phase 1 reference
panel (OEvar/r
2¼
1 for both).
36SHAPEIT2 (v.2.r644)
37pre-phased and IMPUTE2 (v.2.3.0)
38implemented the
im-putation. The SNVs were converted to forward strand and
the effect alleles were harmonized with published literature
as recommended in Hartwig
et al
.
39Statistical methods for SNV-trait associations
within HCHS/SOL
log-transformed before analysis. The relationships between the
three Mendelian randomization SNVs and the
hypertension-and diabetes-related traits were calculated using a
mixed-effect linear model
35using the GENESIS R package.
40,41Mixed effects were used to control for kinship, household
and block group; fixed effects were used to control for the
top five principal components, genetically-ascertained
ances-try group
42and the log of the sampling weights. The
analy-ses were stratified by rice consumption and smoking status.
Statistical methods for Mendelian randomization
In the HCHS/SOL study population, significant linkage
disequilibrium exists between rs9527 and rs11191527 (r
2¼
0.28; D’
¼
0.87). Given the correlation between these
two variants, this analysis implemented Burgess
et al
.’s
Mendelian randomization technique to construct the
in-strument using principal components.
19The Mendelian randomization analysis was repeated for
each of the traits within rice and smoking sub-strata three
times: once to estimate the effect of % iAs, once for %
MMA and once for % DMA. The genotype-arsenic
metabo-lism effect sizes and standard errors used were as listed in
Table 1
. The genotype-trait estimates were derived from the
HCHS/SOL mixed-effect genetic analyses as described above.
Sensitivity to modelling assumptions
Four of the traits were additionally analysed as dichotomous
outcomes at clinically relevant thresholds: systolic blood
pres-sure
>
130 mmHg,
43diastolic
>
80 mmHg,
43fasting glucose
>
125 mg/dl
44and HbA1c
>
6.5%.
44Additionally, overall
evi-dence of hypertension [systolic
>
140 mmHg, diastolic
>
90
mmHg (to be consistent with previous work in HCHS/SOL)
or current antihypertensive medication use
45] and overall
evi-dence of diabetes (fasting glucose
>
126 mg/dl, HbA1c 6.5%
or current diabetes medication use
46) were also analysed. To
evaluate whether the estimates were sensitive to the control for
the sampling design, the analyses were repeated twice:
remov-ing the fixed-effect covariate of the log of the samplremov-ing
weights; and on this unweighted model including education
and years in the USA as fixed effects as a proxy of the sampling
strata. To evaluate whether the results were sensitive to the
top-coding, they were repeated on non-top-coded data. To
evaluate whether the results were sensitive to the correction for
medication use, the analyses were repeated on uncorrected
data where medication use was controlled for as a confounder.
To evaluate whether the results were sensitive to the cut-off of
rice consumption, the analyses were repeated using rice
con-sumption thresholds of 50th, 66th, 75th and 95th percentiles.
Results
Characteristics of the study population are found in
Supplementary Table 1
, available as
Supplementary data
at
IJE
online. Results from the Mendelian randomization
of arsenic metabolism and hypertensive traits are presented
in
Table 2
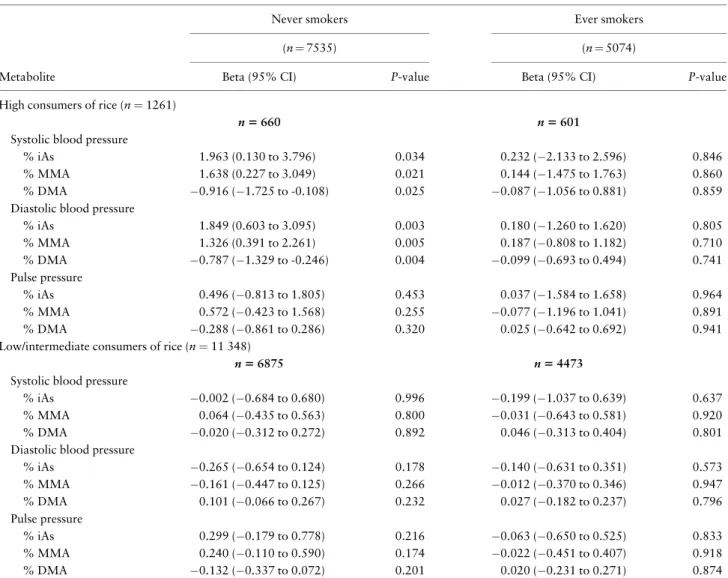
. Among never smokers who are high consumers
of rice (
Table 2
, left top), increased % iAs was associated
with increased systolic blood pressure [1.96
mmHg/per-centage point increase in %i AS; 95% confidence interval
(CI): 0.13 to 3.80;
P
¼
0.034] and increased diastolic blood
pressure (1.85 mm Hg/percentage point increase; 95% CI:
0.60 to 3.10;
P
¼
0.003). Increased % MMA was similarly
associated with increased diastolic and systolic blood
pres-sure (1.64 mmHg systolic/percentage point; 95% CI: 0.23
to 3.05;
P
¼
0.021; and 1.33 mmHg diastolic/percentage
point increase; 95% CI: 0.39 to 2.26;
P
¼
0.005). The
marker of efficient arsenic metabolism, increased % DMA,
was inversely associated with both systolic and diastolic
blood pressure (0.92 mmHg systolic/percentage point
in-crease in % DMA; 95% CI:
1.73 to
0.11;
P
¼
0.025;
and -0.79 mmHg diastolic/percentage point increase; 95%
CI:
1.33 to
0.25;
P
¼
0.004). For pulse pressure, the
standard errors were consistent with the null hypothesis
for all three arsenic metabolites. Among ever smokers
(
Table 2
, right top), the point estimates of the association
were smaller and the confidence intervals widened to
in-clude zero for all hypertensive traits. Among
intermediate-and low-consumers of rice, there was no clear pattern
Table 1.Effect sizes and standard errors for SNV-arsenic metabolism efficiency relationships found in published literature
% iAs % MMA % DMA
rs number Chr: pos Eff/ref Beta SE Beta SE Beta SE
rs95279,22 10: 104623578 T/C 1.81 0.37 2.01 0.28 3.82 0.48 rs111915279,22 10: 104795134 C/T 1.32 0.27 0.98 0.20
2.30 0.35
rs6173583623 21: 47572887 A/G 2.71 0.37 2.42 0.29 5.09 0.51
Chr: pos: chromosome and position. Position locations refer to the hg19 assembly.
between any of the three arsenic metabolites and
hyperten-sion for all traits (
Table 2
, bottom). For the
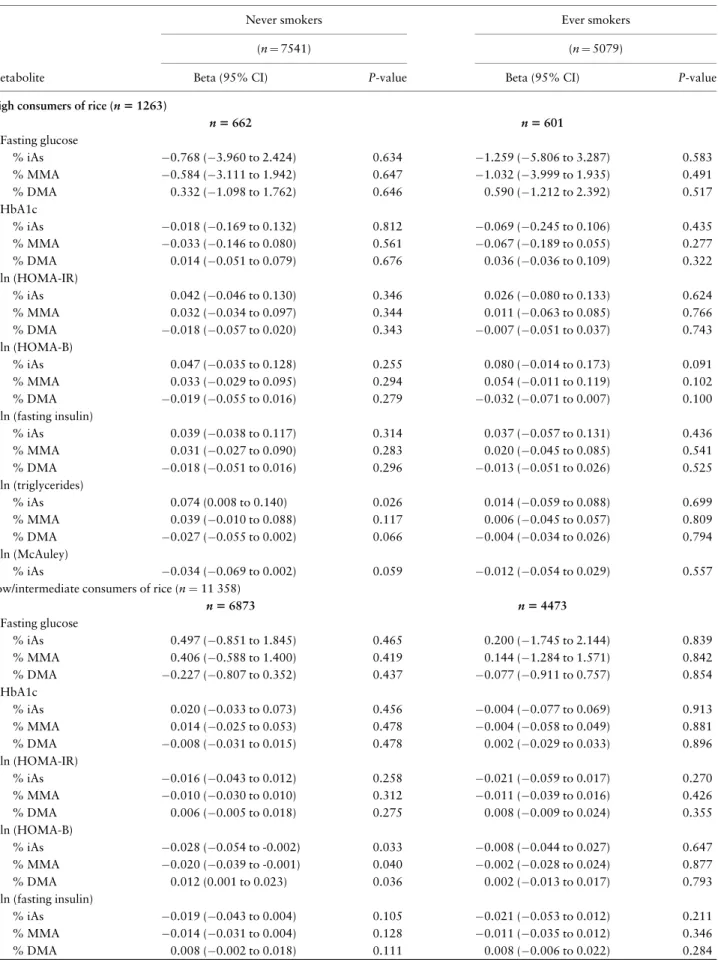
diabetes-related traits (
Table 3
), we found no evidence of an
associ-ation between genetically influenced arsenic metabolism
efficiency, as the magnitude of the estimated effect was
small and the confidence intervals wide. These null results
were observed in both high- and low-consumers of rice and
every smoking status.
Sensitivity analyses
For the dichotomous hypertensive traits, the directions of
the effects for high consumers of rice were consistent with
the continuous analyses (
Supplementary Table 2
,
avail-able as
Supplementary data
at
IJE
online), although the
confidence intervals of the estimates were consistent with
null association (with the exception of high diastolic
blood pressure). For the dichotomous diabetes traits,
there continued to be no evidence of an association
(
Supplementary Table 3
, available as
Supplementary data
at
IJE
online).
The results were not sensitive to the top-coding of
out-liers in the diabetes-related traits, normality
transforma-tions, correction for medication use or methodology to
control for study structure. Altering the threshold of ‘high’
rice consumption produced substantively similar results;
however, as the threshold increased, the point estimates
in-creased in magnitude and the smaller sample size produced
estimates that were less precise (tables available upon
request).
Table 2.Mendelian randomization estimates for the associations between three measures of arsenic metabolism efficiency and hypertensive traits
Never smokers Ever smokers
(n¼7535) (n¼5074)
Metabolite Beta (95% CI) P-value Beta (95% CI) P-value
High consumers of rice (n¼1261)
n5660 n5601
Systolic blood pressure
% iAs 1.963 (0.130 to 3.796) 0.034 0.232 (2.133 to 2.596) 0.846 % MMA 1.638 (0.227 to 3.049) 0.021 0.144 (1.475 to 1.763) 0.860 % DMA 0.916 (1.725 to -0.108) 0.025 0.087 (1.056 to 0.881) 0.859 Diastolic blood pressure
% iAs 1.849 (0.603 to 3.095) 0.003 0.180 (1.260 to 1.620) 0.805 % MMA 1.326 (0.391 to 2.261) 0.005 0.187 (0.808 to 1.182) 0.710 % DMA 0.787 (1.329 to -0.246) 0.004 0.099 (0.693 to 0.494) 0.741 Pulse pressure
% iAs 0.496 (0.813 to 1.805) 0.453 0.037 (1.584 to 1.658) 0.964 % MMA 0.572 (0.423 to 1.568) 0.255 0.077 (1.196 to 1.041) 0.891 % DMA 0.288 (0.861 to 0.286) 0.320 0.025 (0.642 to 0.692) 0.941 Low/intermediate consumers of rice (n¼11 348)
n56875 n54473
Systolic blood pressure
% iAs 0.002 (0.684 to 0.680) 0.996 0.199 (1.037 to 0.639) 0.637 % MMA 0.064 (0.435 to 0.563) 0.800 0.031 (0.643 to 0.581) 0.920 % DMA 0.020 (0.312 to 0.272) 0.892 0.046 (0.313 to 0.404) 0.801 Diastolic blood pressure
% iAs 0.265 (0.654 to 0.124) 0.178 0.140 (0.631 to 0.351) 0.573 % MMA 0.161 (0.447 to 0.125) 0.266 0.012 (0.370 to 0.346) 0.947 % DMA 0.101 (0.066 to 0.267) 0.232 0.027 (0.182 to 0.237) 0.796 Pulse pressure
% iAs 0.299 (0.179 to 0.778) 0.216 0.063 (0.650 to 0.525) 0.833 % MMA 0.240 (0.110 to 0.590) 0.174 0.022 (0.451 to 0.407) 0.918 % DMA 0.132 (0.337 to 0.072) 0.201 0.020 (0.231 to 0.271) 0.874
Low/intermediate consumers of rice are those below the 90th percentile of consumption for grains. Systolic blood pressure, diastolic blood pressure and pulse pressure are measured in mmHg. The reported coefficients are interpreted as the expected increase in the trait for a one percentage point increase in the arsenic metabolite.
Table 3.Mendelian randomization estimates for the associations between three measures of arsenic metabolism efficiency and diabetic traits
Never smokers Ever smokers
(n¼7541) (n¼5079)
Metabolite Beta (95% CI) P-value Beta (95% CI) P-value
High consumers of rice (n51263)
n5662 n5601
Fasting glucose
% iAs 0.768 (3.960 to 2.424) 0.634 1.259 (5.806 to 3.287) 0.583 % MMA 0.584 (3.111 to 1.942) 0.647 1.032 (3.999 to 1.935) 0.491 % DMA 0.332 (1.098 to 1.762) 0.646 0.590 (1.212 to 2.392) 0.517 HbA1c
% iAs 0.018 (0.169 to 0.132) 0.812 0.069 (0.245 to 0.106) 0.435 % MMA 0.033 (0.146 to 0.080) 0.561 0.067 (0.189 to 0.055) 0.277 % DMA 0.014 (0.051 to 0.079) 0.676 0.036 (0.036 to 0.109) 0.322 ln (HOMA-IR)
% iAs 0.042 (0.046 to 0.130) 0.346 0.026 (0.080 to 0.133) 0.624 % MMA 0.032 (0.034 to 0.097) 0.344 0.011 (0.063 to 0.085) 0.766 % DMA 0.018 (0.057 to 0.020) 0.343 0.007 (0.051 to 0.037) 0.743 ln (HOMA-B)
% iAs 0.047 (0.035 to 0.128) 0.255 0.080 (0.014 to 0.173) 0.091 % MMA 0.033 (0.029 to 0.095) 0.294 0.054 (0.011 to 0.119) 0.102 % DMA 0.019 (0.055 to 0.016) 0.279 0.032 (0.071 to 0.007) 0.100 ln (fasting insulin)
% iAs 0.039 (0.038 to 0.117) 0.314 0.037 (0.057 to 0.131) 0.436 % MMA 0.031 (0.027 to 0.090) 0.283 0.020 (0.045 to 0.085) 0.541 % DMA 0.018 (0.051 to 0.016) 0.296 0.013 (0.051 to 0.026) 0.525 ln (triglycerides)
% iAs 0.074 (0.008 to 0.140) 0.026 0.014 (0.059 to 0.088) 0.699 % MMA 0.039 (0.010 to 0.088) 0.117 0.006 (0.045 to 0.057) 0.809 % DMA 0.027 (0.055 to 0.002) 0.066 0.004 (0.034 to 0.026) 0.794 ln (McAuley)
% iAs 0.034 (0.069 to 0.002) 0.059 0.012 (0.054 to 0.029) 0.557 Low/intermediate consumers of rice (n¼11 358)
n56873 n54473
Fasting glucose
% iAs 0.497 (0.851 to 1.845) 0.465 0.200 (1.745 to 2.144) 0.839 % MMA 0.406 (0.588 to 1.400) 0.419 0.144 (1.284 to 1.571) 0.842 % DMA 0.227 (0.807 to 0.352) 0.437 0.077 (0.911 to 0.757) 0.854 HbA1c
% iAs 0.020 (0.033 to 0.073) 0.456 0.004 (0.077 to 0.069) 0.913 % MMA 0.014 (0.025 to 0.053) 0.478 0.004 (0.058 to 0.049) 0.881 % DMA 0.008 (0.031 to 0.015) 0.478 0.002 (0.029 to 0.033) 0.896 ln (HOMA-IR)
% iAs 0.016 (0.043 to 0.012) 0.258 0.021 (0.059 to 0.017) 0.270 % MMA 0.010 (0.030 to 0.010) 0.312 0.011 (0.039 to 0.016) 0.426 % DMA 0.006 (0.005 to 0.018) 0.275 0.008 (0.009 to 0.024) 0.355 ln (HOMA-B)
% iAs 0.028 (0.054 to -0.002) 0.033 0.008 (0.044 to 0.027) 0.647 % MMA 0.020 (0.039 to -0.001) 0.040 0.002 (0.028 to 0.024) 0.877 % DMA 0.012 (0.001 to 0.023) 0.036 0.002 (0.013 to 0.017) 0.793 ln (fasting insulin)
% iAs 0.019 (0.043 to 0.004) 0.105 0.021 (0.053 to 0.012) 0.211 % MMA 0.014 (0.031 to 0.004) 0.128 0.011 (0.035 to 0.012) 0.346 % DMA 0.008 (0.002 to 0.018) 0.111 0.008 (0.006 to 0.022) 0.284
Discussion
We find that poor arsenic metabolism efficiency is
associ-ated with higher systolic and diastolic blood pressure, and
that these effects are seen at levels of arsenic exposure that
are present in the Hispanic/Latino community through
diet. This association is strongest among never smokers,
where each percentage increase in % iAs was associated
with approximately 2 mmHg higher systolic and diastolic
blood pressure; increases of % MMA were associated with
approximately 1.5 mmHg higher blood pressure. Given
that the risk alleles were each associated with an increase
in % iAs of approximately 2% age points (
Table 1
), this
suggests that arsenic metabolism efficiency may be
respon-sible for clinically meaningful variability in blood pressure
among high rice consumers.
Our Mendelian randomization approach uses a novel
methodology to complement the existing literature, to
suggest that dietary sources of arsenic can provide a level of
exposure that can influence blood pressure.
47–49Given that
the HCHS/SOL participants live in urban areas with
regu-lated public water systems that show no evidence of elevated
arsenic,
50–53this suggests that at levels of arsenic exposure
that can be acquired through diet, inter-individual
differen-ces in the ability to metabolize arsenic can influence
arsenic-related health outcomes. The null results in the
intermedi-ate- and low-consumers of rice served as a negative control:
those who did not consume enough rice to elevate their
arse-nic exposure did not have their blood pressure affected by
their ability to metabolize arsenic.
The results were specific to smoking status. In ever
smokers, the effect size was attenuated, and the confidence
intervals of the effect size were consistent with no
associa-tion. This suggests that in smokers, the harms of poor
arse-nic methylation capacity are less apparent than in people
who have never smoked. An assessment of the participants
of the UK Biobank (UKBB) found an association between
the
AS3MT
SNVs in our instrument and smoking,
54raising
a concern about pleiotropy, but we suggest that pleiotropy
through smoking status is unlikely to explain this
differ-ence. Population-level analyses have not found a consistent
effect of smoking on blood pressure,
31–34the
SNV-smoking effect sizes reported in the UKBB are small in
magnitude and inconsistent in direction and there is no
as-sociation between the
AS3MT
SNVs and smoking in
HCHS/SOL [
P
>
0.25 for both, with odds ratios (ORs)
close to 1]. Therefore, we suggest that this difference in
ef-fect may be evidence of an interaction between smoking
and arsenic metabolism, and that additional investigations
into this mechanism are warranted. Although previous
work has found that the health effects of the absolute level
of arsenic exposure differ by smoking status,
55–57few have
examined evidence for an interaction between arsenic
methylation and smoking.
The analysis did not provide evidence of association
with any of the seven diabetes-related traits tested.
Whereas future research that directly measures arsenic
ex-posure may be able to provide more precise estimates, this
is consistent with other work that has not found a strong
link between low-and intermediate-levels of arsenic
expo-sure and diabetes.
47,58,59Although there are several methods for incorporating
multiple SNVs into Mendelian randomization analyses,
Table 3.Continued
Never smokers Ever smokers
(n¼7541) (n¼5079)
Metabolite Beta (95% CI) P-value Beta (95% CI) P-value
ln (triglycerides)
% iAs 0.009 (0.028 to 0.010) 0.374 0.010 (0.034 to 0.014) 0.406 % MMA 0.008 (0.022 to 0.006) 0.277 0.004 (0.021 to 0.014) 0.665 % DMA 0.004 (0.004 to 0.012) 0.314 0.003 (0.007 to 0.013) 0.533 ln (McAuley)
% iAs 0.008 (0.002 to 0.019) 0.118 0.009 (0.005 to 0.022) 0.189 % MMA 0.006 (0.001 to 0.014) 0.099 0.005 (0.005 to 0.014) 0.366 % DMA 0.004 (0.008 to 0.001) 0.102 0.003 (0.009 to 0.003) 0.276
Low/intermediate consumers of rice are those below the 90th percentile of consumption for grains. Fasting glucose was measured in units of mg/dL; HbA1c is percentage of glycated haemoglobin; fasting insulin is in units of the natural log of mU/L; HOMA-B is in units of the natural log of (mU/L)/(mg/dL); HOMA-IR is in units of the natural log of (mg/dL)(mU/L); ln (McAuley) index is calculated as 2.63–0.28 ln (fasting insulin)-0.31 ln (fasting triglycerides); triglycerides were measured in units of mg/dl. The reported coefficients are interpreted as the expected increase in the trait for a one percentage point increase in the arsenic metabolite.
including polygenic risk scores,
60MR-Eggers
61and inverse
variant weights,
62this analysis used the Burgess
methodol-ogy
19that transforms the SNVs into their principal
compo-nents. Given the strong linkage disequilibrium in the
AS3MT
region,
63the Burgess principal components
analy-sis (PCA) method most comprehensively removes the
possi-bility of inflating type I error due to correlation between
rs9527 and rs11191527.
The results of this study could be strengthened if
addi-tional data were available. A direct measure of arsenic
expo-sure could have classified iAs expoexpo-sure more precisely than
rice consumption groups. However, given the low water
ar-senic exposure of the HCHS/SOL participants, it is likely
that dietary arsenic was a main source of exposure. Any
misclassification that resulted from non-dietary routes of
ar-senic exposure or imperfect food recall would likely be
non-differential, and therefore make the estimates less precise
but not confounded. Additionally, it would have been
pref-erable to have ascertained the SNV-arsenic metabolism
as-sociation in a study population with Hispanic/Latino
ancestry, rather than the South Asian population that was
represented in the published literature. However, the
associ-ation between variants in the
AS3MT
region and arsenic
metabolites has been observed in multiple genetic
back-grounds.
64–66This suggests that although the SNVs in
Table 1
may tag the truly causal SNV less efficiently in the
HCHS/SOL population, this would only bias the results
to-wards the null. Fine-mapping of the
AS3MT
and
FTCD
regions will provide additional insight into the causal SNVs,
which would improve the precision of these estimates.
Mendelian randomization assumptions
The interpretation of these results depends on the standard
Mendelian randomization assumptions:
67(i) the SNVs
from the literature predict % iAs, % MMA and % DMA;
(ii) the SNVs are not confounded; and (iii) the SNVs only
affect the hypertensiion- and diabetes-related traits
through their effects on arsenic metabolism.
Although the first assumption cannot be tested directly
since urinary arsenic metabolites were not measured in
HCHS/SOL, its plausibility is supported first by the
estab-lished biological pathways that connect the three SNVs to
arsenic metabolism efficiency; rs9527 and rs11191527 are
located near
AS3MT
, a gene that encodes arsenite
methyl-transferase, an enzyme involved in the arsenic metabolism
process;
9,68and rs61735836 produces a missense mutation
in
FTCD
, which encodes formimidoyltransferase
cyclodea-minase, an enzyme critical to arsenic metabolism.
69Additionally, this analysis only included SNVs whose
asso-ciations with % iAs, % MMA and % DMA reached a
stringent threshold in the original studies.
62,70The strongest threat to the second assumption often
comes in the form of uncontrolled population
stratifica-tion.
71In this analysis, the SNV-trait relationships were
es-timated within HCHS/SOL using a well-developed
algorithm that controls for cryptic relatedness, sample
clustering, ancestral background groups and principal
components.
35,42This framework has undergone extensive
validation in HCHS/SOL and other admixed populations,
and has been shown to be able to provide estimates with
no overall inflation of type I error.
72The third assumption requires that there are no other
non-arsenic metabolism-related genetic influences of
blood pressure through any of the SNVs used in the
in-strument. Whereas this assumption is not fully testable,
we undertook two robustness checks. First, the
NHGRI-EBI GWAS catalogue
73was searched to verify that no
variants in high linkage disequilibrium (r
2>
0.3) with
any of the SNVs in the instrument are known to be
associ-ated with cardiovascular or diabetes-relassoci-ated traits, or
with carbohydrate metabolism. Second, a final sensitivity
analysis was performed that restricted the instrument to
SNVs where the SNV-arsenic metabolism relationship
from the literature was roughly proportional to the
SNV-outcome relationship in HCHS/SOL, as this
proportional-ity can be an indicator that the third assumption holds.
74Of the three SNVs included in the instrument, the
per-allele effect of one of them (rs11191527) was in the
oppo-site direction expected for the hypertensive traits and was
therefore excluded from the instrument in the final
sensi-tivity analysis. The output of this sensisensi-tivity analysis
pro-duced substantively similar results to the three-SNV
instrument, but the magnitudes of the associations were
attenuated
and
the
confidence
intervals
widened
(
Supplementary Table 4
, available as
Supplementary data
at
IJE
online).
In conclusion, this study suggests that high rice
consump-tion confers a risk of arsenic-related increase in blood
pres-sure, and that this increased risk is felt most acutely in
non-smokers who inefficiently metabolize arsenic. This finding
highlights a previously unappreciated risk factor for
hyper-tension in the Hispanic/Latino community. These findings
di-rectly suggest diet-related mitigation efforts that could help
to reduce the burden of hypertension, and future research
that could more fully elucidate the magnitude of this risk.
Supplementary Data
Supplementary dataare available atIJEonline.
Funding
2T32-CA057699-26 to MSB, grant number N01-HC65233 to
HCHS/SOL at UNC, grant number N01-HC65234 to
HCHS/SOL at the University of Miami, grant number
N01- HC65235 to HCHS/SOL at Albert Einstein College
of Medicine, grant number N01-HC65236 to HCHS/SOL
at Northwestern and grant number N01-HC65237 to
HCHS/SOL at San Diego State University]
Acknowledgements
The authors thank the staff and participants of HCHS/SOL for their important contributions. The Hispanic Community Health Study/ Study of Latinos was carried out as a collaborative study supported by contracts from the National Heart, Lung, and Blood Institute (NHLBI) to the University of North Carolina (N01-HC65233), University of Miami (N01-HC65234), Albert Einstein College of Medicine HC65235), Northwestern University (N01-HC65236) and San Diego State University (N01-HC65237). The following Institutes/Centers/Offices contribute to the HCHS/SOL through a transfer of funds to the NHLBI: National Institute on Minority Health and Health Disparities, National Institute on Deafness and Other Communication Disorders, National Institute of Dental and Craniofacial Research, National Institute of Diabetes and Digestive and Kidney Diseases, National Institute of Neurological Disorders and Stroke, NIH Institution-Office of Dietary Supplements. This study was also supported by the Intramural Program of the National Institute of Diabetes and Digestive and Kidney Diseases. The Genetic Analysis Center at the University of Washington was supported by NHLBI and NIDCR contracts (HHSN268201300005C AM03 and MOD03).
Conflict of interest:None declared.
References
1. Chen Y, Wu F, Liu M, Parvez F, Slavkovich V, Eunus M. A pro-spective study of arsenic exposure, arsenic methylation capacity, and risk of cardiovascular disease in Bangladesh.Environ Health Perspect2013;121:832–38.
2. Drobna´ Z, Razo LMD, Garcı´a-Vargas GG, Sa´nchez-Pe~na LC, Barrera-Herna´ndez A, Styblo M. Environmental exposure to ar-senic, AS3MT polymorphism and prevalence of diabetes in Mexico.J Expo Sci Environ Epidemiol2012;23:jes2012103. 3. Balakrishnan P, Vaidya D, Franceschini Net al. Association of
cardiometabolic genes with arsenic metabolism biomarkers in American Indian communities: the Strong Heart Family Study (SHFS).Environ Health Perspect2016;125:15–22.
4. Su C-T, Lin H-C, Choy C-S, Huang K, Huang S-R, Hsueh Y-M. The relationship between obesity, insulin and arsenic methyl-ation capability in Taiwan adolescents.Sci Total Environ2012;
414:152–58.
5. World Health Organization. WHO Chemical Fact Sheet: Arsenic, 2018. https://www.who.int/water_sanitation_health/water-quality/ guidelines/chemicals/arsenic-fs-new.pdf (12 March 2019, date last accessed).
6. Farzan SF, Karagas MR, Jiang Jet al. Gene-arsenic interaction in longitudinal changes of blood pressure: findings from the Health Effects of Arsenic Longitudinal Study (HEALS) in Bangladesh.
Toxicol Appl Pharmacol2015;288:95–105.
7. Jiang J, Liu M, Parvez Fet al. Association between arsenic expo-sure from drinking water and longitudinal change in blood pres-sure among HEALS cohort participants. Environ Health Perspect2015;123:806–12.
8. Maull EA, Ahsan H, Edwards J et al. Evaluation of the association between arsenic and diabetes: a National Toxicology Program workshop review.Environ Health Perspect
2012;120:1658–70.
9. Hughes MF. Arsenic toxicity and potential mechanisms of ac-tion.Toxicol Lett2002;133:1–16.
10. Styblo M, Drobna´ Z, Jaspers I, Lin S, Thomas DJ. The role of biomethylation in toxicity and carcinogenicity of arsenic: a re-search update.Environ Health Perspect2002;110:767–71. 11. Drobna Z, Styblo M, Thomas DJ. An overview of arsenic
metab-olism and toxicity.Curr Protoc Toxicol2009;42:4.31.1–31.6. 12. Ayala GX, Baquero B, Klinger S. A systematic review of the
rela-tionship between acculturation and diet among Latinos in the United States: implications for future research.J Am Diet Assoc
2008;108:1330–44.
13. Bulka CM, Davis MA, Karagas MR, Ahsan H, Argos M. The unintended consequences of a gluten-free diet. Epidemiology
2017;28:e24–e25.
14. Davis MA, Mackenzie TA, Cottingham KL, Gilbert-Diamond D, Punshon T, Karagas MR. Rice consumption and urinary arse-nic concentrations in U.S. children.Environ Health Perspect
2012;120:1418–24.
15. Mantha M, Yeary E, Trent Jet al. Estimating inorganic arsenic exposure from U.S. rice and total water intakes.Environ Health Perspect2017;125:057005.
16. Ciminelli VST, Gasparon M, Ng JC, Silva GC, Caldeira CL. Dietary arsenic exposure in Brazil: the contribution of rice and beans.Chemosphere2017;168:996–1003.
17. Davey Smith G, Ebrahim S. ‘Mendelian randomization’: can ge-netic epidemiology contribute to understanding environmental determinants of disease?Int J Epidemiol2003;32:1–22. 18. Burgess S, Zuber V, Valdes-Marquez E, Sun BB, Hopewell JC.
Mendelian randomization with fine-mapped genetic data: choos-ing from large numbers of correlated instrumental variables.
Genet Epidemiol2017;41:714–25.
19. Gao J, Tong L, Argos Met al. The genetic architecture of arsenic metabolism efficiency: a SNP-based heritability study of Bangladeshi adults.Environ Health Perspect2015;123:985–92. 20. Pierce BL, Tong L, Argos Met al. Arsenic metabolism efficiency
has a causal role in arsenic toxicity: Mendelian randomization and gene-environment interaction.Int J Epidemiol2013;42:1862–71. 21. Pierce BL, Tong L, Argos Met al. Abstract LB-159: a missense
vari-ant in FTCD is associated with arsenic metabolism efficiency and ar-senic toxicity in Bangladesh.Cancer Res2017;77(Suppl 13):LB-159. 22. Navas-Acien A, Umans JG, Howard BVet al. Urine arsenic con-centrations and species excretion patterns in American Indian communities over a 10-year period: the Strong Heart Study.
Environ Health Perspect2009;117:1428–33.
23. Lavange LM, Kalsbeek WD, Sorlie PDet al. Sample design and cohort selection in the Hispanic Community Health Study/Study of Latinos.Ann Epidemiol2010;20:642–49.
25. Law MR, Morris JK, Wald NJ. Use of blood pressure lowering drugs in the prevention of cardiovascular disease: meta-analysis of 147 randomised trials in the context of expectations from pro-spective epidemiological studies.BMJ2009;338:b1665. 26. Evans JL, Balkan B, Chuang E, Rushakoff RJ. Oral and
inject-able (non-insulin) pharmacological agents for type 2 diabetes. In: De Groot LJ, Chrousos G, Dungan K et al (eds). Endotext [Internet]. South Dartmouth, MA: MDText.com, Inc., 2016. 27. Wallace TM, Levy JC, Matthews DR. Use and abuse of HOMA
modeling.Diabetes Care2004;27:1487–95.
28. McAuley KA, Williams SM, Mann JIet al. Diagnosing insulin resis-tance in the general population.Diabetes Care2001;24:460–64. 29. Siega-Riz AM, Sotres-Alvarez D, Ayala GXet al. Food-group
and nutrient-density intakes by Hispanic and Latino back-grounds in the Hispanic Community Health Study/Study of Latinos123.Am J Clin Nutr2014;99:1487–98.
30. Jansen RJ, Argos M, Tong Let al. Determinants and consequen-ces of arsenic metabolism efficiency among 4, 794 individuals: demographics, lifestyle, genetics, and toxicity.Cancer Epidemiol Biomarkers Prev2016;25:381–90.
31. Primatesta P, Falaschetti E, Gupta S, Marmot MG, Poulter NR. Association between smoking and blood pressure: evidence from the health survey for England.Hypertension2001;37:187–93. 32. Keto J, Ventola H, Jokelainen Jet al. Cardiovascular disease risk
factors in relation to smoking behaviour and history: a population-based cohort study.Open Heart2016;3:e000358. 33. Handa K, Tanaka H, Shindo M, Kono S, Sasaki J, Arakawa K.
Relationship of cigarette smoking to blood pressure and serum lipids.Atherosclerosis1990;84:189–93.
34. Li G, Wang H, Wang Ket al. The association between smoking and blood pressure in men: a cross-sectional study.BMC Public Health2017;17:797.
35. Conomos MP, Laurie CA, Stilp AMet al. Genetic diversity and association studies in US Hispanic/Latino populations: applica-tions in the Hispanic Community Health Study/Study of Latinos.
Am J Hum Genet2016;98:165–84.
36. The 1000 Genomes Project Consortium. A global reference for human genetic variation.Nature2015;526:68–74.
37. Delaneau O, Zagury J-F, Marchini J. Improved whole-chromosome phasing for disease and population genetic studies.
Nat Methods2013;10:5–6.
38. Howie B, Marchini J, Stephens M. Genotype imputation with thousands of genomes.G3 (Bethesda)2011;1:457–70.
39. Hartwig FP, Davies NM, Hemani G, Davey Smith G. Two-sam-ple Mendelian randomization: avoiding the downsides of a pow-erful, widely applicable but potentially fallible technique.Int J Epidemiol2016;45:1717–26.
40. Conomos MP, Gogarten SM, Brown Let al. GENESIS: Genetic Estimation and Inference in Structured samples (GENESIS): Statistical methods for analyzing genetic data from samples with population structure and/or relatedness, 2019. R package version 2.12.4. https://bioconductor.org/packages/devel/bioc/manuals/ GENESIS/man/GENESIS.pdf(12 March 2019, date last accessed). 41. R Development Core Team.R: A Language and Environment for Statistical Computing, version3.2.2. Vienna: R Foundation for Statistical Computing, 2017.
42. Sofer T, Baier LJ, Browning SRet al. Admixture mapping in the Hispanic Community Health Study/Study of Latinos reveals
regions of genetic associations with blood pressure traits.PLoS One2017;12:e0188400.
43. Whelton PK, Carey RM, Aronow WSet al. Guideline for the pre-vention, detection, evaluation, and management of high blood pressure in adults: a report of the American College of Cardiology/American Heart Association Task Force on Clinical Practice Guidelines.Hypertension2017;71:e13–e115.
44. American Diabetes Assosiation. Diagnosis and classification of diabetes mellitus.Diabetes Care2011;34:S62–69.
45. Daviglus ML, Pirzada A, Talavera GA. Cardiovascular disease risk factors in the Hispanic/Latino Population: lessons from the Hispanic Community Health Study/Study of Latinos (HCHS/ SOL).Prog Cardiovasc Dis2014;57:230–36.
46. Schneiderman N, Llabre M, Cowie CCet al. Prevalence of diabe-tes among Hispanics/Latinos from diverse backgrounds: the Hispanic Community Health Study/Study of Latinos (HCHS/ SOL).Diabetes Care2014;37:2233–39.
47. Chen C-J, Wang S-L, Chiou J-Met al. Arsenic and diabetes and hypertension in human populations: a review. Toxicol Appl Pharmacol2007;222:298–304.
48. Abhyankar LN, Jones MR, Guallar E, Navas-Acien A. Arsenic exposure and hypertension: a systematic review.Environ Health Perspect2012;120:494–500.
49. Moon KA, Guallar E, Umans JGet al. Association between ex-posure to low to moderate arsenic levels and incident cardiovas-cular disease: a prospective cohort study.Ann Intern Med2013;
159:649–59.
50.Miami-Dade County’s2016Water Quality Report, 2016. http:// www.miamidade.gov/water/library/reports/water-quality-2016. pdf(12 March 2019, date last accessed).
51.New York City2016Drinking Water Supply and Quality Repor, 2016. http://www.nyc.gov/html/dep/pdf/wsstate16.pdf (12 March 2019, date last accessed).
52.Chicago Water Quality Report2016, 2016. https://www.cityof chicago.org/content/dam/city/depts/water/WaterQltyResultsNRpts/ ccReports/cca2016_Q1-4.pdf(12 March 2019, date last accessed). 53.San Diego2016Annual Drinking Water Quality Report, 2016.
https://www.sandiego.gov/sites/default/files/2016_annual_drink ing_water_quality_report.pdf (12 March 2019, date last accessed).
54. Staley JR, Blackshaw J, Kamat MAet al. PhenoScanner: a database of human genotype-phenotype associations.
Bioinformtics2016;32:3207–9.
55. Melkonian S, Argos M, Pierce BLet al. A prospective study of the synergistic effects of arsenic exposure and smoking, sun exposure, fertilizer use, and pesticide use on risk of premalignant skin lesions in Bangladeshi men.Am J Epidemiol2011;173:183–91.
56. Chen Y, Graziano JH, Parvez Fet al. Modification of risk of arsenic-induced skin lesions by sunlight exposure, smoking, and occupational exposures in Bangladesh.Epidemiology2006;17: 459–67.
57. Hertz-Picciotto I, Smith AH, Holtzman D, Lipsett M, Alexeeff G. Synergism between occupational arsenic exposure and smok-ing in the induction of lung cancer.Epidemiology1992;3:23. 58. Li X, Li B, Xi S, Zheng Q, Lv X, Sun G. Prolonged
59. Chen Y, Ahsan H, Slavkovich Vet al. No association between ar-senic exposure from drinking water and diabetes mellitus: a cross-sectional study in Bangladesh. Environ Health Perspect
2010;118:1299–305.
60. Burgess S, Thompson SG. Use of allele scores as instrumental variables for Mendelian randomization.Int J Epidemiol2013;
42:1134–44.
61. Burgess S, Thompson SG. Interpreting findings from Mendelian randomization using the MR-Egger method.Eur J Epidemiol
2017;32:377–89.
62. Burgess S, Butterworth A, Thompson SG. Mendelian randomiza-tion analysis with multiple genetic variants using summarized data.Genet Epidemiol2013;37:658–65.
63. Gomez-Rubio P, Meza-Montenegro MM, Cantu-Soto E, Klimecki WT. Genetic association between intronic variants in AS3MT and arsenic methylation efficiency is focused on a large linkage disequi-librium cluster in chromosome 10.J Appl Toxicol2010;30:260–70. 64. Engstro¨m K, Vahter M, Mlakar SJet al. Polymorphisms in arse-nic (þIII oxidation state) methyltransferase (AS3MT) predict gene expression of AS3MT as well as arsenic metabolism.
Environ Health Perspect2011;119:182–88.
65. Agusa T, Iwata H, Fujihara Jet al. Genetic polymorphisms in AS3MT and arsenic metabolism in residents of the Red River Delta, Vietnam.Toxicol Appl Pharmacol2009;236:131–41. 66. Beebe-Dimmer JL, Iyer PT, Nriagu JOet al. Genetic variation in
glutathione S-transferase omega-1, arsenic methyltransferase and methylene-tetrahydrofolate reductase, arsenic exposure and blad-der cancer: a case–control study.Environ Health2012;11:43.
67. Didelez V, Sheehan N. Mendelian randomization as an instru-mental variable approach to causal inference.Stat Methods Med Res2007;16:309–30.
68. Argos M, Kalra T, Pierce BLet al. A prospective study of arsenic exposure from drinking water and incidence of skin lesions in Bangladesh.Am J Epidemiol2011;174:185–94.
69. Watkins D, Rosenblatt DS. Update and new concepts in vitamin responsive disorders of folate transport and metabolism.
J Inherit Metab Dis2012;35:665–70.
70. Pierce BL, Ahsan H, VanderWeele TJ. Power and instrument strength requirements for Mendelian randomization studies using multiple genetic variants. Int J Epidemiol 2011;40: 740–52.
71. Haycock PC, Burgess S, Wade KH, Bowden J, Relton C, Davey Smith G. Best (but oft-forgotten) practices: the design, analysis, and interpretation of Mendelian randomization studies. Am J Clin Nutr2016;103:965–78.
72. Sofer T, Heller R, Bogomolov Met al. A powerful statistical framework for generalization testing in GWAS, with application to the HCHS/SOL.Genet Epidemiol2017;41:251–58.
73. Hindorff LA, Sethupathy P, Junkins HAet al. Potential etiologic and functional implications of genome-wide association loci for human diseases and traits.Proc Natl Acad Sci U S A2009;106: 9362–67.