Independent Benchmark Report
Building a 12 Petabyte Data Warehouse
withSAP HANA Data Platform
And SAP Partners
Technology Services Hewlett Packard 3000 Hannover Palo Alto, CA 94304 Technology Alliances SAP 1 Sybase Drive Dublin, CA 94568 BMMsoft
225 Bush Street, 16 Floor San Francisco, CA 94104
In April and May 2014, at SAP’s request, InfoSizing conducted an independent audit of a benchmark execution on the following configuration, assembled at the SAP/Intel Petascale lab in Santa Clara, California:
SAP HANA Data Platform with BMMsoft Federated EDMT® on a cluster of HP DL580 G7 servers and NetApp E5460 storage arrays The database was populated from a record-breaking 12.1 Petabyte of pure raw data. In total, the database heldover 221 Trillion transactional records and over 100 Billion unstructured documents, such as emails, SMS and images. It captured communication data as generated by 30 Billion sources (users, smart sensors, mobile devices, etc.) The 12.1 PB were loaded in just four days, demonstrating an average ingest speed of 3 PB per day.
The unprecedented volume of data, combining structured and unstructured types, generated for this benchmark represents a real-world scenario comparable to the type of activities taking place across worldwide financial trading networks, health payment systems, oil exploration and production operations or mobile device networks over multiple years. The unstructured data was representative of email, social messaging, images, documents, audio and videos commonly found in these scenarios.
The configuration of the benchmark environment, the population of the data warehouse and the execution of the query scenarios were independently verified by InfoSizing who also collected and analyzed the results of the measurements.
The attached report is an independent attestation of the capabilities and performance results detailed herein.
Respectfully Yours,
François Raab President
Executive Summary
Through the combined effort of the following SAP partners: BMMsoft
HP NetApp Intel Red Hat
A new Guinness World Record for the World’s Largest Database was set using a data warehouse for big data analytics build around the following configuration:
SAP HAHA Data Platform BMMsoft Federated EDMT 9 HP Proliant DL580 G7 servers
NetApp E5460 storage arrays
This independently audited benchmark demonstrated the following accomplishments:
12.1 PB of mixed Structured and Unstructured data loaded an indexed: o 221 Trillion rows (stock trades, credit card payments, sensor input, etc.)
loaded at a speed ofover 2 Trillion rows or 90 TB per hour.
o 100 Billion documents (SMS, email, reports, multimedia) loaded and indexed at a speed of 1 Billion documents or 25 TB per hour.
o 30 Billion sources (users, smart sensors, mobile devices, etc.) of communication captured in the data warehouse.
3 PB per day of overall ingest speed over four days.
As low as 90 millisecond Ready-Time measuredfor data freshly added to the data warehouse.
85% data compression achieved by storing 12.1 Petabyte of transactional data in 1.8 Petabyte of actual disk space.
90%reduction in CO2 emission achieved by reducing the number of disk drives needed for storage.
Federated queries to combine data from structured and unstructured sources for cross-correlation of unified data.
Configuration Overview
Components DetailsThe production-class environment assembled for this benchmark was built around the following components:
Software Stack
• BMMsoft Federated EDMT® 9 with UCM • SAP HANA SP7 o 4 Active nodes o 1 Standby node o SuSE SLES 11 SP2 • SAP IQ Multiplex SP3 o 19 Server nodes o 1 Coordinator node
o Red Hat Enterprise Linux 6.4 X86-64
Compute Cluster
• 25 x HP ProLiant DL580 G7 nodes, each with
o 4 x Intel® Xeon® E7-4870 (2.4GHz, 10 cores, 30MB L3) o 1TB RAM
o 8 x 900GB SAS 10Krpm o 2 x 10 Gb Ethernet
o PCI-e 8Gb dual-port FC HBA
Storage Subsystem
• 20 x NetApp E5460 Storage Arrays, each with o 60 x 3TB 7.2Krpm
o 12 x 10TB DDP LUN
o 4 FC connections (Active/Active)
• 10 x NetApp DE6600 Disk Enclosure, each with o 60 x 3TB 7.2Krpm
o 12 x 10TB DDP LUN
Connectivity
Configuration Diagram
The following diagram depicts the platform used in this benchmark:
Memory Allocation
The allocation of the main memory on the HP DL580 G7 nodes was as follows: Each SAP IQ node ran on 40 Intel Nehalem cores (80 threads) and was
allocated about 750 GB of main memory.
Each SAP HANA node ran on 40 Intel Nehalem cores (80 threads) and was allocated about 850 GB of main memory.
About 200 GB of main memory was made available to the SAP IQ load process and used to cache portions of input data files during the database population.
The BMMsoft EDMT Server ran on 40 Intel Nehalem cores (80 threads) and was allocated about 200 GB of main memory.
RedHat Enterprise Linux (RHEL) was the OS on all SAP SAP IQ server nodes and was allocated 20 GB of main memory.
Data Warehouse Architecture
The architecture of the data warehouse used in the benchmark was built around the SAP HANA Data Platform. Database population and data access was done through BMMsoft Federated EDMT, giving a single “database image” of the data stored in SAP HANA and SAP IQ. Following is a summary of some key features of the products supporting the data warehouse.
BMMsoft Federated EDMT
The Federated EDMT data model spans all EDMT instances and can also include non-EDMT sources, such as external documents stored outside of SAP HANA or SAP IQ.
The following components make up the Federated EDMT model:
Federated ETL: Configured to load data to specified EDMT instance or to multiple EDMT instances.
Federated Query: Communicates with all EDMT instances splits query requests and merges query results.
EDMT Configurator: Controls data present in various instances, such as removing old data from SAP HANA while still keeping that old data in SAP IQ.
The features offered by EDMT also include capabilities that are well adapted to a cloud deployment.
Multi-tenant data separation: Each tenant/user’s data is maintained within its own domain and data access is prevented from spanning multiple domains.
Tenant centric resource management: Management, monitoring and accounting of system resources (storage, IO, CPU, etc.) is individualized by tenant.
Elasticity: CPU resources (nodes) and storage capacity can be added or removed dynamically without disrupting the existing operational environment.
During the benchmark set-up and execution all functions were performed through remote access using EDMT’s client-based applications. Operator intervention was only needed when hardware components were initially installed or added into the configuration.
SAP HANA
SAP HANA is multipurpose in-memory database. It is designed to combine the use of intelligent in-memory database technology with columnar data storage, high level compression and massively parallel query processing. HANA is also designed for interactive business application by providing full transactional support.
SAP HANA can operate as a distributed system running on multiple nodes. In this configuration, some of the servers are designated as worker nodes, and other as standby nodes. Multiple nodes can be grouped together and a dedicated standby node can be assigned to the group. In this configuration the standby node is kept ready in the event that a failover occurs during processing. The standby host is not used for database processing. While all the database processes run on the standby node, they are idle and do not allow SQL connections.
SAP IQ Multiplex
SAP IQ Multiplex is a multi-node, shared storage, parallel relational database system that is designed to address the needs of small scale to very large scale data warehousing workloads and implementations. IQ Multiplex was configured with multiple instances of the IQ engine (nodes), each running on a separate server and all connected to a shared IQ data store (shared disk cluster). Unlike horizontally partitioned databases such as massively parallel processors (MPP) with a shared-nothing architecture, each SAP IQ node sees and has direct physical access to the entire database.
SAP IQ Multiplex uses Distributed Query Processing (DQP) to spread query processing across multiple servers. When the SAP IQ query optimizer determines that a query might require more CPU resources than are available on a single node, it will attempt to break the query into parallel “fragments” that can be executed concurrently on other nodes. The DQP process consists in dividing the query into multiple, independent pieces of work, distributing that work to other nodes, and collecting and organizing the intermediate result sets to generate the final query result..
IQ Multiplex also uses a hybrid cluster architecture that involves shared storage for database content and independent node storage for catalog metadata, private temporary data, and transaction logs. If a query does not fully utilize the CPU resources on a single node, it can be fully executed on a single node without the need to communicate with the other nodes in the IQ cluster.
Data Warehouse Preparation
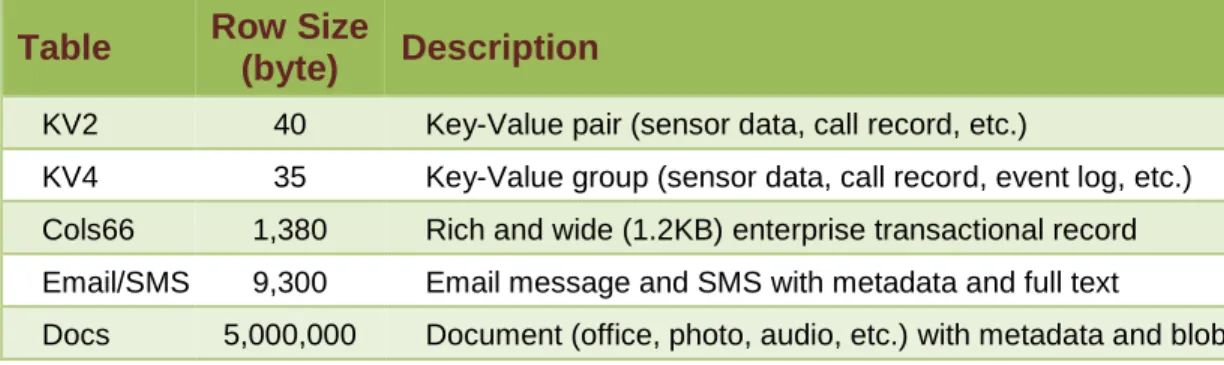
Mixed Data TypesTo be representative of modern data warehouses and big data analytics systems, the benchmark included a mix of conventional data types and unstructured data types. Each data type was captured in a set of tables. During the querying phase, tables of the same type could be combined using a union operator.
The tables holding each data type, and the approximate row size in each table, were defined as follows:
Table Row Size
(byte) Description
KV2 40 Key-Value pair (sensor data, call record, etc.)
KV4 35 Key-Value group (sensor data, call record, event log, etc.) Cols66 1,380 Rich and wide (1.2KB) enterprise transactional record Email/SMS 9,300 Email message and SMS with metadata and full text
Docs 5,000,000 Document (office, photo, audio, etc.) with metadata and blob
The tables holding unstructured data types (Email/SMS and Docs) contained both a large unstructured payload (blob) and metadata about the content of the payload. This metadata is representative of what BMMsoft EDMT would generate when ingesting the data into the data store. This process of “textraction” is designed to accommodate new data types without making changes to the structure of the underlying data store. This is done by adding new “textractor” any time new data type is introduced.
In some cases, it is more efficient to keep the payload outside of the SAP IQ database and to store only the metadata. Federated EDMT can then combine the external payload storage with the metadata retrieved from the SAP HANA Data Platform. To represent this scenario, approximately 1% of the documents (Docs) were ingested without their payload.
Pure Raw Data
The data load into the data warehouse was made of comma separated flat files. The content of each flat file was “cloned” multiple times to achieve the desired scale.
The size of the raw data set ingested into the data warehouse is reported as pure raw data, where commas separating the column values were subtracted from the flat file sizes. The data set size was measured in Megabyte (MB) and reported at higher orders of magnitude for best readability (1TB = 106MB, 1PB = 109MB).
Scaling from 100TB to 12.1PB
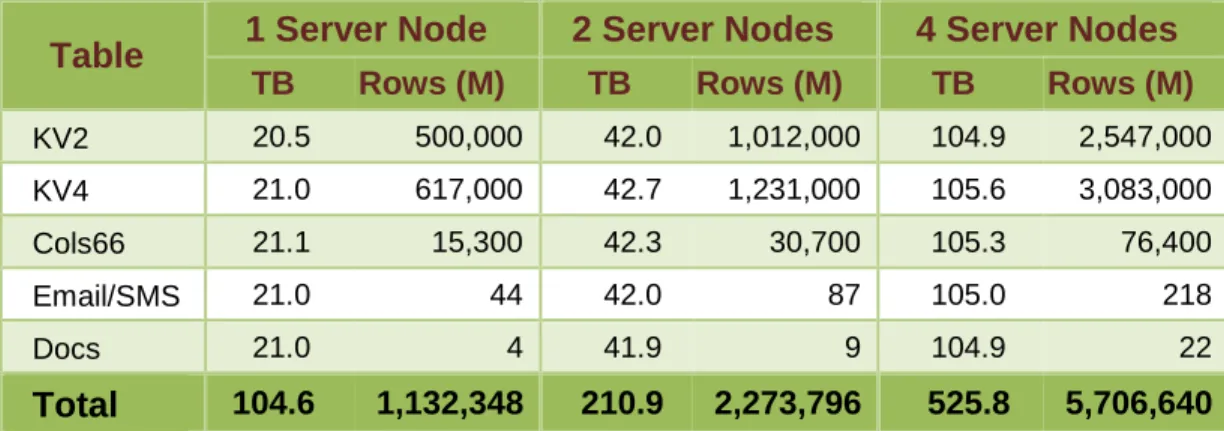
During the initial stage of the benchmark the data warehouse was loaded with small subsets of the target population. These initial load steps were used to calibrate the system, obtain early measurements and demonstrate the following scaling capabilities:
• Scaling from 100 TB to 500 TB (0.5 PB) of data volumes.
• Scaling from 1 to 4 cluster nodes while accessing the same shared storage subsystem.
The following table outlines the scaling of the data warehouse population as the number of SAP IQ server nodes is increased from 1 to 4.
Table 1 Server Node 2 Server Nodes 4 Server Nodes
TB Rows (M) TB Rows (M) TB Rows (M)
KV2 20.5 500,000 42.0 1,012,000 104.9 2,547,000 KV4 21.0 617,000 42.7 1,231,000 105.6 3,083,000 Cols66 21.1 15,300 42.3 30,700 105.3 76,400 Email/SMS 21.0 44 42.0 87 105.0 218 Docs 21.0 4 41.9 9 104.9 22 Total 104.6 1,132,348 210.9 2,273,796 525.8 5,706,640
Once the system calibration and ingest speeds were established, the data warehouse was re-initialized to be ready for the 12.1 PB load test.
Dimension Tables
The 12.1 PB data set represents information generated or associated with 30 Billion unique data sources. A data source can be an individual, a user login id, an email address, a mobile device, a smart sensor or any other identifier of the source or context of the data element in the data set.
The list of data sources, along with current and historical information about these data sources (such as address or location with occasional updates) was loaded in the data warehouse and used as dimension tables. Smaller dimension tables were also created to complete the business scenario for the benchmark. The following is an outline of the dimension tables that were created:
Table Rows Description
Source 30B Data source (user id, mobile device, smart sensor, etc.) Source-data 47B Current and historical information about data sources Vendor 300 List of vendors for sensors, mobile devices, etc.
Index Definition
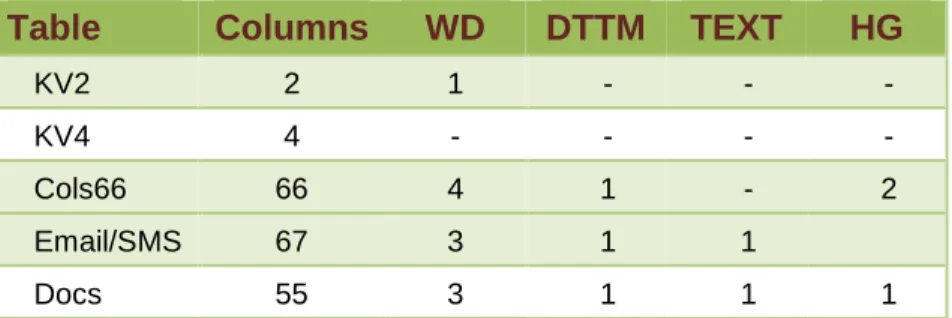
The SAP HANA Data Platform supports a number of indexing options. Following is the list of index types used in the data warehouse.
• Word (WD): Index on words from a string data types column. • Datetime (DTTM): Index on date & time column.
• Text (TEXT): Index on an unstructured data analytics column. • High_Group (HG): Index on an integer data types column.
The following indexes were defined in SAP IQ prior to loading data in the data warehouse:
Table Columns WD DTTM TEXT HG
KV2 2 1 - - -
KV4 4 - - - -
Cols66 66 4 1 - 2
Email/SMS 67 3 1 1
Docs 55 3 1 1 1
The above index definition provided for broader range of options during the query phase of the benchmark.
Load Platform Set-Up
All 25 SAP HANA Data Platform nodes were involved in this load test (4 HANA active nodes, 1 HANA Standby node, 19 IQ server nodes and 1 IQ Coordinator node). Optimizing the number of SAP HANA Data Platform nodes was not a goal in this test. The CPU utilization on each node remained far below saturation during the load and the load speed was constrained by components within the storage subsystem.
Using the information gathered during the initial load phases, an ingest data set was created for each table. The size of each data set and its partitioning in multiple load streams was designed to result in nearly equal load time for each table. The intent was to start all load streams simultaneously and to have them all finish at close to the same time.
Loading 12.1 Petabyte
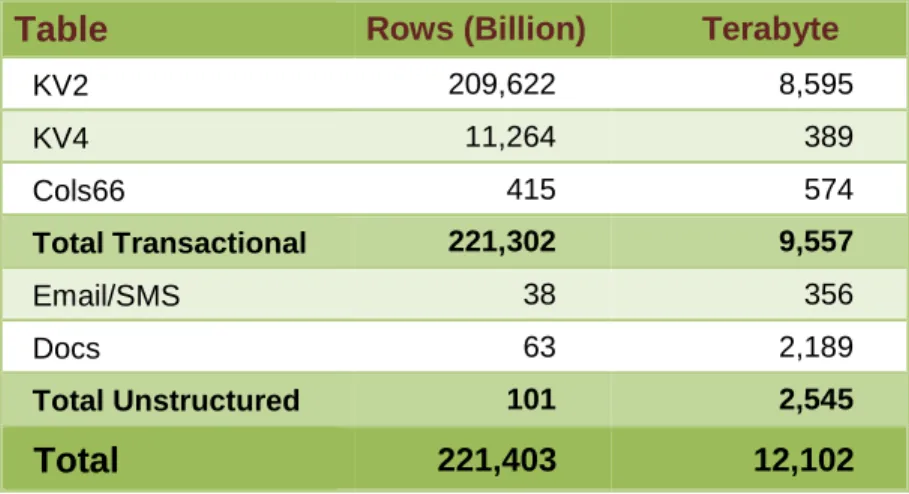
Raw Data VolumeThe total size of the raw data ingested during the 4 days of the data load test is reported below.
The following table represents pure raw data as described in the previous section.
Table Rows (Billion) Terabyte
KV2 209,622 8,595 KV4 11,264 389 Cols66 415 574 Total Transactional 221,302 9,557 Email/SMS 38 356 Docs 63 2,189 Total Unstructured 101 2,545 Total 221,403 12,102 Load Speed
During the benchmark execution, the load test ran for over 4 days and all load streams completed within an interval of 25 minutes.
The following table summarizes the load speed achieved overall and for the various data types.
Table Rows/Hour (B) Terabyte/Hour
KV2 2,015 83 KV4 108 3.7 Cols66 4.0 5.5 Total Transactional 2,128 92 Email/SMS 0.37 3.4 Docs 0.61 21.1 Total Unstructured 0.98 25 Total 2,129 117
Query Performance
New Data Ready-TimeIn an environment where new data is constantly generated in real time, the speed at which that new data can be added to the data warehouse and be seen by running queries is a crucial metric. The delay between ingesting a new piece of data and it’s visibility to running queries is called the “Ready-Time”.
To measure the Ready-Time, micro batches of rows are loaded into the database within a single commit boundary. Once the new data is committed, it is instantaneously visible to queries. The Ready-Time is therefore determined by the load time of the micro batch of newly ingested rows.
For rows of the KV2 and KV4 data types, loaded in batches of 1,000 rows, the Ready-Time was measured at less than 100ms.
The following graph shows the average Ready-Time for load batches from 100 rows to 10M rows. For each batch size the time to load the batch and query the resulting data is reported in milliseconds.
Query Response Time
The population of the 12.1 Petabyte data warehouse was validated by executing pin-point and multi-table queries involving the views representing the global fact tables, as well as some dimension tables. Executing these queries served to verify that the data warehouse was fully operational and that query response times were kept within acceptable ranges. Queries were created to target indexed as well as non-indexed views to evaluate the
The following table illustrates some of the queries that were executed, the number of rows targeted by the query (in Billions) and the average response times (RT), measured in seconds.
Query Index Billion
Rows RT
Reporting on Documents (Docs) WD 1 1.2
Pin-point on message header (Email/SMS) No 38 4.2
List sensors with selected status (KV4) WD 0.5 0.4
List sensor data grouped by time (KV4) WD 0.5 0.8
Pin-point on Documents (Docs) No 63 7.3
Storage Efficiency
Data compressionThe SAP HANA Data Platform reports that approximately 1.8PB (1,818,710GB) of space was used to store and index the 12.1PB of the data warehouse. This translates into an 85% compression ratio.
Raw Data Disk Space IQ Allocation Used Space
12.1 PB 5.4 PB 3.3 PB 1.8 PB
CO2 Reduction
A reduction in the electrical power needed to operate a data warehouse can be directly translated into a reduction of global CO2 emission. Given the measure of data compression achieved by the benchmark configuration, a corresponding level of reduction in CO2 emission can be computed.
The storage space needed by other, more conventional data warehouse solutions is typically greater than the size of the raw data populating it. Using a “row store” model with a medium level of indexing can results in storage requirements that are several times the size of the initial raw data.
In contrast, the 12.1 Petabyte data warehouse demonstrated an 85% data compression ratio. Because of this very substantial level of data compression, the benchmarked configuration required less than 10% of the electricity consumed by other, more conventional solutions. Similarly, the floor space, size and weight of the configured storage devices can also be reduced by at least 90%.
Life-Cycle Savings
According to its technical specifications, and factoring a standard 50% power overhead for cooling, the power consumption of the tested storage subsystem was 42KW, totaling over 360MWh for a full year of operation. Conventional solutions with similar data capacity and performance levels would require about ten times more storage devices and consume over 3,600MWh per year.
Based on the generally accepted “pollution factor” of 0.6 Kilogram of CO2 per KWh, the SAP HANA Data Platform would reduce CO2 emission by 6,000 Tons during its initial 3 years of operation.
By the end of its life cycle, the benchmarked configuration is also expected to have reduced by 28 Tons the volume of end-of-life storage devices to be discarded.
Federated EDMT
Mixed Data Types Cross-Correlation
Transactional and unstructured data can be cross-correlated within BMMsoft Federated EDMT. Unstructured objects are analyzed in real-time when inserted into the data warehouse and the resulting metadata for each object is stored in the data warehouse. The screen-shot below illustrates how project folders can be created to organize emails, attachments and other unstructured objects. These folders are automatically populated based on predefined and user-defined rules. A wide range of textual and numerical parameters for relational and full-text search, as well as cross-correlation of unified data can be entered on the right side of the screen.
The results of complex Federated EDMT analysis are displayed in a unified view. Emails, documents and transactions are seamlessly analyzed, in real time, and integrated results can be displayed or exported to a file. The screen-shot below illustrates how potentially fraudulent stock trades, insider trading or other targeted events can be captured in real time.
Regulatory Compliance & Data Retention
BMMsoft Federated EDMT uses external WORM storage subsystems to comply with the regulatory data retention requirements (SOX NASD, SEC 17a-4, HIPAA, GLBH, etc.) The following screen-shot illustrates how Federated EDMT can be configured to automatically store new data (such as email, attachments or other unstructured documents) in external WORM devices, in its underlying storage servers (such as the SAP HANA Data Platform) or simultaneously in both.
Subject: Notifier test [email_ID = 47938]
Subject: Notifier test [email_ID = 47938]
Tagging & Fusion Search
BMMsoft Federated EDMT provides for improved tagging and Fusion Search, such as: Fast tagging of emails, documents and transactions with eDiscovery tags on a
per-project basis used for audit, investigation, fraud detection and compliance. Fast and flexible search of eDiscovery tags.
Fast, single-click review and tagging of emails, documents and transactions used for instant review and tagging of suspicious data by compliance, fraud or other enforcement officers. Compliance tags have options for individual and group tagging to further accelerate the process. Additional logic select random sample of emails, documents and transactions as mandated by regulations (e.g. SEC, FTC ,FINRA etc.)
Mouseover will display all metadata, eDiscovery, compliance and project-based tags, as well as sentiment data about emails, documents and transactions. Use of mouseover provides for efficient access to tags, faster reviews and increased user productivity, as illustrated in the following screenshot.
Sentiment Analysis Engine
Sentiment analysis uses textual analytics focused on extracting sentiment-related meta-data. During the loading phase, or at a later time, Federated EDMT can be set to extract, store and index sentiment information from all emails and documents.
On the Fusion View page users can search the entire data corpus of emails, document and transactions using various criteria – including sentiments. A single-key access to the Sentiment Search page provides for easy drill-downs by searching by sentiments, entities, themes, topics, scores and other text analytics criteria. These can be combined with all other SQL and text search parameters. The built-in graphic visualization dashboard increases user productivity.
Examples of the sentiment analysis searches available include: Document Sentiment: The overall tone of the document.
Entities: People, places, dates, companies and other entity types; with its frequency and sentiment in the text.
Summary: The most important sentences in the document.
Themes: The most important concepts in the document, ordered by the importance of that theme to the text.
Concept Topics: Topics are classifiers based on Wikipedia content. Words within documents are automatically associated with a Concept Topic, based on their definition.
Dashboard Analytics
From the Fusion View page, users have single-key access to analytics that address “what should I know” problems, even when no such problem has been specifically defined. Users are provided with “advanced analytics” capabilities. With this type of analysis, users can start with a high-level overview and then get full data insight by drilling-down in an ad-hoc manner on relevant topics.
Some software products marketed by SAP AG and its distributors contain proprietary software components of other software vendors. Microsoft, Windows, Excel, Outlook, and PowerPoint are registered trademarks of Microsoft Corporation.
IBM, DB2, DB2 Universal Database, System i, System i5, System p, System p5, System x, System z, System z10, System z9, z10, z9, iSeries, pSeries, xSeries, zSeries, eServer, z/VM, z/OS, i5/OS, S/390, OS/390, OS/400, AS/400, S/390 Parallel Enterprise Server, PowerVM, Power Architecture, POWER6+, POWER6, POWER5+, POWER5, POWER, OpenPower, PowerPC, BatchPipes, BladeCenter, System Storage, GPFS, HACMP, RETAIN, DB2 Connect, RACF, Redbooks, OS/2, Parallel Sysplex, MVS/ESA, AIX, Intelligent Miner, WebSphere, Netfinity, Tivoli and Informix are trademarks or registered trademarks of IBM Corporation.
Linux is the registered trademark of Linus Torvalds in the U.S. and other countries.
Adobe, the Adobe logo, Acrobat, PostScript, and Reader are either trademarks or registered trademarks of Adobe Systems Incorporated in the United States and/or other countries.
Oracle is a registered trademark of Oracle Corporation.
UNIX, X/Open, OSF/1, and Motif are registered trademarks of the Open Group.
Citrix, ICA, Program Neighborhood, MetaFrame, WinFrame, VideoFrame, and MultiWin are trademarks or registered trademarks of Citrix Systems, Inc.
HTML, XML, XHTML and W3C are trademarks or registered trademarks of W3C®, World Wide Web Consortium, Massachusetts Institute of Technology.
Java is a registered trademark of Sun Microsystems, Inc.
JavaScript is a registered trademark of Sun Microsystems, Inc., used under license for technology invented and implemented by Netscape.
SAP, R/3, SAP NetWeaver, Duet, PartnerEdge, ByDesign, SAP Business ByDesign, and other SAP products and services mentioned herein as well as their respective logos are trademarks or registered trademarks of SAP AG in Germany and other countries.
Business Objects and the Business Objects logo, BusinessObjects, Crystal Reports, Crystal Decisions, Web Intelligence, Xcelsius, and other Business Objects products and services mentioned herein as well as their respective logos are trademarks or registered trademarks of Business Objects S.A. in the United States and in other countries. Business Objects is an SAP company.
All other product and service names mentioned are the trademarks of their respective companies. Data contained in this document serves informational purposes only. National product specifications may vary.
These materials are subject to change without notice. These materials are provided by SAP AG and its affiliated companies ("SAP Group") for informational purposes only, without representation or warranty of any kind, and SAP Group shall not be liable for errors or omissions with respect to the materials. The only warranties for SAP Group products and services are those that are set forth in the express warranty statements accompanying such products and services, if any. Nothing herein should be construed as constituting an additional warranty.