Dashboard reporting
A guide to improving management
CPA Australia Ltd (‘CPA Australia’) is one of the world’s largest accounting bodies with more than 132,000 members of the financial, accounting and business profession in 111 countries. For information about CPA Australia, visit our website cpaaustralia.com.au
First published CPA Australia Ltd ACN 008 392 452
Level 20, 28 Freshwater Place Southbank Vic 3006 Australia
ISBN 978-1-921742-19-4 Legal notice
Copyright CPA Australia Ltd (ABN 64 008 392 452) (“CPA Australia”), 2011. All rights reserved.
Save and except for third party content, all content in these materials is owned by or licensed to CPA Australia. All trade marks, service marks and trade names are proprietory to CPA Australia. For permission to reproduce any material, a request in writing is to be made to the Legal Business Unit, CPA Australia Ltd, Level 20, 28 Freshwater Place, Southbank, Victoria 3006.
CPA Australia has used reasonable care and skill in compiling the content of this material. However, CPA Australia and the editors make no warranty as to the accuracy or completeness of any information in these materials. No part of these materials are intended to be advice, whether legal or professional. Further, as laws change frequently, you are advised to undertake your own research or to seek professional advice to keep abreast of any reforms and developments in the law.
To the extent permitted by applicable law, CPA Australia, its employees, agents and consultants exclude all liability for any loss or damage claims and expenses including but not limited to legal costs, indirect special or consequential loss or damage (including but not limited to, negligence) arising out of the information in the materials. Where any law prohibits the exclusion of such liability, CPA Australia limits its liability to the re-supply of the information.
Contents
Background 2 Introduction 3
Why use dashboard reports? 4
Limitations of dashboard reporting 4
Creating dashboard reports 5
Planning the report 5
What to include in a dashboard report 5
Developing the information 5
Developing key metrics 5
Data collection 8
Format of the dashboard report 8
Frequency 8
Conclusion 14
This guide is the final in a series of three publications on improving business performance published by CPA Australia. Improving business performance involves:
• Evaluating business performance to find areas where business performance could be improved. See CPA Australia’s Business evaluation guide at
cpaaustralia.com.au/smallbusiness for more information.
• Implementing actions in areas where the business determines that its performance should improve. See CPA Australia’s Improving business performance at cpaaustralia.com.au/smallbusiness for
more information.
• Monitoring and reporting actions taken to improve business performance. This guide will help business use dashboard reporting to better report on key business drivers, which in turn helps to improve decision making and implement a continual improvement process. Reporting the key drivers and risks in dashboard reports provides decision makers with quick and easy-to-understand reports that will assist in improving business decision making.
Author
This guide was prepared by Jan Barned CPA, principal of Financial Management Trainer, fmtrainer.com.au
Contributors
CPA Australia gratefully acknowledges the input of Trevor Beckingham FCPA, company secretary of Brisco Butler Automotive Services and Mike Sewell FCPA, director of Market Gap Investments.
Every business owner and manager will benefit from
implementing processes that provide information on business performance that can be easily evaluated to identify areas for improvement, risks and trends. One method of providing such information is dashboard reporting.
Like a car dashboard, the objective of dashboard reporting is to provide clear and concise information of the key drivers of business performance. Dashboard reporting should be a synopsis of business operations and provide information in a visual format that is easy to read, remembered and understood by key decision makers in a business. This should in turn improve decision making.
This guide has been developed to help businesses introduce dashboard reporting. A case study has been included to provide a practical example of dashboard reporting.
For continual improvement of business performance, all business owners and managers should step back from the day-to-day activities of their business and review the bigger picture of business operations on a regular basis. To assist with this, business owners and managers should receive regular management reporting.
The objective of management reporting is to provide useful information on a regular basis to business owners and management that highlights key issues, risks and trends in the business. Key decision makers should use such reporting to inform their decision making.
Most financial software systems provide myriad reports to help meet compliance requirements and monitor the financial results of a business. Smaller businesses in particular are unlikely to generate these reports and, if they do, the business owner or management may not necessarily fully understand them or use them to inform their decision making.
Generally, this would be due to such reports being difficult to read and understand and most business owners and managers are time poor. Sifting through numerous and detailed management reports to find relevant information and identifying issues from such reports tends to be low on the list of priorities for many business owners and managers. Dashboard reporting is one method to improve management reporting and increase the likelihood of such reports being used. It does this by presenting critical information on key business drivers and risks in a visual format and in one or two pages at most, making dashboard reporting easy to read and interpret without detailed explanation.
As dashboard reports provide an overview of consolidated business information, usually in a visual format and focused on key metrics and risks, users of the reports are more likely to read them regularly and initiate actions or ask appropriate questions.
The information in a dashboard report should facilitate discussion or focus where deviations from benchmarks are noted and encourage management by exception. In essence, the report provides triggers for further action if required.
Business performance is not just about financial
performance. Operational performance is also an important measure. Dashboard reports should also include operational measures to improve decision making.
It is important to note that dashboard reporting can be applied by any business in any industry as the report can and should be tailored for each business. Further, dashboard reporting can be prepared for different areas of a business.
Limitations of dashboard
reporting
The value of dashboard reporting is its clear and concise presentation of key business drivers and risks. Such value is lost where it reports in great depth or on a wide variety of drivers. Details on problems highlighted in a dashboard report should be provided in separate, more detailed reporting. It is important that business owners, managers and other users of the dashboard reports understand that the information given will only be effective where: the data that is used to generate the reports is kept up-to-date, the reports are reviewed regularly and the information contained in the reports is useful to decision makers (reporting that may have been useful three years ago may no longer be relevant).
Using spreadsheets to prepare dashboard reports can lead to some risk. Importing data directly from one system to another carries less risk than re-entering data into a report (data entry errors). However, spreadsheet reports may require manipulation of the data to present the information in a useful format. Regular review of any formulas and other formatting within the spreadsheet should be undertaken to ensure the validity of the information.
Planning the report
For dashboard reporting to become a tool that drives important business decisions, it is important to understand what key information needs to be included in the report. This requires planning.
The planning should outline:
• the information needs of the users of the report • the other key areas that should be monitored • information that is currently available
• information that will have to start being collected It may take more than one person to find out what key drivers are to be reported on, the design and construction of the dashboard and the collation and the interpretation of information. It should be noted that information for a metric on a dashboard may come from different sources and systems.
Businesses may like to consider using their external accountant to assist in the planning and design of a dashboard report.
What to include in a
dashboard report
Step 1 – determine what to include in a dashboard report to evaluate business performance and note areas critical to business performance and underperformance.
Step 2 – incorporate any key measures implemented to improve business performance as a result of the evaluation into the dashboard report.
Step 3 – identify the key strategic goals and other key goals of the business from the business plan and sub-plans, such as the marketing plan.
Step 4 – incorporate key risks into the report. For example, reporting on the likelihood of breaches of compliance requirements (such as bank covenants or accreditation).
Step 5 – incorporate opportunities into the report such as forecast information and trends.
Step 6 – consider who will be using the dashboard report. Considering who the audience is will ensure that the reports can be developed to meet their needs. While it may be relatively simple to identify the users of the report, a business evaluation may highlight other potential users of the report, such as those responsible for problem areas.
The audience can also be external stakeholders to the business, such as suppliers, lenders, shareholders and industry associates.
Step 7 – speak with your identified audience and ask them what their key information needs are.
Step 8 – speak with employees and your external accountant to identify the information they believe key decision makers should be aware of.
Step 9 – filter the information from the above steps to identify the key drivers and risks of the business. In filtering the information, the business should ask why this information is important.
Developing the information
Once the business has identified what to include in a dashboard report, the next step is to design how the information is to be presented in the report. To assist in this, the business should consider:
• why this information is important
• why the issue included in the dashboard report is happening
• the performance measures or key metrics of the business • the acceptable levels of variance for the key metrics • the impact that each issue reported on will have on
future performance
• how often users need information
The next step will be to categorise the information. For example, dashboard reports could be presented in groups such as historical information, forecasts and trends, operational activity, compliance and strategy. The grouping should be developed specifically for whatever works best for the users of the information.
Developing key metrics
When developing key metrics, businesses may like to set critical success factors and then key performance indicators (KPI) for each of these factors. For example, ongoing profitability will be a critical success factor for all businesses. KPIs on profitability could include measurements of sales, margins and expenses.
Metrics should be easy to create, understand and explain. They should be aligned with any assumptions used in the business, only highlight the most important issues and provide information on trends (positive or negative).
It will be important to set only as many metrics as necessary for the dashboard report. Remember the report is to be used as a trigger for further analysis, not to include micro-level details of the business.
The dashboard report should also be flexible so that new metrics can be introduced and metrics that are no longer relevant can be omitted.
When developing the dashboard report, it is important to remember that dashboard reporting is most effective where the number of metrics reported on is limited to the key drivers and risks of the business.
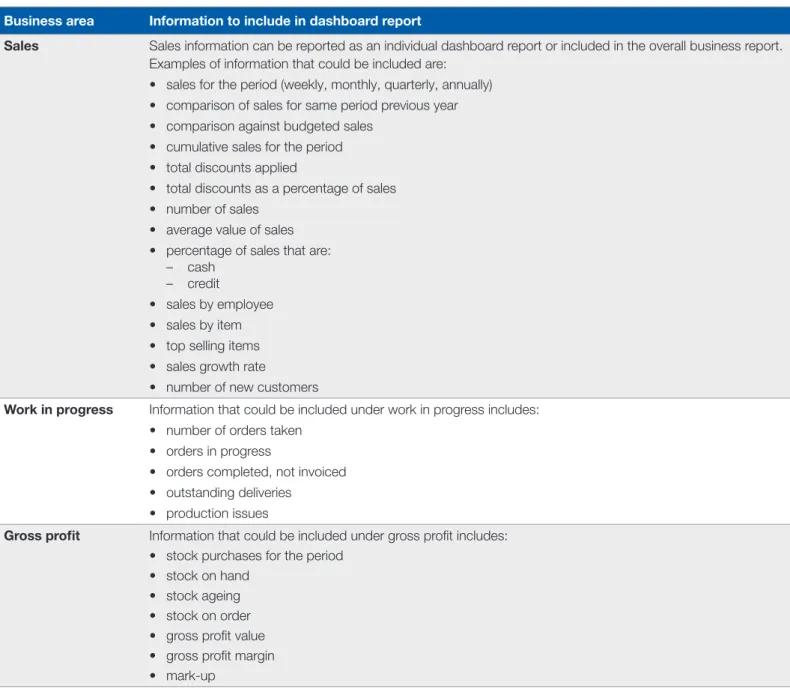
Table 1 below provides examples of the types of information that should be considered including in dashboard reporting. This table is not intended to provide a complete list. Those developing the dashboard should keep front of mind that the report will be most useful where there is a “mix-’n’-match” of relevant information. Please remember, a business should concentrate on preparing metrics for the few key drivers and risks that are most relevant to decision makers.
Table 1: Examples of the types of information that could be included in a dashboard report
Business area Information to include in dashboard report
Sales Sales information can be reported as an individual dashboard report or included in the overall business report. Examples of information that could be included are:
• sales for the period (weekly, monthly, quarterly, annually) • comparison of sales for same period previous year • comparison against budgeted sales
• cumulative sales for the period • total discounts applied
• total discounts as a percentage of sales • number of sales
• average value of sales • percentage of sales that are:
– cash – credit
• sales by employee • sales by item • top selling items • sales growth rate
• number of new customers
Work in progress Information that could be included under work in progress includes: • number of orders taken
• orders in progress
• orders completed, not invoiced • outstanding deliveries
• production issues
Gross profit Information that could be included under gross profit includes: • stock purchases for the period
• stock on hand • stock ageing • stock on order • gross profit value • gross profit margin • mark-up
Business area Information to include in dashboard report
Net profit Information that could be included under net profit includes: • total amount of variable expenses
• variable expenses against sales as a percentage • total amount of fixed expenses
• fixed expenses against sales as a percentage
• monitoring variations to individual expense items from previous periods by setting appropriate trigger points, such as an increase by 5% or by dollar value
• net profit value • net profit margin • breakeven calculation
Business efficiency Information that could be included under business efficiency includes: • debtors days
• creditors days • inventory days • work in progress days • stock turnover
• stock on hand to total assets • aged debtors report
• aged creditors report
Cashflow/liquidity Information that could be included under cashflow/liquidity includes: • cash balances, including investments
• financing facilities, including amounts drawn, available term and interest charges • cashflow forecast
• working capital available • current ratio
• quick ratio • leverage ratio • debt to asset ratio
Balance sheet Information that could be included under balance sheet includes: • total sales to total assets
• return on assets • return on investments
Business planning Key metrics developed to monitor business performance against business strategy.
Other key performance indicators
Data collection
Although it is likely that developing the dashboard report will take some time and resources at first, it is important that once the reports have been designed and implemented, they be easy to populate and produce on a regular basis. Ideally, data collection should be relatively automated with little or no intervention required. Data collection should form part of routine business operations and be aligned with the existing systems of the business.
Format of the dashboard report
Once the metrics have been decided and the information sourced, then the next step is to format a meaningful dashboard report that is quick to populate, easy to understand and captures all the relevant information for users.
Although formats will vary according to business needs, typically the key strategic issues will be displayed at the top of the report with the lower level KPIs displayed below. Business owners and managers may consider producing a number of dashboard reports to cover different areas within the business.
It may also be useful to develop the report into groups such as historical, current and forecast. The grouping of information should be based on what works best for the business.
Finally, the presentation of the information will be critical to the success of dashboard reporting. Dashboard reporting should be visual and engaging. Visual presentation can include charts, colours, symbols (for example, up and down arrows, traffic lights) and any other method that is easy to read and understand. The report can also include numbers; however, these should be kept to a minimum – remembering that the objective of dashboard reports is to provide an overview of information that triggers further analysis if required.
If your financial software is unable to give you the visual presentations you seek, you could export the data to a spreadsheet, where various charts and tables can be developed.
Two examples of dashboard reports are provided on the pages following.
Frequency
When deciding the frequency of reporting, it is essential to assess the resources available to generate and action results from the report as well as understanding the needs of the business and who the audience will be.
Generally, all businesses should generate monthly reports; however for some businesses weekly dashboard reporting may also assist. For example, for a business that has high weekly sales or where there is a large amount of work or orders in progress, weekly reporting can provide key information such as stock balances, staff productivity, sales information including number of customers, average sales value, production outputs and delays in processes.
Example one: profit / cashflow dashboard Cashflow Mth 1 Mth 2 Mth 3 Mth 4 Mth 5 Mth 6 Mth 7 Mth 8 Mth 9 Mth 10 Mth 10 Mth 12 Actual Forecast Open bank $16,000 $15,225 $37,217 $60,817 $71,134 $69,784 $77,381 $32,698 $31,348 $38,945 $24,262 $22,912 Cashflow in $67,200 $68,400 $73,200 $67,200 $79,600 $73,200 $67,200 $79,600 $73,200 $67,200 $79,600 $73,200 Cashflow out $67,975 $46,408 $49,600 $56,883 $80,950 $65,603 $111,883 $80,950 $65,603 $81,883 $80,950 $65,603 Close bank $15,225 $37,217 $60,817 $71,134 $69,784 $77,381 $32,698 $31,348 $38,945 $24,262 $22,912 $30,509
Year to date profit and loss $100,000 $80,000 $60,000 $40,000 $20,000 $0 Mth 1 Actual Budget Mth 2 Mth 3 Mth 4 Mth 5 Mth 6 Mth 7 Mth 8 Mth 9 Mth 10 Mth 11 Mth 12 ($20,000)
Cumulative actual Cumulative budget Year to date profit and loss
Monthly gross trading summary
$80,000 30% 25% 20% 15% 10% 5% 0% $70,000 $60,000 $50,000 $40,000 $30,000 $20,000 $10,000 $-Mth 1 Mth 2 Mth 3
Cost of sales Gross profit Gross profit margin Monthly gross trading summary
Monthly sales $100,000 $90,000 $80,000 $70,000 $60,000 $50,000 $40,000 $30,000 $20,000 $10,000 $-Mth 1 Actual Budget Mth 2 Mth 3 Mth 4 Mth 5 Mth 6 Mth 7 Mth 8 Mth 9 Mth 10 Mth 11 Mth 12
Monthly sales Monthly net profit
$10,000 20% 10% 0% -10% -20% -30% -40% $8,000 $6,000 $4,000 $2,000 $0 ($2,000) ($4,000) ($6,000) ($8,000) Mth 1 Mth 2 Mth 3
Net profit Net profit margin Monthly net profit
Example two: working capital dashboard Top ten customers – previous 12 months
$ $10,000 $20,000 Sales value Watts Pearce Kennedy Thomas Berry King Moore Marks Jones Smith $30,000 $40,000 $50,000 $60,000
Average debtor days
Number of days Previous 12 mths 180 1 150 120 90 60 30 0 2 3 4 5 6 7 8 9 10 11 12
Current top ten debtors $8,000
$6,000 $4,000 $2,000 $
Smith Jones King Pear
ce
Moor
e
Marks Berry attsW Rosa Harry
Monthy stock purchases previous 12 months $80,000 $70,000 $60,000 $50,000 $40,000 $30,000 $20,000 $10,000 $ 1 2 3 4 5 6 7 8 9 10 11 12
Customer over credit limit $8,000
$6,000 $4,000 $2,000
$-Smith Marks Watts Rosa Harry Berry
Outstanding Credit Limit
Stock days by item Lamps Bunks Tallboy Single bed Queen bed Mirrors Bedside Chairs 0 50 100 150 200 250 300 350 Number of days
Current supplier balance
South, $2,000 Main, $1,000 Pine, $2,000 Sharp, $10,000 Ely, $11,000 Belmore, $5,000 Uply, $6,000
Work in progess current month orders
$25,000 $5,000 $2,500 $20,000 Taken Outstanding Completed Returned Top ten customers – previous 12 months
Current top ten debtors
Customer over credit limit Stock days by item
Current supplier balance Work in progress current month orders
Monthly stock purchases previous 12 months Average debtor days
Conclusion
The use of dashboard reporting will assist business owners and managers in improving their decision making process and hence business performance. When used in conjunction with business evaluation, the key metrics can be set to monitor all important business drivers and risks. This should encourage regular review and action where required. The dashboard report should align with the business strategy and be easy to create, understand and explain. The dashboard report also needs to be flexible to introduce new, more relevant metrics to support the continual improvement of the business.
Dashboard reporting should be developed with due consideration to the needs of users.
Where the business has a number of employees, processes, various divisions, locations or projects then a dashboard report for each of those areas may be advantageous. Significant advantages to the business will be achieved when the reports are prepared frequently and in a format that the user can easily read. The use of visual aids is the most common form of dashboard reporting, as this provides a quick and concise presentation of key information. Implementing dashboard reporting into the business will ensure that the important metrics for business success are continually monitored and actioned upon.
To assist in developing a dashboard report, the following case study is provided as a guide. This case study should only be used as reference in developing your own business dashboard report. This case study also includes an example of a dashboard report
Bundalong retail plant nursery
Bundalong retail plant nursery is situated in a rural town which has a population of approximately 38,000 residents.
The nursery has been operating for 15 years and in the past few years, has been recording operational losses. The business evaluation was undertaken in July of the current year.
The business evaluation for this case study involved a review of the financial information against the benchmark information together with a review of documentation provided and physical procedures noted during site visits.
Financial statements
Profit and loss statement for year ended July
Current year ($) Previous year ($)
Sales 438,707.15 345,314.93
Cost of goods sold
Opening stock 119,979.00 71,573.65
Purchases 224,938.00 214,050.11
344,917.00 285,623.76
Closing stock 96,490.49 119,979.00
Total cost of goods sold 248,426.51 56.64% 165,644.76 47.97%
Gross profit 190,280.64 43.36% 179,670.17 52.03%
Operating expenses
Salaries 233,294.80 53.18% 200,236.01 57.99%
Overheads 85,903.42 19.58% 96,691.18 28.00%
Total operating expenses (319,198.22) 72.76% (296,927.19) 85.99%
Net loss 128,917.58 117,257.02 Average stock held for each year $ 108,234.75 $ 95,776.33
Appendix A: Dashboard reporting
– a case study
Breakdown of operating expenses
Operating expenses Current year Previous year
$ % of expense $ % of expense
Cleaning contract 1,740.00 2.03 1,160.00 1.20
Repairs and maintenance
Buildings 794.26 0.92 656.39 0.68
Equipment 978.22 1.14 859.64 0.89
Furniture and fittings 1,702.80 1.98 1,626.81 1.68
Grounds 4,656.30 5.42 9,646.20 9.98 Electricity 2,821.48 3.28 2,729.10 2.82 Vehicles Fuel 3,220.07 3.75 2,578.55 2.67 Registration 355.00 0.41 352.20 0.36 Insurance 1,250.00 1.46 1,200.00 1.24
Repairs and maintenance 1,712.51 1.99 1,872.71 1.94
Transport – contract — — 460.04 0.48
Depreciation
Equipment 5,152.84 6.00 5,421.84 5.61
Furniture and fittings 4,324.41 5.03 4,961.39 5.13
Motor vehicles 6,392.29 7.44 6,577.53 6.80
Advertising 14,515.12 16.90 15,954.60 16.50
Uniform costs 277.89 0.32 451.54 0.47
Printing and stationery 1,017.50 1.18 892.62 0.92
Telephone 2,655.50 3.09 2,960.61 3.06 Staff provisions 1,431.55 1.67 1,665.49 1.72 Rent 22,455.00 26.14 19,525.00 20.19 Equipment 620.00 0.72 1,222.22 1.26 Staff training 310.09 0.36 438.18 0.45 Travelling 191.07 0.22 76.63 0.08
Materials and supplies 529.48 0.62 581.65 0.60
Bank charges 3,013.19 3.51 2,809.30 2.91
Memberships and subscriptions 579.32 0.67 520.00 0.54
Health and safety 259.30 0.30 117.79 0.12
Postage 364.70 0.42 369.44 0.38
Computers — — 4,504.14 4.66
Sundry administration costs 2,583.53 3.01 1,681.39 1.74
Consultancy fees — — 2,818.18 2.91
Balance sheet
Current year ($) Prior year ($)
Assets Current assets Cash/bank 16,320.00 65,777.82 Debtors 14,280.00 32,000.00 Stock 96,490.00 119,979.00 Other 4,210.00 5,500.00
Total current assets 131,300.00 223,256.82
Non-current assets
Delivery vehicle 75,000.00 75,000.00
Less accumulated depreciation (19,547.35) (12,969.82)
Total 55,452.65 62,030.18
Nursery fit out 115,000.00 115,000.00
Less accumulated depreciation (66,955.45) (61,994.06)
Total 48,044.55 53,005.94
Equipment 50,000.00 50,000.00
Less accumulated depreciation (41,021.20) (35,599.36)
Total 8,978.80 14,400.64
Total non-current assets 112,476.00 129,436.76
Total assets 243,776.00 352,693.52 Liabilities
Current liabilities
Creditors 65,000.00 48,000.00
Credit card 15,000.00 12,000.00
Total current liabilities 80,000.00 60,000.00
Non-current liabilities
Bank loan 20,000.00 20,000.00
Total liabilities 100,000.00 80,000.00 Equity
Shareholders’ funds (including retained earnings, losses) 272,693.58 389,950.60
Less current year accumulated losses (128,917.58) (117,257.02)
Operational activities Staffing Full-time equivalent 5.30 Owner/manager 1.30 Apprentice 1.00 Six part-time 3.00 Part-time duties
General sales, orders, quotes 0.80 General sales, admin (0.1) 0.60
General sales, buying 0.60
General sales 0.60
Two staff general sales (2 x0.20) 0.40 Trading hours 59.50 hours per week
8.30 am to 5.00 pm every day except Christmas Day, Good Friday, Easter Sunday and in the morning of Anzac Day.
Documentation reviewed
Mark-up policy: The standard mark-up policy is 110 per cent Buying policy: No formal buying policy held
Job descriptions: No formal job descriptions held
Discount/VIP policy: The discount policy noted the following:
Total liabilities Total liabilities
2.5% Non-VIP members
10%
VIP members Schools Businesses
Garden design customers 15% Landscapers value to $200 20% Landscapers value $201 to $500
TAFE and other colleges 25% Landscapers value over $500
Analysis of Bundalong retail nursery financial information comparison of benchmark to current and previous year
Industry
benchmark Current year
Variance of current year to benchmark
Variance of current to
previous year Previous year
Variance of previous year to benchmark
Total income $446,556.00 $438,707.15 ($7,848.85) $93,392.22 $345,314.93 ($101,241.07)
Cost of goods sold 48.99% 56.63% 7.64% 8.66% 47.97% (1.02%)
Gross margin 51.01% 43.37% (7.64%) (8.66%) 52.03% 1.02%
Selected overheads as a percentage of income
Advertising and
promotion 2.26% 16.90% 14.64% 0.40% 16.50% 14.00%
Salaries including staff
on costs 13.77% 53.18% 39.41% (4.81%) 57.99% 44.22%
Vehicle operating costs 3.74% 7.61% 3.87% 1.40% 6.21% 2.47%
Rent 3.32% 26.14% 22.82% 5.95% 20.19% 16.87%
Bank charges 1.53% 3.51% 1.98% 0.60% 2.91% 1.38%
Total overheads 37.25% 72.76% 35.75% (13.23%) 85.99% 48.75%
Net profit margin 13.76% (29.39%) (43.15%) 4.57% (33.96%) (47.72%)
Personnel numbers (FTE)
Working owners 1.52 1.30 (0.22) 0 1.30 (0.22)
Sales staff and
nurserymen 2.36 4.00 1.64 0.50 3.50 1.14
Any other staff 0.49 0 (0.49) 0 0 (0.49)
Total personnel 4.37 5.30 0.93 0.50 4.80 0.43
Other benchmark information
Stock turn rate 3.50 2.30 (1.20) 0.57 1.73 (1.77)
Plants grown in house as a percentage of total
sales 20.00% 22.00% 2.00% 2.00% 20.00% 0%
Trading hours per week 54.00 59.50 5.50 0 59.50 5.50
Percentage of sales made to account customers
25.00% 58.00% 33.00% 3.00% 55.00% 30.00%
For further detailed commentary on the analysis, refer to the CPA Australia publication Evaluating business performance and
Example of Bundalong retail nursery dashboards Current year sales
$70,000 $60,000 $50,000 $40,000 $30,000 $20,000 $10,000 $
Jul Aug Sep Oct Nov Dec Jan Feb Mar Apr
Year-end outstanding debtors
< 30 68% < 90 6% < 90 8% < 60 18% 36% 35% 29% Dec Sep Aug 4 Months Jun Oct May Apr 5 Months 3 Months Nov Jul Mar Feb Jan
Percentage of current year sales
Cash vs credit sales 100% 80% 60% 40% 20% 0%
Jul Aug Sep Oct Nov Dec Jan Feb Mar Apr May Jun
Cash Credit
Current year sales
Cash vs credit sales
Year-end outstanding debtors
Monthly sales discount
14% 12% 10% 8% 6% 4% 2% 0% Jul Aug Sep Oct Nov Dec Jan Feb Mar Apr May
Amount Percentage of Sales $8,000 $7,000 $6,000 $5,000 $4,000 $3,000 $2,000 $1,000 $0
Top sellers >10% of sales $
45% 40% 35% 30% 25% 20% 15% 10% 5% 0%
Jul Aug Sep Oct Nov Dec Jan Feb Mar Apr May Jun
Seedlings Fruit Trees Roses Natives Indoor Supplementary stock
Current year total sales/staff per day $100,000 $90,000 $80,000 $70,000 $60,000 $50,000 $30,000 $20,000 $10,000 7.0 6.0 5.0 4.0 3.0 2.0 1.0 0.0 $
% of annual sales Mon Tues Wed Thur Fri Sat Sun $40,000 Staff 11% 12% 13% 14% 14% 18% 18% Destroyed stock $6,000 $5,000 $4,000 $3,000 $2,000 $6,000 $1,000
Jul Aug Sep Oct Nov Dec Jan Feb Mar Apr May Jun Monthly sales discount
Current year total sales/staff per day
Top sellers > 10% of sales $
Destroyed stock Percentage of current year sales
CP
A219077