355
Kansei Engineering Implementation on Car Center Stack
Designs
*M.S Syed Mohamed1, Shahzizi Mustafa1
1
Faculty of Manufacturing Engineering, Technical University of Malaysia Malacca (UTeM), Hang Tuah Jaya, 76100 Durian Tunggal, Malacca, MALAYSIA
Abstract
Emotionally appealing designs are currently the norm for consumer products which also
includes interfaces like mobile phones and tablets. In car interior designs, designers are following
the same trend of incorporating emotional aspects of design as a competitive edge for their cars.
Various tools and techniques have been researched and applied; and Kansei Engineering is one of
the techniques. Kansei Engineering tries to capture the customer’s emotional needs in product
design and translates those needs into tangible design requirements which are understood by
engineers and designers. In this study, Kansei Engineering was applied to determine tangible design
needs of young Malaysian adults for car center stacks. Ten car center stack design samples from the
B segment cars and 12 Kansei words were used in this study. As many as 30 young Malaysian
adults between ages of 18 to 30 took part in the Kansei evaluation study. Data was analyzed using
Partial Least Squares in MINITAB software. The results showed that the Chevrolet Aveo center
stack design was the most preferred by both male and female participants, while for the least
preferred design it was Honda Fit for the females with a rating (3.75/10) for the while for the
males the Volkswagen Polo received the lowest rating at (4.06/10). Further analysis for Chevrolet
Aveo was done and the highest rated Kansei were “exclusive”, “elegant” and “high tech”. The
responsible design elements positively related to “exclusive”, “elegant” and “high tech”, were
“Glossy Black”, “LCD 1” (large and bright screen), “LCD 3” (large with dark screen). Design
elements which were negatively associated with “exclusive”, “elegant” and “high tech” were
“Black” and “LCD 2” (small rectangular screen).
356
1.0 Introduction
Stylish car interior designs have started to become de rigueur for the majority of car manufacturers. The previous design focus on functionality has become out of date; consumers are placing more emphasis on the aesthetic design aspects when it comes to comparing products in the marketplace. Styling of products has become a competitive edge for designers as it provides the first impression for the consumers. According to Demirbilek & Sener (2003), affection is the psychological aspect of user’s feedback when interacting with products. Affection is the keyword for psychological needs of users such as mood, expectations and experiences. In addition, the relationship between aesthetics and usability and ergonomics can be somewhat questionable (Syed Mohamed, 2012, 2011a,2011b). More research and effort need to be done in order to address the integration between aesthetics, ergonomics and usability.
Integrating the emotional aspects into design has been the primary purpose of Kansei Engineering. Nagamachi introduced the Kansei concept in the 1970’s where Kansei Engineering is proposed as an “ergonomic customer oriented technology” (Nagamachi, 1995). The word “Kansei” roughly means “total emotions” (Schütte, 2002), but a more refined definition was given by Nagamachi as "individual's subjective impression from a certain artifact, environment, or situation using all the senses of sight, hearing, feeling, smell, taste as well as recognition". Kansei can be captured by several ways, such as words, behavior observations, facial and body expressions as well as physiological signals from the brain for example (Ayas, 2008). Kansei Engineering is often implemented using words solicited from the target groups, for example in the design of Mazda Miata, young drivers were interviewed regarding their driving behavior and preferences for a car which also include their lifestyle. The results of the interviews were then refined from “Stage Zero” (vague and ambiguous descriptions from participants) into physical design attributes which were understandable for the designers and engineers (Nagamachi,2002). One other study on Kansei Engineering involved the use of virtual reality where proposed design concepts are shown to the participants based on the selection of Kansei words. Matsushita Electric Works and Hiroshima University have applied virtual reality and Kansei Engineering to design kitchens. The system developed by Matsushita Electric Works and Hiroshima University contains thousands of kitchen design images as well as participants’ Kansei. Customers can virtually see their designs based on their Kansei and designs can be translated into actual products (Nagamachi, 2002). Kansei Engineering is indeed a powerful tool in transforming customers’ needs and feelings into tangible designs.
Kansei Engineering can be considered as one of the pioneers in the field of affective product design. More recently, the research on affective design was conducted for vehicle interiors (Bahn et al,2009; Jung et al,2010; Wellings et al,2008;Kim et al, 2011). Jindo et al, Tanoue et al and Han et al used the semantic differential method in order to evaluate the affective responses from users.A similar technique was applied by later researchers (Bahn et al,2009; Jung et al,2010; Wellings et al,2008;Kim et al, 2011). Kansei engineering relies heavily on the quantification of user’s feelings and perception. It tries to transform something that is fundamentally different in nature such as feelings, emotions, and thoughts into something tangible and objective, i.e. engineering and design specifications. The success of Kansei engineering also hinges upon the choice of “Kansei words” which are appropriate to the product being evaluated.
The previous researches made by Jindo and Hirasago (1997), Bahn et al (2009) and Jung et al (2010) focused on speedometer and steering, luxuriousness, instrument cluster panel respectively. In this research, a Kansei Engineering technique was used to integrate the consumer’s Kansei into tangible design factors involving car center stack designs.
357
2.0 Materials and Methods
Kansei Engineering method involves a series of steps. According to Matsubara et al (2011), the first step involves the selection of suitable Kansei words, usually obtained from literature. Second part involves the Kansei evaluation experiment, where participants will rate the design samples using the Kansei words with a Semantic Differential (SD) scale. The last step involves a statistical procedure that will analyze the relationship between Kansei words and the product design elements.
2.1 Car Center Stack Design Samples
Ten car center stack design samples from B segment cars were selected for the Kansei Engineering evaluation. B segment cars were selected primarily because it is a volume seller in Malaysia, and the target participants for the evaluation are coming from the younger adult population aged between 18 to 30 years old. Those ten car center stack design samples are coming from cars such as Mazda 2, Toyota Yaris, Kia Rio, Ford Fiesta, Hyundai Accent, Chevrolet Sonic, Volkswagen Polo and Honda Fit, Scion XD, and Chevrolet Aveo. All of the selected cars were from 2012 models. Sample pictures are available in the Appendix.
2.2 Participants
All of the participants were from the ages of 18-30 years old. As many as 18 males and 12 females took part in the study.
2.3 Selection of Kansei words
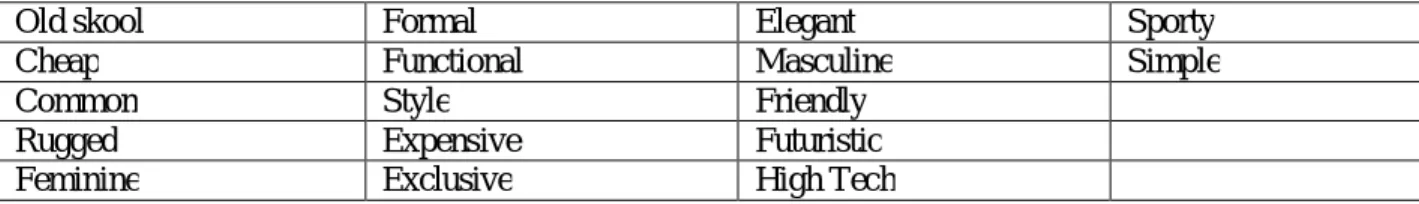
A list of words was obtained from the literature. 17 Kansei words were listed. The list of Kansei words are as follows:
Table 1: Kansei words
Old skool Formal Elegant Sporty
Cheap Functional Masculine Simple
Common Style Friendly
Rugged Expensive Futuristic
Feminine Exclusive High Tech
These Kansei words were then presented to the participants together with the ten design samples of car center stack designs. The main purpose of this exercise was to narrow down the Kansei words and to determine whether the participants understood the meaning of the Kansei words. Participants were asked to describe the ten design samples using the 17 Kansei words listed in Table 1. The results of the evaluation are shown in Figure 1. Kansei words which had a frequency of 15 or less were dropped from the list of words. Words such as “Rugged”, “Feminine”, “Expensive”, “Masculine” and “Futuristic” had to be removed because the words were selected less frequently by the participants to describe the 11 car center stack design samples. Therefore only a total of 12 Kansei words were selected for the Kansei evaluation experiment.
358
Figure 1: Frequency of Kansei words chosen by the participants
2.4 Identification and listing of design elements
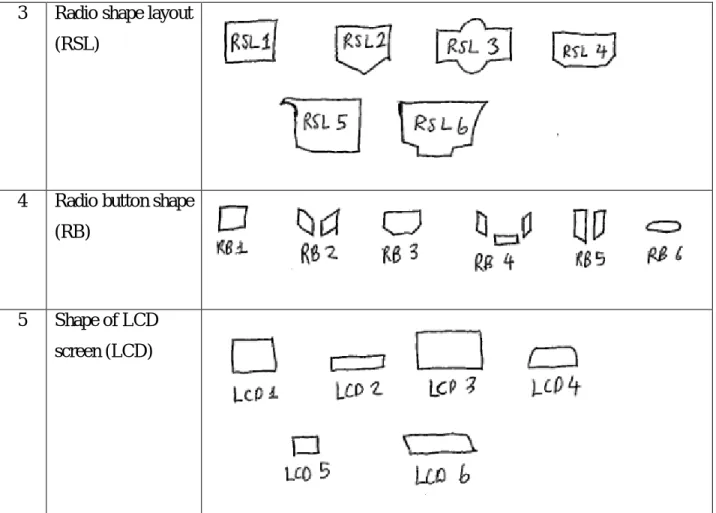
Before a successful implementation of partial least squares, the identification of design elements are necessary. All the ten design samples were analyzed and described using design elements listed below in Table 2.
No.
Attributes
Sub Attributes
1
Color of center
stack background
Glossy Black
Black
Gray
Silver
2
Color scheme
One color
Two colors
Three colors
48 36 34 31 29 25 22 21 19 19 18 18 12 12 9 7 6 0 10 20 30 40 50 60 Si m p le O ld S ko o l C h e ap Fo rm al C o m m o n Fu n ct io n al E le ga n t St yl e Ex cl u si ve Fr ie n d ly H ig h -t ec h Sp o rt y Ex p e n si ve Fu tu ri st ic Fe m in in e M as cu lin e R u gg edFrequency of usage
Frequency of usage359
3
Radio shape layout
(RSL)
4
Radio button shape
(RB)
5
Shape of LCD
screen (LCD)
Table 2: Classifications of design elements
2.5 Kansei Evaluation Experiment
Each one of the ten car center stack design samples were evaluated with 12 Kansei words, using a 7 point SD scale ranging from “ Not at all” to “Very much”.
2.6 Statistical Analysis Procedure
Traditionally, Kansei Engineering have been implemented with Hayashi’s Quantification Theory Type 1 (QT 1). QT 1 is a version of multiple linear regression where product design elements are categorized with numerical values such as one or zero (Matsubara et al, 2011). A statistical procedure is then performed, linking the product design elements (qualitative data) and the ratings of design samples (quantitative data). However, QT 1 has a few drawbacks. The number of product design elements often exceeds the number of design samples, thus creating problems for multiple linear regression technique. Additionally, product design elements are often interacting with each other hence creating the multi-collinearity problem. In order to overcome the shortcomings, partial least squares have been proposed by Matsubara et al (2009) for the purpose of linking Kansei words to design elements. Each one of the ten design samples were rated according to the design elements in Table 2. For example, design sample 1 has a glossy black center stack background, so a value of “1” is assigned to “Glossy Black”, and “0” is given to “Gray”, “Black” and
360
“Silver”. The same goes for all the other attributes and sub attributes. The data was then entered into MINITAB software for the partial least squares analysis.
3.0 Results and Discussion
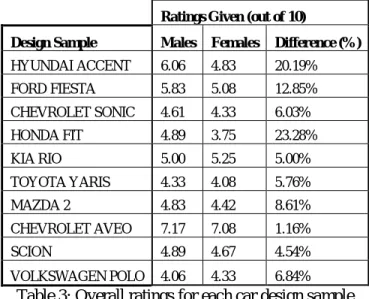
The overall ratings for each design samples are shown below in Table 3. There are differences between the ratings of male and female participants, especially for the Honda Fit and Hyundai Accent.
Ratings Given (out of 10)
Design Sample Males Females Difference (%)
HYUNDAI ACCENT 6.06 4.83 20.19% FORD FIESTA 5.83 5.08 12.85% CHEVROLET SONIC 4.61 4.33 6.03% HONDA FIT 4.89 3.75 23.28% KIA RIO 5.00 5.25 5.00% TOYOTA YARIS 4.33 4.08 5.76% MAZDA 2 4.83 4.42 8.61% CHEVROLET AVEO 7.17 7.08 1.16% SCION 4.89 4.67 4.54% VOLKSWAGEN POLO 4.06 4.33 6.84%
Table 3: Overall ratings for each car design sample
The Honda Fit had the biggest difference in ratings (23.28%) and the Hyundai Accent was at 20.19% difference. Males have rated the Honda Fit to be more attractive (4.89) compared with females (3.75). A similar trend occurred for the Hyundai Accent as well (6.06 for the males and 4.83 for the females). There is a 20.19% difference in ratings. The highest and most consistent rating was given to the Chevrolet Aveo design, with males giving a higher rating (7.17) compared to the females (7.08), and the difference in ratings was also the smallest at 1.16%.From all the ratings, males have consistently given higher ratings for the design samples compared to the females, with the exception of Kia Rio (5.25 for females compared to 5.00 for the males). The difference is also minimal at 5.00%. Honda Fit received the lowest rating (3.75) for the females while for the males the Volkswagen Polo received the lowest rating at 4.06. Taking a closer look at the Kansei word ratings for the Honda Fit and Volkswagen Polo revealed some differences in ratings between genders. For example, the females found the Honda Fit and Volkswagen Polo to be more functional, stylish, exclusive, elegant, high-tech and simpler looking compared to the males who found it to be otherwise. (refer to Table 4)
HONDA FIT Ratings (out of 10) VOLKSWAGEN POLO Ratings (out of 10)
Kansei Word FEMALES MALES Kansei Word FEMALES MALES
Functional 4.50 4.00 Functional 4.75 3.39
Style 3.58 3.44 Style 3.50 2.61
Exclusive 3.67 3.06 Exclusive 3.92 2.78
Elegant 3.50 2.89 Elegant 3.75 2.50
Friendly 4.00 4.44 Friendly 4.00 2.83
361
Sporty 2.83 3.11 Sporty 4.08 2.50
Simple 5.08 4.44 Simple 4.50 3.89
OVERALL RATING 3.75 4.89 OVERALL RATING 4.33 4.06
Table 4: Ratings for Honda Fit and Volkswagen Polo
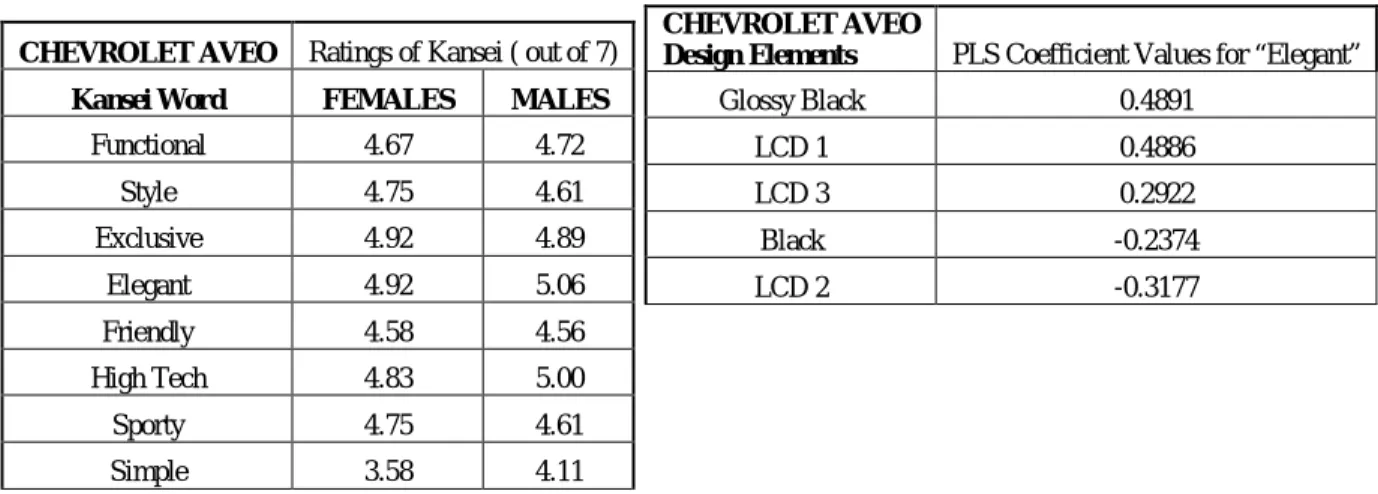
Since the Chevrolet Aveo received the highest ratings for both males and females, a further analysis was conducted to determine the responsible design elements for the high ratings.
CHEVROLET AVEO
Design Elements PLS Coefficient Values for “Elegant”
Glossy Black 0.4891 LCD 1 0.4886 LCD 3 0.2922 Black -0.2374 LCD 2 -0.3177
Table 5: Kansei ratings and PLS Coefficient Values for Chevrolet Aveo Design Element
Figure 2: PLS Coefficient Plot for “Elegant”
From Table 5, the highest, and most consistent ratings are for the “exclusive”, “elegant” and “high tech” for both genders. Partial Least Squares (PLS) analysis was done for these three Kansei words in order to reveal the significant design elements which were responsible for the ratings of the three Kansei words. For the highest rated Kansei word “elegant” (5.06 for males and 4.92 for females), the responsible design elements influencing “elegant” is shown in Figure 2 and Table 5. In order for the center stack design to be elegant, it has to have a glossy black background color (Figure 2), medium to large LCD screen size (LCD 1 and LCD 3), which corresponds to the LCD screen size of the Hyundai Accent and Chevrolet Aveo (shown in Figure
CHEVROLET AVEO Ratings of Kansei ( out of 7)
Kansei Word FEMALES MALES
Functional 4.67 4.72 Style 4.75 4.61 Exclusive 4.92 4.89 Elegant 4.92 5.06 Friendly 4.58 4.56 High Tech 4.83 5.00 Sporty 4.75 4.61 Simple 3.58 4.11
362
3). However the LCD screen size of Hyundai Accent is preferred more (0.4886) compared to only 0.2922 for the Chevrolet Aveo.
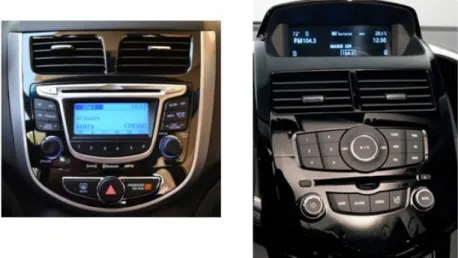
Figure 3: Hyundai Accent (right) , Chevrolet Aveo (left)
Figure 4: Chevrolet Aveo center stack (right) and Hyundai Accent center stack (left)
Interestingly enough, the ordinary black color is negatively associated with “elegant” which is in contrast with glossy black background for car center stacks. Glossy black color gives off a shiny appearance which seems to appeal more than ordinary black color. Out of the ten design samples, only the Hyundai Accent and Chevrolet Aveo have glossy black color background (Figure 4).
Large LCD screens on center stacks are preferred due to the visual appeal as well as heightened consumer expectations, especially coming from the young adult population between the ages from 18 to 30 years old, such as in this study. Something aesthetic is always perceived to be usable and ergonomic as well although the connection can be unclear (Syed Mohamed et al, 2013, Syed Mohamed, 2011a, 2011b, 2009) The heightened expectations simply come from the fact that cars nowadays comes with multi functional,
multimedia system which also includes GPS navigation system. Of all the ten design samples however, none has the GPS navigation system. On the contrary LCD 2 design was deemed to be negatively associated with “elegant” with a coefficient value of -0.3177. LCD 2 screen design is referring to the design of the
363
The next highest Kansei rating was for the word “exclusive”. PLS analysis of the word “exclusive” is shown below. A similar trend is shown with “exclusive” since a glossy black center stack background and a medium to large LCD screen is positively associated with “exclusive”. The coefficient values are shown in Table 6.
Figure 5: PLS Coefficient plot for Kansei word “Exclusive”
Table 6: PLS Coefficient Values for Chevrolet Aveo Design Elements
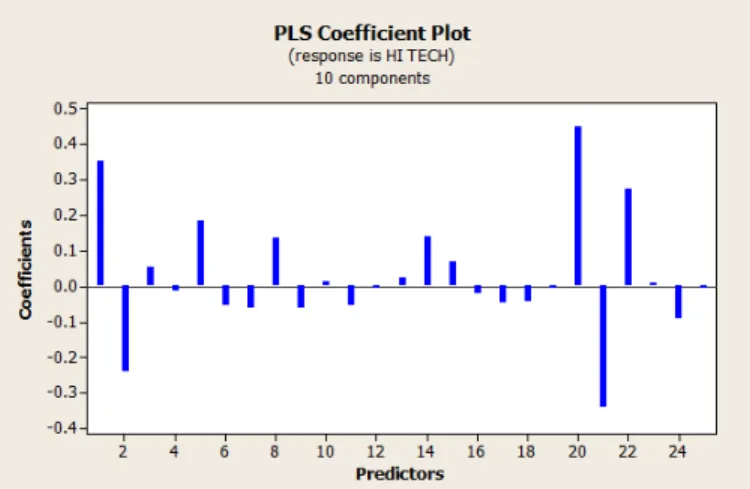
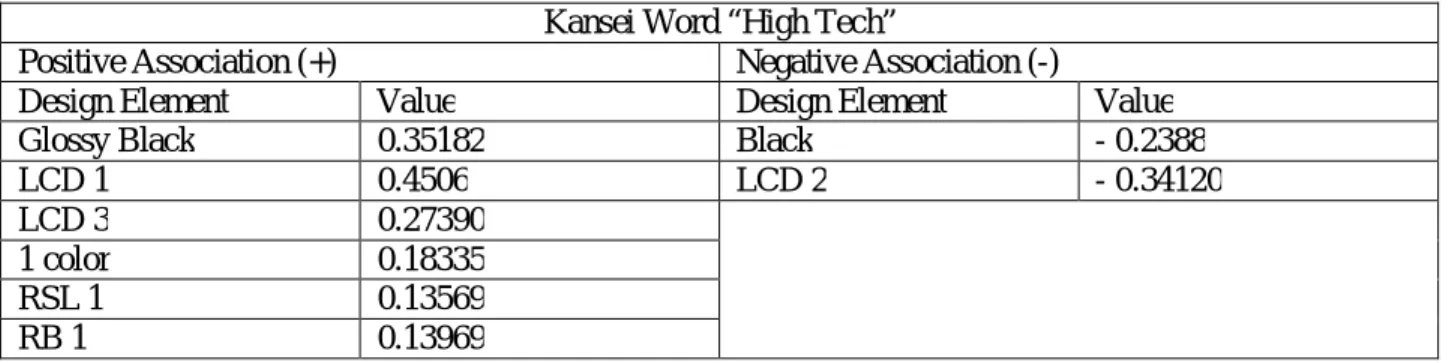
Lastly, the Kansei word “High Tech” follows the similar trend with “exclusive” and “elegant”, but with the addition of few other design elements such as single color scheme (1 color), square radio shape layout (RSL 1), and square radio buttons (RB 1). However the coefficient values of RSL 1, RB 1 and single color scheme is lesser than “Glossy Black”, “LCD 1” and “LCD 3”.
Figure 6 : PLS Coefficient plot for “Hi Tech”
CHEVROLET AVEO
Design Elements PLS Coefficient Values for “Exclusive”
Glossy Black 0.4295
LCD 1 0.4292
LCD 3 0.2619
Black -0.1741
364
Kansei Word “High Tech”
Positive Association (+) Negative Association (-)
Design Element Value Design Element Value
Glossy Black 0.35182 Black - 0.2388
LCD 1 0.4506 LCD 2 - 0.34120
LCD 3 0.27390
1 color 0.18335
RSL 1 0.13569
RB 1 0.13969
Table 7: PLS Coefficient Values for Chevrolet Aveo Design Elements for “High Tech”
Referring to Table 7, the strongest coefficient value correlated with “High Tech” is LCD 1, which is a large squarish LCD screen of the Chevrolet Aveo. 2nd highest coefficient value is the “Glossy Black” design element, which is fairly consistent with the results of the earlier Kansei words “Elegant” and “Exclusive”. As for the negatively correlated design elements, “Black” and “LCD 2” are also negatively associated with “High Tech”. LCD 2 design element corresponds to a small, rectangular LCD screen as shown in Figure 7. Toyota Yaris, VW Polo and Chevrolet Sonic has “LCD 2” type screens which are less preferred by the participants in this study.
Figure 7: Center stack designs with small rectangular screens
4.0 Conclusion
A Kansei Engineering study was done among the young Malaysian adults, in order to determine the connection between center stack design elements and the desired emotional needs of young Malaysian adults. The Chevrolet Aveo center stack design was found to the most emotionally appealing for both males and female participants. Honda Fit and Volkswagen Polo center stack designs were found to be the least appealing to the participants. Highest rated Kansei words for the Chevrolet Aveo design were “exclusive”, “elegant” and “high tech”. For all the these Kansei words, design elements such as “Glossy Black” and “LCD 1” were strongly associated with “exclusive”, “elegant” and “high tech”, whereas design elements such as “Black” and small rectangular LCD screens were negatively associated with the same Kansei words.
365
5.0 References
Ayas, E. (2008). Engineering Feelings of Quality. Linköping Studies in Science and Technology, Licentiate
Thesis, (1365).
Bahn, S., Lee, C., Nam, C. S., & Yun, M. H. (2009). Incorporating affective customer needs for
luxuriousness into product design attributes. Human Factors and Ergonomics in Manufacturing &
Service Industries, 19(2), 105–127. Retrieved from
http://onlinelibrary.wiley.com/doi/10.1002/hfm.20140/abstract
Demirbilek, O., & Sener, B. (2003). Product design, semantics and emotional response. Ergonomics, 46 (13-14), 1346–1360. doi:10.1080/00140130310001610874
Jindo, T., & Hirasago, K. (1997). Application studies to car interior of Kansei engineering. International
Journal of Industrial Ergonomics, 19(2), 105–114. Retrieved from
http://www.sciencedirect.com/science/article/pii/S0169814196000078
Jung, G., Kim, S. M., Kim, S. Y., Jung, E. S., & Park, S. (2010). Effects of Design Factors of the Instrument Cluster Panel on Consumers’ Affection. Proceedings of the International {MultiConference} of
Engineers and Computer Scientists, 3.
Kim, C., Lee, C., Lehto, M. R., & Yun, M. H. (2011). Affective evaluation of user impressions using virtual product prototyping. Human Factors and Ergonomics in Manufacturing & Service Industries.
Matsubara, T., Ishihara, S., Nagamachi, M., & Matsubara, Y. (2011). Kansei analysis of the Japanese residential garden and development of a low-cost virtual reality Kansei engineering system for gardens. Advances in Human-Computer Interaction, 2011, 3. Retrieved from
http://dl.acm.org/citation.cfm?id=2043284
Matsubara, T., Matsubara, Y., Ishihara, S., & Nagamachi, M. (2009). {PLS-based} approach for Kansei analysis. Retrieved from
http://ousar.lib.okayama-u.ac.jp/file/19644/20100127112815/IWCIA2009_B1103.pdf
Nagamachi, M. (1995). Kansei Engineering: A new ergonomic consumer-oriented technology for product development. International Journal of Industrial Ergonomics, 15(1), 3–11. doi:10.1016/0169-8141(94)00052-5
Nagamachi, M. (2002). Kansei engineering as a powerful consumer-oriented technology for product development. Applied Ergonomics, 33(3), 289–294. doi:10.1016/S0003-6870(02)00019-4
Schütte, S. (2002). Designing feelings into products: Integrating kansei engineering methodology in product development. Retrieved from http://liu.diva-portal.org/smash/record.jsf?pid=diva2:19998
Syed Mohamed,M.S., Shamsul, B.M.T., Rahman, R. (2013). The Suitability of Cross Cultural Models in Predicting Car Center Stack Design Preferences, International Journal of Education and Research, 1(6).
Syed Mohamed, M.S. (2012). The Influence of Different Hand Tool Designs on the Perception of Aesthetics, Ergonomics and Usability. International Journal of Business and Social Science, 3(3), 241-246.
366
Syed Mohamed, M.S. (2011a). The Perception of Usability, Ergonomics and Aesthetics for Three Different Types of Tin Snips. International Journal of Applied Science and Technology, 1(4), 102-106.
Syed Mohamed, M.S (2011b). Ergonomics Assessment of Tin Snips, in The 5th PSU-UNS International
Conference on Engineering and Technology. (ICET-2011), May 2-3, 2011, Phuket, Thailand.
Syed Mohamed, M.S. (2009). Usability evaluation of a Malaysian university website. in Proceedings of the
XXIst Annual International Occupational Ergonomics and Safety Conference, June 5-6, 2009, Dallas,
Texas.
Wellings, T., Williams, M. A., & Pitts, M. (2008). Customer perception of switch-feel in luxury sports utility vehicles. Food Quality and Preference, 19(8), 737–746.