Drivers of change in crop–livestock systems
and their potential impacts on agro-ecosystems
services and human wellbeing to 2030
A study commissioned by
the CGIAR Systemwide Livestock Programme
ILRI PROJECT REPORT
CGIAR is a global agricultural research partnership for a food-secure future. Its science is carried out by 15 research centres that are members of the CGIAR Consortium in collaboration with hundreds of partner organizations. cgiar.org
The International Livestock Research Institute (ILRI) works to enhance the roles livestock play in pathways out of poverty in developing countries. ILRI is a member of the CGIAR Consortium. ILRI has two main campuses in East Africa and other hubs in East, West and southern Africa and South, Southeast and East Asia. ilri.org
slp
CG
IAR
Syste
mw
ide
Li
ves
tock
Pr
ogra
mm
and their potential impacts on agro-ecosystems
services and human wellbeing to 2030
A study commissioned by the CGIAR
Systemwide Livestock Programme
Mario Herrero,1 Philip K. Thornton,1 An Notenbaert,1 Siwa Msangi,2 Stanley Wood,2 Russ Kruska,1 J. Dixon,3 D. Bossio,4 J. van de Steeg,1 H. Ade Freeman,1 X. Li,3 and P. ParthasarathyRao5
1 International Livestock Research Institute, Nairobi, Kenya
2 International Food Policy Research Institute, Washington, DC, USA 3 Centro Internacional de Mejoramiento de Maiz y Trigo, Mexico DF, Mexico 4 International Water Management Institute, Colombo, Sri Lanka
This publication is copyrighted by the International Livestock Research Institute (ILRI). It is licensed for use under the Creative Commons Attribution-Noncommercial-Share Alike 3.0 Unported License. To view this license, visit http://creativecommons.org/licenses/
by-nc-sa/3.0/. Unless otherwise noted, you are free to copy, duplicate, or reproduce, and distribute, display, or transmit any part of this publication or portions thereof without permission, and to make translations, adaptations, or other derivative works under the following conditions:
ATTRIBUTION. The work must be attributed, but not in any way that suggests endorsement by ILRI or the author(s) NON-COMMERCIAL. This work may not be used for commercial purposes.
SHARE ALIKE. If this work is altered, transformed, or built upon, the resulting work must be distributed only under the same or similar license to this one.
NOTICE:
For any reuse or distribution, the license terms of this work must be made clear to others. Any of the above conditions can be waived if permission is obtained from the copyright holder. Nothing in this license impairs or restricts the author’s moral rights.
Fair dealing and other rights are in no way affected by the above.
The parts used must not misrepresent the meaning of the publication. ILRI would appreciate being sent a copy of any materials in which text, photos etc. have been used.
Editing, design and layout—ILRI Editorial and Publishing Services, Addis Ababa, Ethiopia.
ISBN 92–9146–285–3
Citation: Herrero, M., Thornton, P.K., Notenbaert, A., Msangi, S., Wood, S., Kruska, R., Dixon, J., Bossio, D., van de Steeg, J., Freeman, H.A., Li, X. and Rao, P.P. 2012. Drivers of change in crop–livestock systems and their potential impacts on agro-ecosystems services and human wellbeing to 2030: A study commissioned by the CGIAR Systemwide Livestock Programme. Nairobi, Kenya: ILRI.
ilri.org Box 30709, Nairobi 00100, Kenya
Phone: + 254 20 422 3000 Fax: +254 20 422 3001 Email: [email protected]
Box 5689, Addis Ababa, Ethiopia Phone: +251 11 617 2000 Fax: +251 11 617 2001 Email: [email protected]
other offices
China • India • Mali
Mozambique • Nigeria • Tanzania Thailand • Uganda • Vietnam
Better lives through livestock ILRI is a member of the CGIAR Consortium
Contents
Tables iv
Figures vi
Executive summary viii
1 Introduction 1
2 Framework for studying the dynamics and impacts of change in crop–livestock systems 2
2.1 Key drivers of change in crop–livestock systems 4
3 Global trends in agriculture, agro-ecosystems services and human wellbeing 8
3.1 Trends in human demography, livelihoods and economic parameters 8
3.2 Trends in agriculture 15
3.3 Environmental trends and crop–livestock systems 20
4 Methods and scenarios for evaluating changes in mixed crop–livestock systems and human wellbeing 29
4.1 Methods 29
4.2 Brief IMPACT model description 29
4.3 Descriptions of IMPACT scenarios used for drivers study 31
4.4 Allocation of the FPU-level impact outputs to regions and systems 34
5 Results 39
5.1 Farming systems and the distribution of human population 39
5.2 World food prices 41
5.3 Livestock numbers and their production under alternative scenarios 2000–2030 42
5.4 Crop production 59
5.5 Impacts on human wellbeing 89
6 Conclusions 94
References 97
Tables
Table 1. Key drivers of change in crop–livestock systems 7
Table 2. Population size and life expectancy between 1950 and 2000 for different world regions 9
Table 3. Population numbers in different farming systems in developing countries 9
Table 4. Changes in food consumption in developing countries 13
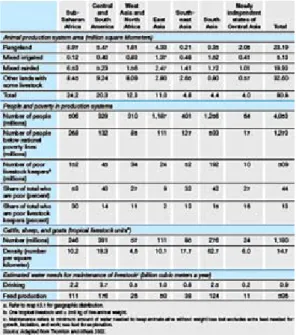
Table 5. Area, people, poverty and livestock within agricultural production systems 14
Table 6. Share of milk and meat outputs by production systems in selected regions 18
Table 7. Livestock population and production in different production systems in developing countries 18
Table 8. Livestock population and production in different agro-ecological zones 19
Table 9. Global trends and projections in the use of cereal as feed 19
Table 10. Key productivity parameters for pigs and poultry in different world regions 20
Table 11. Regional climate change projections from the IPCC’s Fourth Assessment 21
Table 12. Global projections of energy demand in 2015 and 2030 23
Table 13. Global biofuel production and crops 23
Table 14. Human, livestock and total energy consumption in selected farming systems 24
Table 15. Average nutrient balances of some SSA countries 26
Table 16. Estimated relative contribution of pig waste, domestic wastewater and non-phosphorus
emissions in water systems 27
Table 17. Assumptions for reference case and the scenario variant with high agricultural investment
combined with other AKST-related factors (used as IRRIGATION EXPANSION scenario) 32
Table 18. Changes to average income demand elasticities for meat and vegetarian foods by IAASTD
region under low growth in meat demand 34
Table 19. Indices used 36
Table 20. Farming systems: area and human population for different regions of the world under
alternative scenarios to 2030 40
Table 21. World food prices by scenario 42
Table 22. Bovine numbers by farming system under different scenarios 2000–2030 43
Table 23. Milk production by farming system under different scenarios 2000–2030 44
Table 24. Meat production by farming system under different scenarios 2000–2030 45
Table 26. Livestock production, farming systems vs. small ruminants 51
Table 27. Chicken numbers by farming system under alternative development scenarios 54
Table 28. Egg production by farming system under alternative development scenarios 55
Table 29. Poultry production under alternative development scenarios 56
Table 30. Numbers of pigs by farming system under alternative development scenarios 57
Table 31. Livestock production, farming systems vs. pork production 58
Table 32. Global area of maize by system by region by scenario 2000–2030 60
Table 33. Global maize production by system by region by scenario 2000–2030 61
Table 34. Global area of wheat by system by region by scenario 2000–2030 62
Table 35. Global production of wheat by system by region by scenario 2000–2030 63
Table 36. Global area of rice by system by region by scenario 2000–2030 64
Table 37. Global rice production by system by region by scenario 2000–2030 65
Table 38. Global area of sorghum by system by region by scenario 2000–2030 66
Table 39. Global sorghum production by system by region by scenario 2000–2030 67
Table 40. Global area of millet by system by region by scenario 2000–2030 68
Table 41. Global millet production by system by region by scenario 2000–2030 69
Table 42. Global area of barley production under different scenarios 70
Table 43. Global production of barley by system by region by scenario 71
Table 44. Global area of cassava by system by region by scenario 2000–2030 72
Table 45. Global cassava production by system by region by scenario 2000–2030 73
Table 46. Global area of sweetpotato by system by region by scenario 2000–2030 74
Table 47. Global sweetpotato production by system by region by scenario 2000–2030 75
Table 48. Global area of potatoes by system by region by scenario 2000–2030 76
Table 49. Global production of potatoes by system by region by scenario 2000–2030 77
Table 50. Stover production in the developing world 2000–2030 under alternative development scenarios 84
Table 51. Metabolizable energy from stover by system by region by scenario to 2030 85
Table 52. Predicted number of malnourished children under 5 by system, region and scenario 2000–2030 90
Table 53. Percentage of malnourished children under 5 relative to human population numbers
Figures
Figure 1. Conceptual framework for studying the impacts of drivers of change in crop–livestock systems 3
Figure 2. Overview of a framework and how it relates to a specific crop–livestock system 4
Figure 3. Overview of a framework and how it relates to a specific crop–livestock system
under a technology intervention 5
Figure 4. Expenditure gains in 42 developing countries for a one per cent increase in GDP growth 10
Figure 5. Growth in agricultural GDP in developing countries 10
Figure 6. Proportion of total population in developing countries that is rural 11
Figure 7. Rural poverty rates from 1993 to 2002 12
Figure 8. Association between National Average Dietary Energy Supply and GDP, per capita 12
Figure 9. Domestic consumption of meat and cereals in developing countries between 1980 and 2005 13
Figure 10. Per capita food consumption in developing countries between 1961 and 2003 13
Figure 11. Changes in the value of exports of crops in developing countries between 1960 and 2004 14
Figure 12. Trends in selected drivers of food provision worldwide, 1961–2001 15
Figure 13. Regional cereal yields between 1960 and 2005 16
Figure 14. Arable and permanent cropland per capita of the agricultural population 16
Figure 15. Growth rates of yields for major cereals in developing countries 17
Figure 16. Global trends in food production and price in relation to undernourishment 17
Figure 17. Disaster losses, total and as a share of GDP between 1985 and 1999 in the world’s
ten richest and poorest nations 20
Figure 18. Length of growing period (days per year) for 2000 22
Figure 19. Areas within the LGA (in yellow) and MRA (in green) systems projected to undergo more
than 20% reduction in the length of growing period to 2050 22
Figure 20. Global changes in food consumption from 1961 to 2003 25
Figure 21. Investing in irrigation based on FAO and World Bank data 25
Figure 22. Some examples of scenario options 25
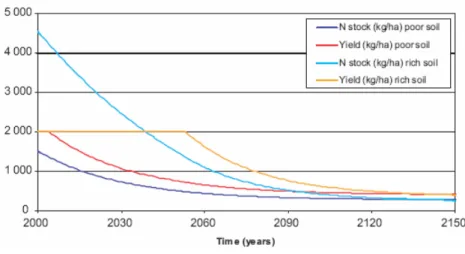
Figure 23. Trends in yield and nutrient stocks for two soil types 26
Figure 24. Modern inputs have expanded rapidly but have lagged in SSA 27
Figure 26. Overview of the ‘food’ side of the IMPACT model 30 Figure 27. Schematic representation of the linkage of the food and water modules in the augmented
IMPACT model (IMPACT-Water) 31
Figure 28. Flow chart of the process used in establishment of the production systems 38
Figure 29. The distribution of farming systems, as classified for this study, for 2000 and 2030 39
Figure 30. Density of ruminants 2000–2030 for the baseline scenario 47
Figure 31. Rates of growth in meat and milk production under the references scenario 2000–2030 48
Figure 32. Density of poultry 2000–2030 for the baseline scenario 52
Figure 33. Density of pigs 2000–2030 for the baseline scenario 53
Figure 34. Global cereal production–2000 78
Figure 35. Mixed systems in the developing world produce the food of the poor 78
Figure 36. Rates of cereal production to 2030 by farming system under the reference scenario 79
Figure 37. Composition of cereal stover availability by system and region 2000 85
Figure 38. Global availability of metabolizable energy from stover for ruminants and its change to 2030 86
Figure 39. Per capita kilocalorie consumption by scenario 89
Executive summary
Introduction
The CGIAR Systemwide Livestock Programme (SLP) commissioned a desk study titled ‘Drivers of change in mixed crop–livestock systems’. The study was to be developed by a multi-disciplinary task force from across the CGIAR centres. The objective of the study was to identify places and production systems in the developing world which, due to global changes, may not be able to supply food for the growing population or, in doing so, the sustainability and maintenance of key ecosystem functions would be compromised. The project works are the cross roads of agriculture and livestock, poverty and the environment.
This report 1) develops a conceptual framework for studying the effects of drivers of change in mixed crop–livestock systems; 2) analyses the past trends of key indicators of change in mixed crop–livestock systems; and 3) uses these trends, along with modelling approaches and other tools, to develop a series of scenarios of how mixed systems in different regions might evolve, and what their constraints and opportunities could be. This information can be used to guide some basic priority setting for the SLP and for the CGIAR in more general terms.
What is the problem?
The world’s population is predicted to increase by 50% over the next quarter of a century to reach 9 billion by 2030. During this period, and if the livestock revolution fully materializes (Delgado et al. 1999), in developing countries there is likely to be a rapid increase in demand for livestock products driven by increasing urbanization and rising incomes. On top of this, the impacts of a range of driving forces, such as water availability, climate change and technological
innovations, on smallholder crop–livestock production may be substantial. Variations in these drivers will inevitably
affect smallholder farms. The challenge is to ensure that the resource-poor, i.e. the mixed crop–livestock smallholder sector, which currently provides the majority of milk and meat in the tropics, is able to meet the increased demand for these products. To do so the sector will need to intensify but at the same time ensure that household food security, sustainable natural resource management and rural livelihoods are not compromised.
The framework for the study was based on that of the Millennium Ecosystem Assessment, which was subsequently used for other major assessments such as the Global Environment Outlook 4 (UNEP 2007) and the International Assessment of Agricultural Knowledge, Science and Technology for Development (2008). It shares common features with the frameworks of the Intergovernmental Panel on Climate Change (2007) and the Comprehensive Assessment of Water Management in Agriculture (2007). It is based on the notion that a set of drivers, both direct and indirect, can make systems change over time. The local development context determines how, where and which drivers play the most important role in which system. Different drivers exert different kinds of ‘pressures’ on key aspects of agro-ecosystems. These pressures include changes in land use, changes in resource and input use, and increased competition for biomass (food, feed and energy). In turn, these pressures have impacts on different agro-ecosystem services, such as climate regulation, watershed protection, and crop pollination. Depending on the magnitude of the pressures and the impacts on agro-ecosystems services, human wellbeing (measured, for example, by income, health, food security,
and vulnerability) can be affected in different ways. Positive interventions can be made either by trying to regulate the effects of the drivers and pressures or by generating options for adapting the agro-ecosystems services to the impacts of the changes.
We used the IMPACT-Water model coupled with a farming systems classification and a range of spatial disaggregation methods for looking at alternative scenarios of change in mixed crop–livestock systems to 2030. We built upon the results of the IAASTD. The scenarios we used were 1) the reference scenario, which tries to mimic business-as-usual conditions of growth in agriculture, incomes and population. Additionally we investigated the consequences of an increased demand for biofuels, an increased expansion of irrigation to produce more food and feed, and a decreased demand for livestock products.
The following are the main messages from the study.
Mixed crop–livestock systems are and will continue to be the backbone of sustainable pro-poor agricultural growth in the developing world to 2030. Two-thirds of the global population live in these systems. They not only produce most of the milk and meat globally but also produce a significant proportion of the key staples of the world. Rates of growth in demand, production and consumption of agricultural products are significantly higher in these systems than in others. These systems will surpass the developed world in the production of cereals and some livestock products by 2030.
Mixed intensive systems in the developing world face significant pressures
1. . These pressures are larger
in some systems than in others but are all caused by the rising demands of the human population: its income shifts and rates of urbanization. For example, mixed intensive systems in South Asia are reaching a point where production factors are seriously limiting production as land per capita decreases. Significant trade-offs in the use of resources (land, water, nutrients) exist in mixed crop–livestock systems, especially as the demands for biomass for food, feed and energy increase.
Prices of food–feed crops are likely to increase at faster rates than the prices of livestock products
2. .
Due to the multiple competing demands for food, feed and energy, increases in the prices of commodities will be more marked for food–feed crops than for any other products, including livestock.
Rates of change in crop, and therefore stover, production are likely to vary widely from region 3.
to region to 2030. Large increases in stover production are likely to occur in Africa as a result of area and productivity increases mainly in maize, sorghum and millet. Other large increases will occur across systems in Central and South America but less so in the mixed extensive systems of East Asia. Stover production will stagnate in some areas, notably in the mixed extensive and intensive systems of South Asia, which together have the largest numbers of ruminants in any system in the world.
Increase in ruminant numbers has outpaced the rate of growth of availability of stover per animal 4.
in many places. This means that either stover will become less important as a feed in these systems or it will be substituted by other feeds in the diet, or that there will be significant feed deficits in some places.
Land availability and water will be key constraints to the production of alternative feeds for 5.
ruminants in the most intensive systems. Mixed intensive systems in South Asia, which depend on irrigation to a great extent, and which are supposed to produce 113 million tonnes of milk and 4.5 million tonnes of beef to feed increasing human populations, will have to support all their production from feed sources other than stover, as stover production only meets the maintenance requirements of the animals. If this production levels were to materialize, water demands from livestock would rise several fold (billions of litres) to produce fodders for animals and would compete directly with irrigation for the production of crops for multiple uses.
Fodder markets are likely to expand in areas of feed deficits as demand for animal products 6.
increases. Substantial local heterogeneity exists in supply and demand of feeds for ruminants. Areas of surplus are likely to trade with areas of feed deficits as prices of stovers and green feeds increase. Public investments will be required to create incentives and reduce transaction costs of moving feeds over long distances.
The livestock revolution—at least for ruminants—could potentially exclude the poor in terms of the 7.
benefits of consumption of meat. If green fodders became scarce due to land and water shortages and more grains are fed to ruminants to match production prices of animal products may further increase, bypassing the abilities of the poor to consume more milk and meat. This would present significant challenges in mixed systems, particularly in Asia.
Rates of malnutrition relative to population increases are highest in agropastoral systems followed by 8.
the mixed intensive systems. In agropastoral systems, malnutrition may be caused by increased vulnerability, lack of primary productivity, poor market access and lack of economic growth but with large land holdings (Thornton et al. 2006). In mixed intensive systems, too many people, especially poor, relative to the resources available may be the principle cause of malnutrition. South Asia and sub-Saharan Africa (SSA) exhibit particularly large rates of malnutrition across these systems.
Expansion of biofuels is likely to reduce household food consumption in most systems
9. . Increased
production of biofuels may raise the price of staple commodities, which will particularly affect the poor due to their low purchasing power. This effect may be stronger in rural and poor urban households that are net buyers of food. Highly intensive systems will require solutions that give high efficiency gains without using any more 10.
land and water. More intensive crop management practices, such as efficiency gains in pig and poultry production may reduce pressure on land resources.
Some systems may need to de-intensify or stop growing to ensure the sustainability of agro-11.
ecosystems. Developing sound, simple and equitable schemes for payments for ecosystems services could be part of the solution. Understanding the limits of land intensification is necessary along with developing a set of intensification thresholds to prevent irreparable environmental damage.
Important productivity gains could be made in the more extensive mixed rainfed systems.
12. Resource
constraints in some mixed intensive systems are reaching a point where livestock production could decrease and where environmental degradation may have deleterious impacts on humans. In more extensive systems, with less pressure on the land, yield gaps of crops and livestock in different regions are still large. Pro-poor policies and public investments in infrastructure will be essential to create systems of incentives, reduce transaction costs and improve risk management in these systems. Integration of production in these systems to supply agro-ecosystems services such as feeds and food to the more intensive systems should be promoted.
Crop improvement programs could play a key role in helping meet the multiple demands for 13.
biomass.Developing multi-purpose or more specialized crop varieties for the production of food, feed and energy
may significantly decrease competition for these resources if they become limited.
The dynamics of agriculture and other sectors are changing at unprecedented rates and are 14.
becoming more difficult to project. Integrated assessments are becoming a key step towards understanding change but these studies are increasing in complexity and are difficult to put together comprehensively across sectors.
Better targeting of studies and refining the methods used in this study are essential steps for better 15.
understanding change in farming systems. A more comprehensive understanding of the interactions between drivers, ecosystem services and agricultural systems will enable better prioritization of sustainable options to meet the simultaneous demands of different sectors, but especially to meet the needs of the poor and the environment.
1 Introduction
This desk study was prepared by a multi-disciplinary team from across CGIAR to identify places and production systems in the developing world which, due to global changes, may not be able to supply food for the growing population or, in doing so, the sustainability and maintenance of key ecosystem functions would be compromised. The team worked at the cross roads of agriculture and livestock, poverty and the environment.
The report 1) develops a conceptual framework to study the effects of drivers of change in mixed crop–livestock systems; 2) analyses past trends of key indicators of change in mixed crop–livestock systems; and 3) uses these trends, along with modelling approaches and other tools, to develop a series of scenarios of how mixed systems in different regions might evolve, and what their constraints and opportunities could be.
The guiding principles for the study were the following:
• The study should be built around a conceptual framework on how farming systems are likely to evolve.
• It must describe the impacts of drivers of change and their effects at different scales and on different systems, but with
special emphasis on crop–livestock systems.
• It should build on historical information as well as on scenarios of future changes.
• It should seek to introduce systems change concepts in the CGIAR centres’ research and development agendas by
providing information on what drives systems to change in different parts of the developing world, and how this occurs.
• It needs to be able to identify priority intervention points for coping with change in different systems.
• It should seek to find where synergistic activities between CGIAR centres will be of primary importance to deliver
products for adapting to change in crop–livestock systems.
• It should build on the recent major assessments of global change such as the Intergovernmental Panel on Climate
Change (IPCC), the International Assessment of Agricultural Knowledge, Science and Technology for Development (IAASTD), the Millennium Ecosystem Assessment (MEA), and the Comprehensive Assessment of Water Management in Agriculture (CA).
2 Framework for studying the dynamics
and impacts of change in crop–livestock
systems
A range of forward-looking international global assessments covering different aspects of the global use of resources and its significance to humanity have been conducted recently. Aspects covered have included agriculture and development (World Development Report 2008), agriculture, science and technology (IAASTD), ecosystem services (Millennium Ecosystem Assessment, MEA), environmental outlooks (Global Environmental Outlook [GEO-4], UNEP 2007), water management, and climate change (IPCC 2007).
The IAASTD and GEO-4 are based around the conceptual framework developed for the MEA and some similarities exist with the IPCC (2007). The present study uses a similar framework, but with the specific objective of looking in more depth at the effects of drivers of systems change on crop–livestock systems. It is useful to explicitly link the framework used in this study to those of other major assessments. This will enable us to have some coherence when comparing and integrating results from these other studies. To our knowledge, this is the only assessment that attempts to identify changes at the production systems level for the whole of developing world. This is a key difference to most other assessments, which provide aggregated data at the country or regional level.
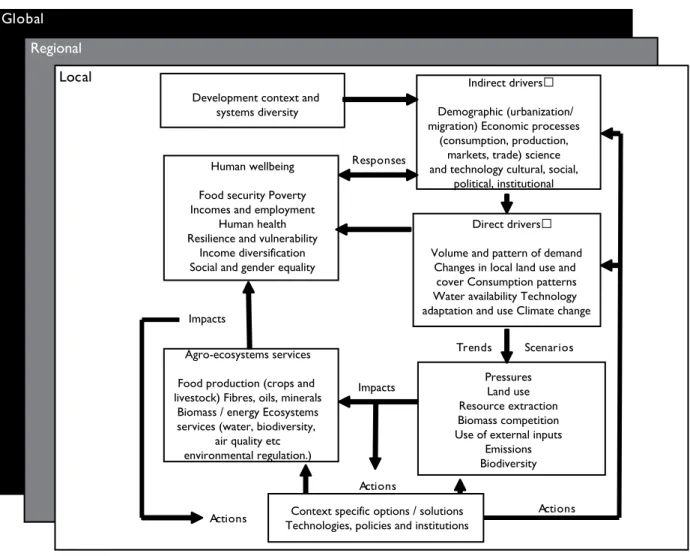
The basic conceptual framework is presented in Figure 1. The key aspects of the framework are:
Mixed crop–livestock systems (and other systems) are diverse, and their structure, function and potential are •
shaped by their development context.
There is a set of drivers, both direct and indirect, that can make systems change over time. Direct drivers are •
those that have a direct measurable effect on different aspects of agro-ecosystems and humans. Indirect drivers act as key influences on one or many other drivers. For example, increased demand for livestock products (a direct driver) is the product of increases in human population and their income increases (indirect drivers).
The local development context determines which direct and indirect drivers play a more important role in which •
system, in which location and in which ways.
Different drivers of change exert different kinds of ‘pressures’ on key dimensions of agro-ecosystems. These •
can range from land use change, resource and input use to competition for biomass (food, feed and energy). For example, as global demands for food increase along with competition for biomass and resources and for use of inputs, greenhouse gas emissions are affected positively or negatively, or not changed, depending on location. These pressures have impacts on different agro-ecosystems services. These services can be divided into four •
categories: provisioning (e.g. of food/feed, water, or fuel); regulating (e.g. of the climate); cultural (e.g. spiritual, aesthetic, and recreation values); and supporting services (e.g. primary production and soil formation).
Depending on the magnitude of the pressures and the impacts on agro-ecosystem services, human wellbeing •
can be affected in different ways (e.g. incomes, health, food security, vulnerability etc.) and this in turn can have important feedbacks, especially on the indirect drivers of change.
There are several pathways to generate solutions to respond locally and globally to the effects of the drivers of •
change. These are through technologies, policies, and institutional arrangements that promote intensification, diversification, expansion, regulation and exit from agriculture (Dixon et al. 2001).
These key entry points operate through regulating the effects of the drivers and the pressures or through •
generating options for adapting the agro-ecosystems services to the impacts of the changes. For example, price policies may help regulate water demands, or mitigation strategies can be developed to prevent increases in greenhouse gas emissions from crop–livestock systems. We may want to promote alternative crop varieties to increase the production of grain and fodder for humans and animals. These three different alternatives present different instruments to provide a solution and consist of a different entry point (drivers, pressures and agro-ecosystems responses). These can be solutions that transcend scale in some cases (from global to local), though the impacts on people and systems will be felt differentially depending on location and context.
Figure 1. Conceptual framework for studying the impacts of drivers of change in crop–livestock systems
Global
Local
Regional
Actions
Indirect drivers�
Demographic (urbanization/ migration) Economic processes
(consumption, production, markets, trade) science and technology cultural, social,
political, institutional
Pressures Land use Resource extraction Biomass competition Use of external inputs
Emissions Biodiversity Agro-ecosystems services
Food production (crops and livestock) Fibres, oils, minerals
Biomass / energy Ecosystems services (water, biodiversity,
air quality etc environmental regulation.)
Human wellbeing Food security Poverty Incomes and employment
Human health Resilience and vulnerability
Income diversification Social and gender equality
Context specific options / solutions Technologies, policies and institutions
Trends Scenarios Impacts
Impacts
Responses
Direct drivers� Volume and pattern of demand
Changes in local land use and cover Consumption patterns Water availability Technology adaptation and use Climate change Development context and
systems diversity
Actions Actions
Adapted from GEO-4 (UNEP 2007) and the IAASTD (2007).
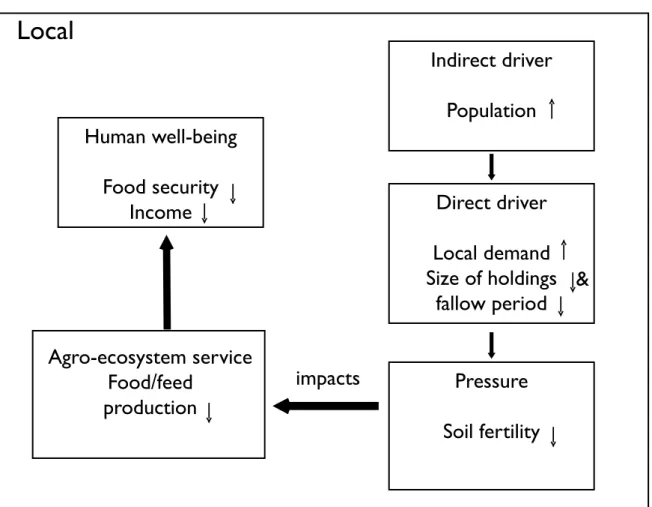
Figure 2 gives a very simple example of the framework and how it relates to a specific crop–livestock system. Consider just the local level, and a group of mixed systems in a region that is experiencing high population growth (the indirect driver). This affects two direct drivers. One is increasing local demand for livestock products. But at the same time, the average size of land holdings is decreasing, and the fallow period is being reduced further and further. The effects of the drivers are (1) capacity in the local market so that extra production could easily be absorbed; and
(2) real pressure on soil fertility that is tending to decline. The impact of declining soil fertility is that food and feed production is declining, and as a result, food security of these smallholders is being compromised and their income is declining.
Figure 2. Overview of a framework and how it relates to a specific crop–livestock system
Local
Human well-being
Food security
Income
Indirect driver
Population
Direct driver
Local demand
Size of holdings
fallow period
Pressure
Soil fertility
Agro-ecosystem service
Food/feed
production
&
impacts
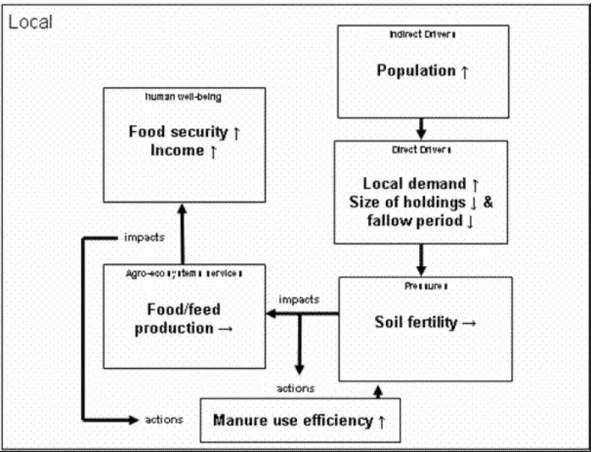
Figure 3 represents the situation after a specific action: here, assume that there is some technology that is taken up that increases the efficiency of on-farm use of manure (this could be something related to manure storage technology that reduces nutrient losses between collection of the manure and its application on plots, for example). This has a direct effect on soil fertility, and allows soil fertility to be maintained. This in turn implies that food and feed production can be maintained, and this has positive impacts on food security and household incomes. Note that here, there is an additional positive feedback from increased food/feed production on manure quality, and this feeds back to soil fertility maintenance via the manure efficiency box (hence the feedback loop on the left of the figure). Note also that in this example, there are really no effects of the ‘action’ on either the direct or the indirect drivers, so there are no feedback arrows on the right-hand side of the figure. Further, there are no direct connections between the drivers and human wellbeing in this example (in either figure), as all the effects are mediated through the agro-ecosystem services box (i.e. these are direct agricultural effects).
2.1 Key drivers of change in crop–livestock systems
The challenges facing economic development in general and livestock-based systems in particular, seem to be increasingly complex. There are many drivers of change operating at a variety of levels (see Hazell and Wood 2008). Some of these are highlighted below.
Population and demographics: The world’s population will reach 7 billion by 2012, and in Africa alone, human population is projected to double to nearly 2 billion by 2050. This is being accompanied by rapid urbanization, which is expected to continue in many developing countries. The year 2008 is a watershed—for the first time, more than half the global human population (3.3 billion) is now living in urban areas. By 2030, this number will have increased to almost 5 billion: the next few decades will see unprecedented urban growth, particularly in Africa and Asia.
Figure 3. Overview of a framework and how it relates to a specific crop–livestock system under a technology intervention
Livestock product demand: The demand for livestock products is rising globally and will increase significantly in the coming decades because of income shifts, population growth, urbanization and changes in dietary preferences; this increased demand will largely be based in developing countries (Delgado 2005). The trends in demand will be for both increased quantity, especially as incomes rise, and for increasing quality, particularly among urban consumers who purchase livestock products from supermarkets. Such factors have enormous consequences for both the volume of global food demand and its composition: these increases in cereals and meat will need to be produced from the same land and water resources as currently exist. While the increased demand will probably be met mostly by increases in chicken and pig production, ruminant populations are also likely to increase substantially.
Changes in food prices: The general trend in relative food prices has been a downward one since the early 1970s (Hazell and Wood 2008), but the period from mid-2007 to today has seen quite remarkable increases in grain prices, largely a reflection of changes in demand. The price of rice has risen in dollar terms from a relative level of 100 in January 2007 to nearly 290 in April 2008 (The Economist, 19 April 2008, p 30), attributed largely to population and income increases and the ‘voracious’ appetites of western biofuels programs. The increases have been so rapid that the impacts on the poor and on farming in general are hard to gauge. The relationship between food prices and high energy prices are complex and difficult to foresee, but high energy prices are very likely to be a continuing feature of the global economy from now on.
Climate change: The world’s climate is continuing to change at rates that are projected to be unprecedented in recent human history. Model projections of the Fourth Assessment Report of the IPCC (2007) suggest an increase in global average surface temperature of between 1.8 and 4.0°C from the present to 2100, the range depending largely on the scale of fossil fuel burning between now and then and on the models used. Moreover, the impacts of climate
change are likely to be highly spatially variable. At mid to high latitudes, for example, crop productivity may increase slightly for local mean temperature increases of 1–3°C, while at lower latitudes, crop productivity is projected to decrease for even relatively small local temperature increases (1–2°C) (IPCC 2007). In the tropics and subtropics in general, crop yields may fall by 10 to 20% to 2050 because of warming and drying, but there are places where yield losses may be much more severe (Jones and Thornton 2003). Changes in climate variability are also projected; although there is considerable uncertainty about these changes, the total area affected by droughts is likely to increase, as are the frequency of heavy precipitation events. Increased frequencies of heat stress, drought and flooding will have adverse effects on crop–livestock productivity over and above the impacts due to changes in mean variables alone (IPCC 2007). Climate change is likely to have major impacts on poor croppers and livestock keepers and on the ecosystems goods and services on which they depend. These impacts will include changes in the productivity of rain-fed crops and forage, reduced water availability and more widespread water shortages, and changing severity and distribution of important human, livestock and crop diseases. Major changes can thus be anticipated in agricultural systems related, for example, to livestock species mixes, crops grown, and feed resources and strategies.
Changes in technology: Historically, new and improved technology has been a key driver of agricultural productivity growth (Hazell and Wood 2008). Many publicly funded international and national agricultural research centres have taken important steps in recent years to better address issues of sustainability related to technology design and development. There have been also considerable developments in the field of natural resource
management in recent years. The trend is, however, for the continuing globalization and privatization of agricultural science; the private sector has much less incentive to undertake this kind of NRM or ‘public goods’ research. Scenario analysis in the IAASTD shows quite clearly that declining investments in agricultural science and technology may have serious implications: agricultural supporting services tend to degrade rapidly, and absolute childhood malnutrition levels may increase, possibly surpassing the malnutrition levels at the end of the twentieth century. In general, much better outcomes in developing country food security can be achieved for relatively modest investment levels (in global terms), trading off improved crop productivity with slightly lower investment levels in irrigation. The issue is how to achieve and make best use of the levels of investment that are required, given the need for an increased role of the private sector in such research and possible intellectual property concerns vs. international public goods.
Changes in sociocultural conditions: The impacts of changes in sociocultural conditions may be profound, but such changes are almost impossible to predict, and their implications may be so far-reaching as to make a mockery of careful assessments based on quantitative models and long-cherished (but erroneous) assumptions and analytical frameworks. These changes can occur at various levels. For example, recent changes in life-style expectations are inducing the Maasai of southern Kenya and northern Tanzania to become croppers and businessmen for example, so as to be much better linked to the market economy and the possibility of generating cash for themselves (BurnSilver 2007). In developed countries, the last 30 years have seen astonishing decreases in the importance that society in general attaches to agriculture and agricultural research. The average age of farmers in North America is about 60. At the same time, the resource base for agricultural research in the North has been undergoing long-term erosion—the plant pathologists, crop breeders, animal scientists, and agronomists of tomorrow simply are not to be found in anything like sufficient numbers. An aging farming population is also the case for many places in the tropics and subtropics, with massive movements off the land to the cities in search of more lucrative income-generating opportunities. The drivers of such changes are partly economic, but they are also partly brought about by complex changes in the sociocultural values of populations.
In summary, agricultural systems are being pulled this way and that in a highly dynamic and complex world. There are difficult trade-offs that have to be weighed up and decided upon if goals related to poverty reduction, social equity, economic growth, and environmental sustainability are to be achieved. There is a need for evidence-based inputs into decision-making at all levels in the hierarchy—from local scales up to the global negotiations required if equitable sustainable development is to be more than a pipedream. There is a considerable amount of work to be done to provide these inputs, including targeting work and scenario modelling, particularly in relation to assessing the impacts of interventions in the future and in evaluating the trade-offs that will inevitably arise between different groups of stakeholders with vastly different objectives and access to resources.
Table 1. Key drivers of change in crop–livestock systems
3 Global trends in agriculture,
agro-ecosystems services and human wellbeing
3.1 Trends in human demography,
livelihoods and economic parameters
Human population
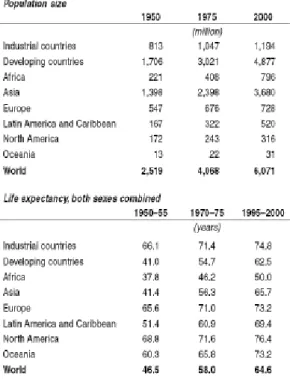
Today’s global population is three times larger than it was at the beginning of the 20th century but most of that growth has been in the past 50 years. From 1900 to 1960 the population increased by little more than a billion (from 1.75 to 3 billion) whereas from 1960 to 2010 it grew by three times as much from 3 billion to 6.8 billion people (US Census Bureau 2010). Although the rate of growth has declined from a peak in the 1960s of more than 2% to the current 1.1%, absolute growth is such that by 2030 the global human population is predicted to reach 9 billion (UNEP 2008). Table 2 shows that between 1950 and 2000 the world population increased from 2.5 billion to more than 6 billion. However, the rate of increase in population has not been commensurate across all regions: the population of industrialized countries increased by less than half in those 50 years whereas that of developing countries nearly tripled. Although Africa shows the highest rate of population growth for that period, increasing by 360% to nearly 800 million in 2000, in terms of absolute numbers of people, Asia is the forerunner: in 2000 it contained 3.5 billion people, three-quarters of the developing world’s population and 60% of the world’s population.
Increases in life expectancy contribute significantly to the growth in population in some places. Globally, life expectancy increased from 46 to 65 years in the second half of the 20th century. Again a large disparity exists
between industrialized and developing countries. In 1950, people in industrialized countries lived, on average, to be 66 years old and by 2000 this had increased by only nine years to 75. In developing countries, the population started from a much lower level, with a life expectancy in 1950 of 41; by 2000, this had increased by 22 years to 62, a much greater increase than in industrialized countries.
The high increase in life expectancy in developing countries has for the most part been led by Asia: citizens of Asia can expect to live 24 years longer than they did in 1950 whereas Africans can only expect to live another 12 years, to 50.
Table 2. Population size and life expectancy between 1950 and 2000 for different world regions
In demographic terms, Asia shows the most noticeable changes in the past half century as, from an already dominant position in terms of population size, it has experienced the largest increase in absolute numbers of people and the largest increase in life expectancy.
In developing countries, most farming systems can be classified into one of the following three categories: livestock only, i.e. agropastoral; mixed rainfed, i.e. where livestock are raised together with crops and where only rainfall is used for irrigation; and mixed irrigated, i.e. where livestock and crops are produced together and artificial irrigation is used (Table 3). Of these three systems, the vast majority of people, over 95%, live in mixed systems and, with the exception of East and South Asia, more people live in rainfed than irrigated systems. However, large regional variations exist. In SSA, only 6.4 million people live in irrigated systems compared to more than 400 million in rainfed farms. This is markedly different from West and North Africa, where roughly similar numbers, around 100 million people, live in each type of system.
Table 3. Population numbers in different farming systems in developing countries
Table 3 also shows the number of poor living within each of these agricultural systems. In agropastoral systems, 63 million people, more than a third of the total, are classified as poor. In mixed systems, the numbers are much larger but the percentages are slightly lower: 31% of people are poor in rainfed systems and 23% in farms that use irrigation. Again, substantial regional variations exist: in SSA and Latin America, regardless of the type of farming, almost half of the farming population is poor, whereas in East Asia, the poor only comprise between 8 and 14% of farmers. Progress in agricultural growth has been dominated by the significant increases in growth in Asia, especially in mixed crop–livestock systems in China. Figure 5 shows that growth in agricultural GDP per capita is lowest in SSA. In most cases, countries with high rates of agricultural value added per capita of agricultural production, such as China, were also good performers in rural poverty reduction.
Figure 4. Expenditure gains in 42 developing countries for a 1% increase in GDP growth
Figure 5 Growth in agricultural GDP in developing countries
GDP per capita
The graph shows that between 1981 and 2003 for 42 developing countries, a 1% growth in GDP originating in agriculture increased the countries’ expenditures within the lowest third of the expenditure declines at least two and a half times more than growth originating in the rest of the economy, i.e. GDP growth originating in agriculture benefits the poorest half of the population substantially more than the wealthiest (World Bank 2007). This stresses the importance of agriculture (and livestock production) for the poor and raises evidence of why investments in pro-poor development interventions need to be related to revitalizing their agricultural sectors (World Bank 2007).
Growth of agricultural GDP in SSA is highly variable among countries and over time. Over the past 25 years, only Nigeria, Mozambique, Sudan and South Africa have maintained agricultural growth rates per capita of agricultural population above two per cent per year; many other countries have had significant periods of negative growth associated with conflicts or economic crises (World Bank 2007).
Rural and urban migrations
For the first time in history more people live in cities than in rural areas. Figure 6 shows that although populations in developing countries are still predominantly rural, rates of immigration to urban areas have been very high since the 1950s. In Latin America and the Caribbean, rural populations now only stand at about 20% of the total population and in developing countries as a whole, at just over 50%. Within the next 20 years this number is predicted to further decrease to the extent that more people will be living in urban areas than rural.
Figure 6. Proportion of total population in developing countries that is rural
Of the 3 billion rural inhabitants in developing countries, an estimated 2.5 billion are involved in agriculture: 1.5 billion living in smallholder households and 800 million working in smallholder households (World Bank 2007).
Poverty rates in rural areas have declined over the past decade, mostly because of impressive gains in economic growth in China. However, 75% of the world’s poor still live in rural areas and rural poverty rates remain high in South Asia and SSA. Rural poverty reduction contributed more than 45% to overall poverty reduction in 1993–2002, with only a small share of that resulting from rural–urban migration. Rural–urban income gaps have narrowed in most regions, except Asia (World Bank 2007).
Figure 7. Rural poverty rates from 1993 to 2002
Food consumption
Supply of food
As shown in Figure 8, Arcand highlighted that a strong correlation exists between income and nutrition: as the amount of food supplied per person increases so does per capita income. Thus increasing average daily energy supplies (DES) can act as a driver of economic growth. In particular, Arcand calculated that increasing the DES to 2700 k cal per person per day in countries that were below that level, could increase the rate of economic growth by up to 1.13% per year.
Figure 8. Association between National Average Dietary Energy Supply and GDP, per capita
Demand for food
Increasing population sizes result in a direct increase in demand for food. At the same time increasing incomes change diets and alter the demand for different foods. In particular, demand for the consumption of high value products increases as incomes rise (Delgado et al. 1999).
For example, the growth rate of per capita consumption of animal food products is determined by economic factors such as incomes and prices and lifestyle changes. Figure 9 shows that in developing countries, per capita consumption of meat and horticulture increased rapidly between 1980 and 1995 (Delgado et al. 1999).
Figure 9. Domestic consumption of meat and cereals in developing countries between 1980 and 2005
Table 4 shows that between 1962 and 2000 in developing countries the per capita consumption of cereals, milk and meat increased but with a heavy skew towards milk and meat products. Root and tuber consumption decreased. Being animal products, an increase in demand for milk and meat requires an increase in the supply of animal fodder. In developing countries, all the crop products required to feed animals to meet this increasing demand come from mixed crop–livestock systems.
Table 4 Changes in food consumption in developing countries
1962 1970 1980 1990 2000
Consumption kg/person/year
Cereals 132 145 159 170 161
Roots and tubers 18 19 17 14 15
Starchy roots 70 73 63 53 61
Meat 10 11 14 19 27
Milk 28 29 34 38 45
Source: Steinfeld et al. (2006).
Figure 10 shows how per capita food consumption in developing countries is shifting to fruits and vegetables, meat, and oils. Although the rate of growth of consumption of oils and meats dropped between 1976–1990 and 1991–2003, it was still more than 1% per year; that of fruit and vegetables continued to increase to reach a high of 3% in the period 1991–2003.
Increasing consumption implies increasing demand for food. About 60% of the rural population in developing counties consists of farmers living in areas of good agricultural potential and with access to markets. In these areas, good opportunities exist for farmers to diversify to higher value products such as milk, meat, fruit and vegetables, and oils. By doing so they can offset a decline which has been seen in prices for cereals and traditional exports such as tea, coffee, rubber and tobacco (World Bank 2007).
Livestock are closely interwoven with the socio-economic status of rural people in developing countries. Livestock contribute to the livelihoods of at least 70% of the world’s rural poor and their livelihoods are enhanced by
strengthening their capacity to cope with income shocks. Most people as well as most poor live in mixed systems. In terms of area, rangeland systems are the largest land use system on Earth, most milk and meat, however, comes and will continue to come from, mixed systems (Seré and Steinfeld 1996; Delgado et al. 1999).
Figure 11 shows how high value exports are expanding rapidly in developing countries (World Bank 2007). Diversification into higher value commodities and off-farm activities is increasingly becoming a key option in mixed farming systems, and, to a lesser extent, in marginal pastoral systems.
Figure 11. Changes in the value of exports of crops in developing countries between 1960 and 2004
Due to high population densities in the mixed systems, higher demands and trade-offs arise in terms of biomass use (food, feed and energy) and ecosystems services.
3.2 Trends in agriculture
Crop production
The increase in human population creates substantial pressure on food and ecological systems, especially in mixed crop–livestock systems. The pressures can differ depending on factors such as the level of development, environmental conditions, resource endowments, and the parallel effects of other drivers such as climate change. Globally, ecosystems have met the rising demand for food over the last 50 years. Figure 12 shows that the availability of basic food items such as cereals has increased at a faster rate than population growth and that yields have increased whilst the area of land being harvested has remained more or less constant (i.e. that production is been successfully intensified). GDP has increased and the price of staple food items for many people is lower than ever.
Figure 12. Trends in selected drivers of food provision worldwide, 1961–2001
Globally, cereal production and yields have been consistently and significantly increasing in the past 50 years. The exception to this is in SSA where production, already lower than elsewhere, has only increased marginally. This has led to a widening of the yield gap between SSA and the rest of the world (World Bank 2007). In most cases increasing yields have been through intensification (increased input use, access to irrigation and crop varietal changes). In SSA, the increases in production have generally been through increases in area planted. These differences are a result of differences in production systems in terms of their agricultural potential, their market access, infrastructure, and population density.
Driven by population growth and expanding markets, traditional agricultural production grew by bringing more land under cultivation. However, in SSA and South Asia, the expansion of agricultural land relative to population density is now decreasing (Figure 14). Therefore, the increasing demand for crop production can only be met by intensification of the current mixed systems.
At the same time, land now used for agriculture is threatened by pollution, salinization and soil degradation from poorly managed intensification. These factors all affect productivity and reduce potential yields. Soil degradation through nutrient mining is a major problem in SSA, though much of it is reversible through better soil management and fertilizer use.
Figure 14 also shows how the area in land under cultivation has increased relative to population size in Latin America, Europe and Central America. However, in some places, notably in Asia’s mixed rainfed systems, population densities are so high that increases in production through area expansion are not possible.
Figure 13. Regional cereal yields between 1960 and 2005
Source: World Bank (2007).
Figure 14. Arable and permanent cropland per capita of the agricultural population
With growing resource scarcity, future food production depends more than ever on increasing crop yields and livestock productivity, especially in mixed systems. However, although absolute yields of cereals have been increasing in developing countries, the rate of increase of these yields has been slowing significantly since 1980 (Figure 15). Whether future technological options will be available to increase crop yields without significant expansion in cropping area still remains to be seen.
Figure 15. Growth rates of yields for major cereals in developing countries
Increasing global food production relative to population size has kept food prices down since the early 1970s. Moreover, as Figure 16 shows, between 1980 and the mid-1990s there was a positive correlation, albeit with some lag, between the global number of undernourished people and food price per capita. This trend was less obvious in SSA.
Figure 16. Global trends in food production and price in relation to undernourishment
From the mid-1990s onwards, the figure for undernourished people began to rise again, and currently even though food prices, which have fluctuated significantly, are now low, the poorer sectors of society are still not in a position to buy the basic staples. Unequal income distribution remains a problem and is increasing.
Livestock production
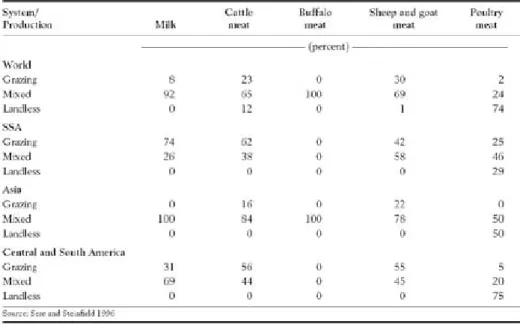
Crop and livestock production tends to be heavily interlinked in most developing countries. As can be seen in Table 6, at a global level, mixed crop–livestock systems account for the bulk of meat and milk production, and in Asia in particular, the use of mixed systems is especially dominant. Grazing-only systems are prevalent in SSA providing nearly two-thirds of cattle meat and three-quarters of milk production.
Table 6. Share of milk and meat outputs by production systems in selected regions
Source: ParthasarathyRao et al. (2005).
Evidence suggests that grazing systems are gradually evolving into mixed systems partly as a consequence of population increases and land fragmentation (ParthasarathyRao et al. 2005).
In farming systems in developing countries the level of intensity of the system is related to the end livestock product. Table 7 shows that beef tends to come from the more extensive systems (though both mixed and livestock only) whereas more than half of all milk production comes from irrigated systems. Chicken and pork are largely produced in industrial systems. These differences reflect the availability of markets as well as the agricultural suitability of the land.
Table 7. Livestock population and production in different production systems in developing countries
In developing countries, the majority of ruminants are found outside temperate regions. This implies they tend to be in arid or semi-arid regions which have very low primary productivity and low yields per animal. Table 8 shows that beef production in the temperate zones is equal to that of the arid and humid zones together, although cattle numbers are three times higher in the latter regions. Thus the large numbers of cattle in extensive, livestock-only systems do not necessarily confer high productivity.
Table 8. Livestock population and production in different agro-ecological zones
The landless and industrial systems of pork and poultry meat are mostly found in humid zones or in the temperate regions and highlands.
Globally, livestock numbers are increasing and at the same time, a larger share of the world’s cereal production is being used for animal feed. This reflects the large increases in (relatively intensive) pig and poultry production to meet human demand. This will create important changes in mixed systems especially, as they produce the bulk of cereals in developing countries.
Past and projected figures for cereal demand for feed can be seen in Table 9. China has been the forerunner in this area, using more cereal for feed than all of Latin America, i.e. about half of the total for the developing world. That dominance is projected to continue to 2020 but by that time consumption of cereals for feed is projected to have doubled from its 1997 levels.
Table 9. Global trends and projections in the use of cereal as feed
Some marginal systems might also benefit from this increased demand, as more land might be converted to produce more crops.
Although large increases in pig and poultry numbers are creating a demand for more feed, significant improvements have been made in the productivity per kilo of feed consumed for these animals. Table 10 shows increases in productivity parameters for pigs and poultry in different world regions. Gains in production efficiency between 1980 and 2005 were made across all regions, but in Latin America and South Asia in particular, these gains were especially large. These increased efficiencies should help to defray the increased demand for grains as feed for pigs and poultry.
Table 10. Key productivity parameters for pigs and poultry in different world regions
3.3 Environmental trends and crop–livestock systems
Climate change
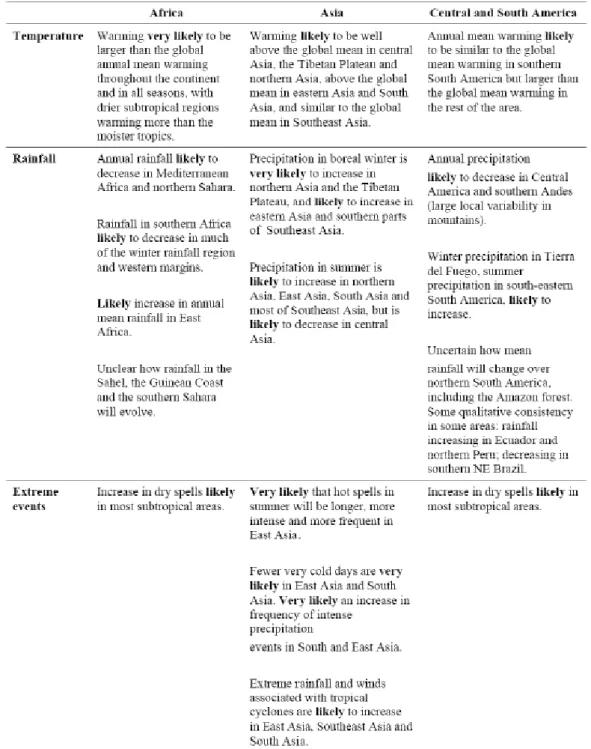
Table 11 summarizes the findings of the IPCC’s Fourth Assessment (Christensen et al. 2007) in terms of the potential changes in weather as a result of climate change on Africa, Asia and Central and South America.
Even though the magnitude of the economic losses may be higher in rich countries than poor, natural disasters tend to have, and are predicted to do so in the future, a greater effect on poorer nations. Poorer countries generally have a worse infrastructure, less advanced technology, and fewer resources with which to finance recovery than rich ones. Figure 17 shows that although between 1985 and 1999 the world’s 10 richest nations lost almost two and a half times more money than the 10 poorest nations, in terms of per cent of GDP, the richest nations lost only a sixth of that of the poorest.
Table 11. Regional climate change projections from the IPCC’s Fourth Assessment
Figure 18. Length of growing period (days per year) for 2000
Source: Thornton et al. (2006).
Figure 19 shows the areas within pastoral and mixed rainfed production systems in arid and semi-arid regions of Africa that are projected to undergo more than a 20% reduction in length of growing period by 2050, under the HadCM3, A1 scenario.
Figure 19. Areas within the LGA (in yellow) and MRA (in green) systems projected to undergo more than 20% reduction in the length of growing period by 2050
These are mostly marginal areas of the Sahelean belt and southern Africa in which pastoral systems and marginal mixed-crop–livestock systems predominate.
Energy use
Economic and population growth, together with a high demand for transportation services and policies (e.g. subsidies) are the top three factors directly driving the growth in demand for bio-energy. Strong world economic growth has pushed up energy consumption, global economic development, especially in developing countries (notably China and India) has helped drive global renewable energy investment. The European Union and the United States are the heaviest investors in this sector followed by China and India.
From population growth alone aggregate energy demand will hit 14 billion tonne oil equivalents in 2030, a 32% increase from 2006. According to the World Energy Outlook 2007, the total 2030 world energy demand will be more than 17 billion tonne oil equivalents, led by China and OECD countries (Table 12).
Table 12. Global projections of energy demand in 2015 and 2030
* Mtoe is millions of tonne oil equivalents.
Source: International Energy Agency’s 2007 World Energy Outlook.
Oil price volatility arising from social and political instability in some oil producing countries has also pushed interest towards bio-energies.
The largest projected increase in energy demand occurs in the transportation sector. Security of fuel for transport has attracted much attention in developing countries. China and India, which together with United States comprise the top three energy consuming countries (International Energy Agency) will consume about 70% of the projected energy demanded by the transport sector from 2005 to 2025. Growth rates of energy demand are expected to be 5% and 4.4% per year for this period for China and India, respectively. So, under mounting pressure to improve domestic energy security and combat global climate change, countries are now turning to ethanol and biodiesel as alternative fuel sources.
Table 13. Global biofuel production and crops
Source: Licht (2006 ).
The principal crops used to produce biofuels are maize, wheat, sugarcane, cassava and sweet sorghum (for bio-ethanol) and rapeseed, soybean, and sunflower seed for biodiesel. Since a number of these crops, such as maize, wheat, and cassava, are also major animal feeds, competition for crops for feed and for biofuel production now exists. This has had the effect of pushing up the price of livestock feed and, consequently, of livestock products.
Cellulose conversion is becoming an economically feasible technology for biofuel production, and may in turn result in competition for fodder and pasture.
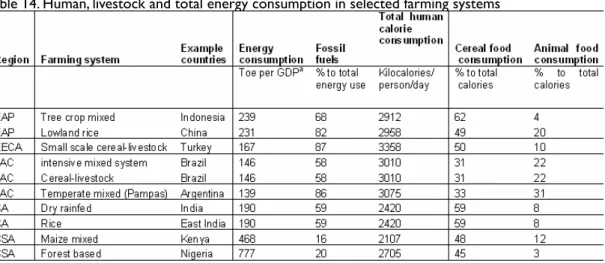
Controversy regarding biofuels comes from the food security for food deficit area, increasing food prices, greenhouse gas emissions and biofuel cost-efficiency (IFPRI 2006; Rosegrant et al. 2006; ODI 2007; Peskett et al. 2007; Tokgoz et al. 2007; Dixon et al. 2008). Impact on crop–livestock production is a key point for the human food consumption and livestock industry sustainable development. Specific impacts need to be investigated at country- and farming system-level based on local energy and resource availability. Table 14 gives examples of the most important regions of the developing world that have significant potential for further biofuel development.
Table 14. Human, livestock and total energy consumption in selected farming systems
Water use
Over the last 40 years the world food supply has increased by about 25% in relation to population growth, from 2250 calories per person per day to approximately 2800 calories per person per day. Although this increase has occurred uniformly across much of the world, Figure 20 shows that whilst the global food supply is only just reaching the threshold for national security, distribution inequalities mean that in many countries in Asia and SSA food supply is still below that needed for food security.
Today, each calorie of food takes approximately 1 litre of water to produce, indicating that the annual amount of water used to produce the world’s food is approximately 7,000 cubic kilometres. Approximately 20% of this is used in irrigated agricultural systems.
Much of the last decades’ increased production of food has come from the expansion of irrigated agriculture. Over the last 50 years there have been enormous developments in water technology for agricultural production. Even after the World Bank dramatically slowed its lending for irrigation infrastructure in the mid-1980s, the global area under irrigation continued to grow. And while the world’s population has more than doubled since 1950, food production outstripped population growth, resulting in a marked decline in food prices. This decline is only just beginning to reverse. Loss of water from natural reserves because of large-scale irrigation and cumulative agricultural activities are now being seen to impact on aquatic ecosystems. One index of aquatic ecosystem health, the Living Planet Index of Freshwater Species has declined dramatically.
Figure 20. Global changes in food consumption from 1961 to 2003
Figure 21. Investing in irrigation based on FAO and World Bank data
In the Comprehensive Assessment of Water Management in Agriculture (2007), scenarios were presented that define the land and water required at a global level to produce enough food to feed the population in 2050. In an optimistic rainfed scenario reaching 80% maximum obtainable yields while relying on minimal increases in irrigated production, the total cropped area would have to increase by only 7%, and the total increase in water use would be 30%, with direct water withdrawals increasing by only 19%. In contrast, focusing on irrigation first could contribute 55% of the total value of food supply by 2050. But that expansion of irrigation would require 40% more withdrawals of water for agriculture, surely a threat to aquatic ecosystems and capture fisheries in many areas. The factors that contribute to optimistic and pessimistic estimates of total water needs are primarily differences in water productivity. Without gains in water productivity, water resources devoted to agricultural production will likely increase by 70 to 90%. On top of this is the amount of water needed to produce fibre and biomass for energy.
Figure 22. Some examples of scenario options