ISSN: 2252-8938 , DOI: 10.11591/ijai.v6.i1.pp33-48 33
Time-Based Raga Recommendation and Information Retrieval
of Musical Patterns in Indian Classical Music Using Neural
Networks
Samarjit Roy1, Sudipta Chakrabarty2, Debashis De3 1
Department of Computer Science and Engineering, Techno India Silli 2
Department of MCA, Techno India Salt Lake 3
Department of Computer Science and Engineering, West Bengal University of Technology
Article Info ABSTRACT
Article history: Received Nov 6, 2016 Revised Jan 10, 2017 Accepted Feb 19, 2017
In Indian Classical Music (ICM) perspective, Raga is formed from the different and correct combination of notes. If it is observed the history of Indian Classical Raga in ICM, the playing or serving each of the ragas has some unique sessions. The procedure is to suggest the classifications of playing a raga has been attempted to display by explaining unique musical features and pattern matching. This contribution has been represented how music structures can be advanced through a more conceptual demonstration and consent to unambiguously describe process of computational modeling of Musicology which signify the challenge on complete musical composition from the elementary vocal objects of ICM usage using Neural Networks. In Neural network the samples of various ragas have been taken as input and classify them according to the times of the performance. Over 90% accuracy level has achieved using entire Confusion Matrices and Error Histogram performance evaluation technique.
Keyword: Music
Neural Networks Notes
Pitch Raga
Copyright © 2017 Institute of Advanced Engineering and Science. All rights reserved. Corresponding Author:
Samarjit Roy,
Department of Computer Science and Engineering, Techno India Silli,
Silli, Ranchi-835102, Jharkhand, India. Email: samarjit.tech89@gmail.com
1. INTRODUCTION
The Raga in Indian Classical music is explained as the extraordinary amalgamation of the set of notes arranged in a unique sequence which has been created the undergoing musical emotion to the audiences. If all the ragas and there corresponding features will be contemplated in object-oriented manner, then it must be belonged to sub-class under a parent or super class which is known as ‘Thhat’ in Indian Classical music. The Thhat is nothing but the numerous distributions of musical notes and the note-structures. In Indian Classical Music, there are ten thhats and twelve notes. Among the twelve notes there are seven pure notes and five scratched notes available. Each thhat exactly consists of seven notes out of entire twelve notes and the notes are used to be arranged in ascending orders. All the ragas must belong to any one of the ten thhats. The Structures of the notes in a particular raga can be shown discrepancies due to the fruitful audibility to the audiences and variants of the singers or vocalists as well nevertheless numerous notes will always be intact to intone by which note or set of notes exact raga or its corresponding Thhats have been categorized. The previous history of Indian music said the explicit explanations about the raga characteristics and the actual timing of playing the ragas.
The Neural networks are self-possessed of trouble-free elements working in analogous systems or essentials. These elements are habitually motivated by biological nervous systems and as designs and operations perspectives, they are similar to the operations of human beings. As in nature, the network
function is defined principally by the associations among elements. A neural network can be trained to perform a particular function by amending the ideals of the connections namely weights between elements. Frequently neural networks are familiar or trained, as if a particular input escorts to a precise target output. Such a situation has been shown in to this contribution below. In this contribution the network is adjusted, depending upon a comparison of the production and the target, until the network output is equivalent to the target.
Here in this contribution, the time-based raga recommendation and modeling on the actual playing time of raga are analyzed. The ragas are classified with the help of neural networks which divides the set of raga samples into two classes of times or sessions of performances namely, ‘Purvango’ (from 12 pm to 12 am) and ‘Uttarango’ (from 12 am to 12 pm). The information processing neurons of the neural network are trained by the dataset and then tested by a number of samples. The training procedure has been continued till the optimum accuracy occurred of the execution.
Due to several disparities in notes structures usually denoted in Indian Classical Music for defining the thhats the unique characteristics of ragas also must be fluctuated. Here in this contribution, the time-based raga recommendation and modeling on the actual playing time of raga are analyzed.
2. RELATED WORKS
Computer-based exploration on fundamental musical features, their corresponding rhythmic cycles and attributes of Classical music has been relatively sporadic, and up to this point of view remarkable attempts have been made to categorize the vocal and rhythmic formations by design. On the contrary, the recognition of the patterns in Hindustani Classical Ragas has been an intimate area where several challenges have been prepared to perceive a quantity of distinction among the raga blueprints and analogous rhythmic features. In a paper, the researchers demonstrated a survey on computationally supported musical composition by focusing on Petri Nets and gave several major paths of their applications. On this basis in terms of Petri nets this efforts provided innovative steps for making these labors operational in concrete computerized environments, not just at the level of formal abstraction [1]. The authors have elaborated the alternative approaches for exploring and relating to the design and function of the software project "Nodal". This particular work aims to create a graphical environment that enables the user to configure a spatial, directed graph that generates music in real-time systems. They referred to such graphs as composition or nodal networks. The discussion in this work has been related to the fundamental design constraints that have been imposed within these constraints that give rise to different musical behaviors [2]. In another piece of works the author has described and researched on the computational music theory which has been established by John Clough. According to the thought of Computational Music, this has been resolute that the research of John Clough was not only restricted to the mathematical theory but also surrounded in sciences and humanities too. The author has illustrated also the specific and generic intermission which is known as the Myhill’s property [3]. The researchers have afforded the performance of music can improve the behavioral performances like the human intelligence systems in both structural and functional altitudes. A particular music can lead to think an listener to improve some behavior domains of music like the vocal performance namely the language that might be more fruitful. The authors have also explored the future trend about the interrelationships among music and the languages [4]. The authors in their paper [5] have mentioned the music in the pedagogy of mathematics which has been developed by Mathematical Music Theory. The fundamental intension of the authors is elaborated to popularize the musical project broadly Mathematics and Music form the regional culture to international level. They also view to create the didactic materials by which all can gather the novel ideas and sketches about Mathematical Music theory. Additionally, the researchers exercised the method of time series analysis to compare the expertise groups and individuals in dynamic unremitting discernment of arousal in music. For testing the validity they used the general linear autoregressive moving average [6]. The authors have evidently represented the explication and discussion of methodologies in computational, mathematical and statistical music approach [7]. The authors have also here discussed the inter-association of music with science, cognitive science and humanities. In a dissertation the raga has been approached and identified to recognize from a regional music performance like Carnatic music signal. The method has been deployed to separate the vocal data and instrumental performances from a polyphonic music signal through signal separation algorithm. According to only the vocal data retrieval, the notes have been recognized by their initial frequencies [8]. In a contribution the musical emotion recognition system has been present developed by the one-class-in-one phenomena of neural networks [9]. Here the system is entirely speaker and context-independent. Additionally, string rewriting grammars based on L-Systems have been adopted into a harmonization for music masterpieces. Illustration of pitch periods,
alteration and habitual dictation in solo performance in Tabla [11]. About the attribute assortment and mining instrument from the unusual variety of musical instruments that worn as the stuff in music is symbolized in class pair-wise comportment [12]. Additionally in several efforts by the authors have been described the musical pattern recognition and rhythmic features exposures by object-oriented manner [13-14]. A lot of discussions are available about the features classification using UML-oriented class diagrams and the way of implementations of musical rhythmic cycles for the percussion-based instruments [15-16]. The automated rhythm generation is one of the hardest problem areas. This is because of constraints and satisfying those constraints to get the feasible and optimized rhythm. In an effort by the authors have been modeled (Quality Measure model) an optimized algorithm on rhythmic cycles used in Indian Classical Music using the Roulette-Wheel Selection of Genetic Algorithm Concept [18]. Several papers have been considered those are based on the creativity of music using Genetic Algorithm technique. Further some other papers deal with the implementation of Musical pattern recognition by mathematical expressions. They suggested a new method for arranging different melodious audio stream into some specific type of classes based on object oriented paradigm. In a paper, the authors have explained elaborately the notes and the notes structures as well as the ten thhats or raga origin in Indian classical music which is imposed to be constructed the songs in Indian or Hindustani musical patterns. The algorithm has been defined here which can determine the thhat or raga origin in which a song in Indian music belongs [17]. Some researchers introduce a system for recognition of the patterns of music by using key sequences with Recursive Median Filter [19]. Several contributions have been depicted upon audio or speech recognition systems which are content based, featured-based parameterization for music information retrieval using Neural Networks approach as well [22-23, 25-26] In an effort the audio characteristics also modeled those are emanated from the hearing aids using Neural Networks with user input [24]. The works of the researchers have elucidated also the entire music composition and classification by neural approaches [29-30] as well as their semantic, episodic [28] and music-emotion behavior [31-32]. The supporting themes upon music i.e., instrumental performances which has also been classified productively [33] using their performing features [34, 36]. The classical music orientations have been done in several contributions using some modeling concept like Petri net [38-39]. The context-aware pervasive diary for music computing has been discussed by Linear Rank Selection mechanism of Genetic Algorithm [40]. Numerous approaches are based on musical features extraction from the Indian Classical Raga or instrumental rhythms [41-43]. The authors have explicated the formations of musical pieces by fuzzy logic [45] and constraints by integration of DSP algorithms [46]. The contributions of the researchers have also been highlighted to the novel approaches for music recommendation [47-48]. Quite a few toils have clarified the actual musical features of Indian Classical vocal and rhythmic distinctiveness and their corresponding pitch value analysis [49-56]. This has been supportively explained in this framework to the aforesaid procedural mechanism to explore a pioneering mode of depiction of musical features and pattern matching trials based on Neural Networks concepts.
3. RESEARCH METHOD
In the perspective for creating Indian Music, there are basically two rudiments. It must follow an internal skeleton like Indian Classical Raga and a specific rhythm. The entire vocal ingredients use to develop by following the fundamental raga-features of music. All the ragas are the variations of elementary musical notes recognizing uniquely the thhats. According to the sense of musical theory and the unique characteristics of note-structures the thhats and ragas are to be developed.
In Table 1, the actual time of singing, used unique notes only on the particular time duration, thhats used on that time and several corresponding ragas are mentioned. On the duration of playing the raga sets of common musical notes also are included but the unique notes should be present according to the table mentioned.
Raga Time-Cycle is the broad sense of raga-features analysis according to the revolution of time or session. It is alienated with the time. All the twenty-four hours of a day is divided into twelve fragments with the every two hours of intervals. For ‘uttorango’ session there are eight divisions and duration of 4am to 4 pm as Dawn, Early Morning, Morning, Late Morning, Afternoon and Late Afternoon. In this session, all the ten unique Classical Thhats are varied with the featured-ragas. Unique notes are categorized in the raga-time table Table 1. For ‘Purbango’ session there are eight divisions and duration of 4pm to 4 am as Dusk, Evening, Late Evening, Night, Midnight and Pre-Dawn. In this session, nine of all the ten unique Classical Thhats are varied with the featured-ragas. In both of these sessions, variations of all the classical notes remain almost intact as well as almost nine thhats are same. Both of these two sessions contain twelve hours and six fragments. Nevertheless, the raga features and used-raga are different for both ‘Uttorango’ and ‘Purbango’ sessions.
Table 1. Time Division of Classical Ragas
Time of Playing Notes Thhat Raga
Uttorango (Day session)
4am- 7am re, dha, Ga Bhairav Purvi Marwa
Ramukeli Parasbasant
Lolit 7am- 10am Re, Dha, Ga Bilawal
Kalyan Khamaj
Deshkar Gousarang
Gara
10am- 4pm ga, ni Kafi
Asabari Bhairavi Todi
Bhimpalasree Jounpuri Bhairavi Bilaskhani-Todi Purbango
(Night session)
4pm- 7pm re, dha/Dha, Ga Bhairav Purvi Marwa
Gouri Purvi, Sree
Marwa 7pm- 10pm Re, Dha, Ga Bilawal
Kalyan Khamaj
Durga Imankalyan Khamaj, Joyjayanti
10pm- 4am ga, ni Kafi
Asabari Bhairavi
Kafi Anara Malkosh
Figure 1. Time Cycle of Indian Classical Music
In the note-based table mentioned as Table 2, there are all twelve notes are explained for the occurrences with five individual raga explained in different five sessions in both ascending and descending orders. From these notes analysis patterns there are also be included the ‘Jati’ or species of raga, ‘Vadi’ or most significant notes and ‘Samvadi’ or immediate second most significant notes are described according to the occurrences of the unique notes out of twelve individual notes.
Table 2. Several Note-Distribution Examples among Ragas in Indian Classical Music Raga
Notes Kalyan Jaunpuri Bahar Bhairavi Bhimpalasree
Aroha Sa/C √ √ √ √
re/ C# √
Re/D √ √
ga/ D#/Eb √ √ √
Ga/E √
Ma/F √ √ √ √
ma/ F# √
Pa/G √ √ √ √
dha/ G# √ √
Dha/ A √ √
ni/ A#/Bb √ √ √ √
Ni/ B √ √
Sa/C √ √ √ √ √
Aboroha Ni/B √
ni/A#/Bb √ √ √ √
Dha/A √ √
Dha/G# √ √
Pa/G √ √ √ √ √
ma/F# √
Ma/F √ √ √ √ √
Ga/E √
ga/D#/Eb √ √ √ √
Re/D √ √ √ √
re/C# √
Sa/C √ √ √ √ √
Jati/ Species 6-7 6-7 6-6 7-7 6-7
Vadi/ Dominant Ga/E Sa/C Ma/F Pa/G Ma/F Samvadi/
Semi-Dominant
Ni/B Pa/G Sa/C Sa/C Sa/C
Table 3. Frequency – Ratio Table of Twelve Notes Sa/C re/ C# Re/ D ga/
D#/Eb Ga/E Ma/ F ma/ F# Pa/G dha/ G# Dha/ A A#/Bni/ b Ni/ B 1.000 1.054 1.125 1.186 1.253 1.333 1.415 1.500 1.580 1.691 1.777 1.893
The frequency-ratio is determined in Classical Music analysis for evaluating the possible initial frequency of notes and the frequency ranges initiated for all twelve notes. Frequency Ratios for twelve notes exist in between the initial notes in ascending order arrangement, ‘Sa’ of lower octave up to the ‘Sa’ of higher octave is 2:1. Hence, all the frequency-ratio values of each and every note are arranged with respect to initial ‘Sa’ of same octave which deceits between 1 and 2 in the frequency-ratio table. The ratio of all the notes including the preliminary ‘Sa’ itself uses to be specified with respect to ‘Sa’ note. The frequency-ratio table, Table 3 are illustrated the calculated frequency ratios in ascending order of twelve musical notes.
4. METHODS OF ANALYSIS
We have discussed already that the music or audio signal cannot be expressed by the linear mathematical equations only. Because the linear signal expression normally explains by the equations where the parameters obligatory like, novel frequencies, the times necessitated for continuous time signals or the quantity of samples used for discrete time-signals and amplitudes. Whether the amplitudes should not be measured by the speech recognition systems here to extract the pitch periods and the corresponding pitch values of every notes since a lot of singers can play a particular music or the raga in Classical music in various etiquettes. So, for a particular music, total amplitude in a playing session should be varied with time. Hence, here initially the pitch analysis or initial frequency analysis is required for extracting the musical features uniquely. In this particular raga analysis concept in the very beginning input is clearly a song usually
5-7 AUDAV – SAMPOORNA
6-7 SHADAV – SAMPOORNA
6-6 SHADAV – SAMPOORNA
taken in .wav file format. The extractions of pitch values from the vocal and rhythmic-patterns of music are very intricate because the initial frequencies namely pitch of most of the musical notes and rhythmic beats of instruments are similar and so little fractional disparities which are roughly ignored. Here for the pitch extraction purposes, the Wave Surfer Software has been applied. The file type should be monotonic for extraction and sample encoding has been set to line-16. The sample rate is to be fixed in 22050. It is opened in a waveform structure. From the Structure a pitch contour of that song is generated. In this circumstance the pitch form will give all the pitches used in the song, and the pitch data are to be saved in an excel sheet. The pitch data are to be sorted in ascending order but there occur some 0 values that are to be deleted. The rest of the pitch values from this pitch contour are used to be set into the middle octave according to the fundamental frequency range listed in the Table 4. In Indian Classical Music the twelve musical notes are used to create and develop a music including seven pure notes and five scratched notes. By the fundamental frequency range analysis Table 4 the pitch value set has been distributed into twelve groups according to the sequences of the elementary note structures. From these twelve groups of basic note-structures, the highest occurrence of primary frequency range has been initiated. This highest frequency value out of twelve frequency ranges is known as the most significant note or ‘Vadi’ in Indian Classical music. After the evaluation of the most significant note, the rests of the frequency ranges are evaluated by the frequency-ratios of fundamental twelve notes in ICM. The musical patterns are estimated here for recognizing the notes by using their corresponding pitch values. Hence the matching between evaluated rests of the frequency ranges with the fundamental frequency ranges of actual music. This has to be seen whether the matched notes are estimated as used notes of the input audio file. If the matching analysis has successfully done, then this has to be seen that whether this used notes are guesstimated precisely with the time-based note and their corresponding features table and raga time-based circle. The entire flow of the activities to extract the frequencies, calculating middle octave, searching in logical way for Most Significant Note of a particular vocal performance, matching notes estimations that exist in a raga performance etc. are briefly explained in Figure 2 as a flow-chart. The analysis under this meticulous concept has been evidently visualized that in this approach the musical patterns are optimally distinguished among there notes described in the raga classification and recognition. This method is also applicable for the musical notes and pattern classifications.
Table 4. Musical Notes and their Fundamental Frequency Ranges Western Notes Indian Notes Frequency Range
A Dha 215.5 – 226.5
A# ni 226.6 – 239.9
B Ni 240.0 – 252.5
C Sa 252.6 – 269.5
C# re 269.6 – 285.3
D Re 285.4 – 302.3
D# ga 302.4 – 320.3
E Ga 320.4 – 339.3
F Ma 339.4 – 359.4
F# ma 359.5 – 380.9
G Pa 381.0 – 403.5
Figure 2. Flow-Chart for Determination of Raga from a Complete Music
4.1. Features Extraction
For time-based classification of raga, three basic features are extracted in the experiment–
1. Number of notes (swaras) present in a raga from the 12 notes of Indian classical Music (Using wavesurfer….).
2. The combination of notes of a particular raga.
3. The Most Significant Note (Vadi Swar) which is used most frequently in a raga (Using wavesurfer…..). Combination of notes or swara combination is the basic set of notes which is used in a particular raga. The combination of notes can be represented by binary bits. The binary sequences of bits are converted into decimal.
For example, raga Kalyan uses the note’s combination – sa Re Ga ma pa Dha Ni. So, the binary bit sequence which represents the combination of notes is in the table.
Table 5. Combination of Notes in the Raga ‘Kalyan’/ Thhat Kalyan Sa/C re/ C# Re/ D ga/
D#/Eb
Ga/E Ma/ F ma/ F# Pa/G dha/ G# Dha/ A ni/ A#/Bb
Ni/ B
1 0 1 0 1 0 1 1 0 1 0 1
The binary sequence is – 101011010101. The note ‘Sa’ is present in every raga, so ‘Sa’ can be omitted from the binary bit sequence. By omitting ‘Sa’, the resultant binary bit sequence is – 01011010101 whose decimal value is 693. By this way decimal values of note’s combination for all ragas are calculated.
4.2. Experiment Details 4.2.1. The neural network
The classification of ragas based on their playing time is done by using a two layer feed-forward neural network which is shown below:
Figure 3. The Complete Net of the Proposed Analysis
The Figure 3 is the complete net of neural network which has one input layer, one output layer and one layer between the input layer and the output layer which is called the hidden layer. The input layer does not take part in any computing regarding classification. The computation occurs only by the neurons present in the hidden layer and the output layer. So the neural network is two layers Neural Network. The inputs are fed from input layer to the hidden layer and then to the output layer. So the network is feed forward neural network. The Figure also shows that the network uses sigmoid function as the activation function in both of the hidden and the output layer. Three features of each sample are applied on the input layer of the neural network and hence the input layer has three neurons. The output layer has two neurons as the input data have to be classified into two classes – Purvango and Uttarango.
The number of hidden layer may vary according to the application requirement and accuracy requirement. In most application, one hidden layer is sufficient. In this experiment, the hidden layer has 15 neurons or computation nodes which also may vary according to accuracy requirement.
4.2.2. Training and Testing
Total 92 samples are collected from 23 ragas for this classification experiment. The dataset contains the numerical values of three features of each sample. For training, 70% of total samples have used and 15% samples have used for testing. Rest of 15% samples have used for validation purpose. The weights are generated by the system according to the given input. The following table 6 shows the features of 15 ragas:
Table 6. Dataset of Three Basic Features of the Raga
No. Raga Features Calculated
No. of Notes Combination of notes Most Significant Note (Vadi)
1 Yaman 7 693 320
2 Vilaval 7 727 216
3 Kafi 7 854 381
4 Bihag 7 725 320
5 Asabari 7 858 404
6 Bhairavi 7 1370 360
7 Desh 7 727 285
8 Bageshri 7 854 360
9 Durga 5 596 360
10 Jounpuri 7 858 404
11 Malkosh 5 330 360
12 Kedar 7 757 360
13 Patdwip 7 853 381
14 Bhairav 7 1241 404
15 Bhupali 5 660 320
5. PERFORMANCE ANALYSIS
5.1. Confusion Matrix
Performance of a classification can be best seen with the help of the Confusion Matrix. Confusion Matrix contains the information about accuracy of the classification between the actual and predicted classes done by the classification system. The Confusion matrix helps to evaluate the performance of the classification system using the data present in the matrix. According to the Confusion Matrix of the classification done by the proposed system, each column represents the Target or Actual class and each row represents the Output class or Predicted class. There are two classes for classification- a) Purvanga (class 1) b) Uttaranga (class 2).
Figure 4. Confusion Matrices
Figure 1 shows the four confusion matrices – Training, Validation, Test and All confusion matrices. Each row of the matrix represents the Output or predicted class and each column represents the Target or Actual class. The green squares denote the number of samples which are correctly classified by the classifier, and the red squares denote the number of samples which are incorrectly classified. The blue squares denote the overall percentage of correct classification. It is assumed that if the outcome of the classification is the member of class Night Session (class 1), then they will be treated as negative outcome and if the outcome of the classification is the member of class Uttaranga (class 2), they will be treated as positive outcome.
5.2. Training Confusion Matrix
Training Confusion matrix in Figure 5 demonstrates the percentage of correct classification during Training by the samples. In this experiment, total 92 samples of 23 ragas are collected and 70% of the total samples are used for training i.e. (70% of 92) or 64 samples are used for training.
Figure 5. Training Confusion Matrix
No. of Correctly Classified Samples No. of Incorrectly Classified Samples
Table 7. Result Set of Training Confusion Matrix Training Confusion Matrix
No. of Samples
Name of Class
No. of samples assigned to
Class
TP TN FP FN
Percentage of Samples predicted
Percentage of Assigned
Samples
Overall Percentage
64 1 37 0 37 0 0 100 88.1 92.2
2 22 22 0 0 5 81.5 100
TP: True Positive; TN: True Negative; FP: False Positive; FN: False Negative
According to the Training Confusion Matrix and outcomes represented correspondingly in Figure 5 and Table 7, 37 samples are correctly assigned to class 1. Therefore, True Negative Value is 37. 0 samples are assigned to class 2. Therefore, False Positive Value is 0. 100*(37/37) = 100% of class 1 samples are predicted as class 1 correctly. 22 samples are correctly assigned to class 2. Therefore, True Positive Value is 22. 5 samples are assigned incorrectly to class 1 but they are member of class 2. Therefore, False Negative Value is 5. 100*(22/27) = 81.5% of class 2 samples are predicted as class 2 correctly. 100*(5/27) = 18.5% of class 2 samples are predicted incorrectly as class 1. 100*(37/42) = 88.1% of assignment of class 1 are correct. 100*(22/22) = 100% of assignment of class 2 are correct. The percentage of overall correctly classified data for training is ((37+22)/ (37+5+22))*100 = 92.2%.
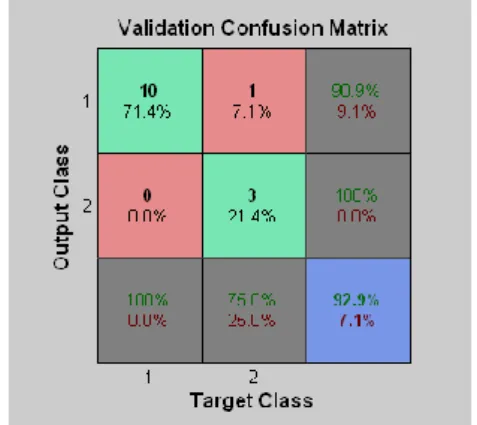
5.3. Validation Confusion Matrix
Validation Confusion matrix in Figure 6 displays the percentage of correct classification during Validation of the samples. In this experiment, 15% of total samples are used for validation i.e. (15% of 92) or 14 samples are used for validation.
Figure 6. Validation Confusion Matrix
Table 8. Result Set of Training Confusion Matrix Validation Confusion Matrix
No. of Samples
Name of Class
No. of samples assigned to
Class
TP TN FP FN
Percentage of Samples predicted
Percentage of Assigned
Samples
Overall Percentage
14 1 10 0 10 0 0 100 90.9 92.9
2 3 3 0 0 1 81.5 100
TP: True Positive; TN: True Negative; FP: False Positive; FN: False Negative
According to the Validation Confusion Matrix and outcomes characterized in Figure 6 and Table 8 correspondingly, 10 samples are correctly assigned to class 1. Therefore, True Negative Value is 10. 0 samples are assigned to class 2. Therefore, False Positive Value is 0. 100*(10/10) = 100% of class 1 samples are predicted as class 1 properly. 3 samples are correctly assigned to class 2. Therefore, True Positive Value is 3. 1 sample is assigned incorrectly to class 1 but they are member of class 2. Therefore, False Negative
100*(3/3) = 100% of assignment of class 2 are correct. The percentage of overall correctly classified data for training is ((10+3)/(10+3+1))*100 = 92.9%.
5.4. Test Confusion Matrix
Test Confusion matrix in Figure 7 demonstrates the percentage of exact classification during testing of the samples. In this experiment, 15% of total samples are used for testing i.e. (15% of 92) or 14 samples are used for validation.
Figure 7. Test Confusion matrix Figure 8. All Confusion matrix
Table 9. Result set of Training Confusion Matrix Testing Confusion Matrix
No. of Samples
Name of Class
No. of samples assigned to
Class
TP TN FP FN
Percentage of Samples predicted
Percentage of Assigned
Samples
Overall Percentage
14 1 9 0 9 0 0 100 90.9 85.7
2 3 3 0 0 2 60 100
TP: True Positive; TN: True Negative; FP: False Positive; FN: False Negative
According to the Validation Confusion Matrix and result dataset characterized in Figure 7 and Table 9 respectively, 9 samples are correctly assigned to class 1. Therefore, True Negative Value is 9. 0 samples are assigned to class 2. Therefore, False Positive Value is 0. 100*(9/9) = 100% of class 1 samples are predicted as class 1 acceptably. 3 samples are correctly assigned to class 2. Therefore, True Positive Value is 3. 2 samples are assigned incorrectly to class 1 but they are member of class 2. Therefore, False Negative Value is 2. 100*(3/5) = 60% of class 2 samples are predicted as class 2 acceptably. 100*(2/5) = 40% of class 2 samples are predicted wrongly as class 1. 100*(9/11) = 90.9% of assignment of class 1 are correct. 100*(3/3) = 100% of assignment of class 2 are correct. The percentage of overall properly classified data for training is ((9+3) / (9+3+2))*100 = 85.7%.
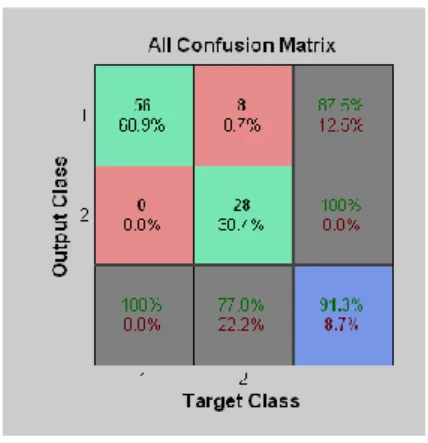
5.5. All Confusion Matrix
All Confusion matrix in Figure 8 illustrates the percentage of overall correct classification of the samples.
According to the All Confusion Matrix and result set characterized in Figure 8 and Table 10 respectively, 56 samples are correctly assigned to class 1. Therefore, True Negative Value is 56. 0 samples are assigned to class 2. Therefore, False Positive Value is 0. 100*(56/56) = 100% of class 1 samples are predicted as class 1 correctly. 28 samples are correctly assigned to class 2. Therefore, True Positive Value is 28. 8 samples are assigned incorrectly to class 1 but they are member of class 2.
Therefore, False Negative Value is 8. 100*(28/36) = 77.8% of class 2 samples are predicted as class 2 correctly. 100*(8/36) = 22.2% of class 2 samples are predicted incorrectly as class 1. 100*(56/64) = 87.5% of assignment of class 1 are correct. 100*(28/28) = 100% of assignment of class 2 are correct. The percentage of overall correctly classified data for training is ((56+28) / (56+28+8))*100 = 91.3%.
Table 10. Result set of All Confusion Matrix All Confusion Matrix
No. of Samples
Name of Class
No. of samples assigned to
Class
TP TN FP FN
Percentage of Samples predicted
Percentage of Assigned
Samples
Overall Percentage
92 1 56 0 56 0 0 100 87.5 91.3
2 28 28 0 0 8 77.8 100
TP: True Positive; TN: True Negative; FP: False Positive; FN: False Negative
5.6. The ROC Curve
The Receiver Operating Characteristics (ROC) curve is useful for visualize the performance of a classifier. ROC curve is drawn by plotting True Positive Rate (TPR) along the Y-axis and False Positive Rate (FPR) along X- axis. The upper and lower limit of the x axis and y axis are 0 and 1. True Positive Rate (TPR) and False Positive Rate (FPR) can be calculated by the following equations:
(1)
And
(2)
Where,
TP (True Positive) – The positive instances correctly classified as Positive. FP (False Positive) – The negative instances incorrectly classified as Positive. FN (False Negative) – The positive instances incorrectly classified as Negative. TN (True Negative) – The negative instances correctly classifies as Negative. TPR is also known as Sensitivity and FPR is also known as Fall-out.
A classifier performs a good classification if its ROC curve is nearest to the upper left corner which implies higher value of TPR, i.e., correct classification of instances or samples.
An ROC space has a diagonal line which is called No-discrimination line. The diagonal line in the ROC space divides the space into two parts – the line above the diagonal implies good classification, the curve below the line implies bad classification and the curve on the diagonal implies random classification.
The classification in this experiment has been specified by four ROC curves – 5.6.1. Training ROC Curve
The performance of classification during training in this experiment is shown in Figure 9 below:
Figure 9. Training Receiver Operating Characteristics (ROC) Curve
Figure 10. Validation Receiver Operating Characteristics (ROC) Curve
5.6.2. Validation ROC Curve
The performance of classification during validation in this experiment. In the above Figure 10, it is shown that the ROC curve passes exactly through the point (0,1) at the upper left corner which implies 100% value of TPR i.e., Perfect classification.
5.6.3. Test ROC Curve
The performance of classification during testing in this experiment is publicized in Figure 11.
Figure 11. Test Receiver Operating Characteristics (ROC) Curve
Figure 12: All Receiver Operating Characteristics (ROC) Curve.
In the above Figure 11, it is shown that the ROC curve is much near to the upper left corner but less nearer from the curve of training which implies good classification but not as much better as training.
5.6.4. All ROC Curve
The performance of classification during testing in this experiment is shown in Figure 12. In the above Figure 12, it is shown that the ROC curve is very much near to the upper left corner which implies higher value of TPR i.e., good classification.
5.7. Error Histogram
Error Histogram is a quick visual summary of the error occurred during training, validation and testing for classification. It is a graphical representation of frequency of errors. Basically, Histogram in neural networks is a function which counts the number of errors which fall into different and disjoint numerical category of errors which is called ‘Bins’. The Error Histogram of the experiment of time-based classification of ragas is given below:
In Figure 13, the graph demonstrates the errors during training, validation and testing are plotted along X-axis, and the instances i.e., frequencies of occurring those errors are plotted along Y-axis. The ‘Zero Error’ line appears at that point where the error is minimum – 0.01314. The negative error values imply that output value is greater than the target value and the positive error values imply the reverse. The graph has 20 bins which mean 20 different numerical categories of errors. This graph also depicts that some errors occur only during training and testing, not during validation.
6. CONCLUSION
A raga in Indian Classical Music has a very complex nature since the raga presentation is the complete amalgamation of vocal and instrumental performance. Hence to classify the ragas on their basic features is very tedious job. The proposed method performs sound for the monophonic songs which means for only vocal patterns of the song or raga in Indian Classical Music. Although in this tiny venture the emotional features of musical performances in Indian Music are not explicable, in the prolific music prospect the musical pieces are elucidated by the copious sessions of performances of Raga usually play by the vocalists. This method can be further improved to classify the raga performed with instruments and rhythms. This classification also based on two broad classes of performing time of a raga. This can be improved by dividing the given samples into more specific performing session of a precise time like morning, noon, afternoon, dawn etc.
REFERENCES
[1] Denis Trcek, Gasper Trcek. Computationally Supported Musical Composition Using Petri nets. WSEAS International Conference. Proceedings. Recent Advances in Computer Engineering Series. WSEAS, 2013; 11: 149-152.
[2] Peter Mcilwain, Jon McCormack. Design Issues in Musical Composition Networks, Generate and Test. Proceedings of the Australasian Computer Music Conference, 2005: 96 – 101.
[3] David Clampitt. The legacy of John Clough in mathematical music theory. Journal of Mathematics and Music. Taylor and Francis. 2007; 1(2): 73-78.
[4] Sylvain Moreno. Can Music Influence Language and Cognition?. Journal of Mathematics and Music, Contemporary Music Review. Taylor and Francis, 2009; 28(3): 329-345.
[5] Mariana Montiel, Francisco Gómez. Music in the pedagogy of mathematics. Journal of Mathematics and Music. Taylor and Francis. 2014; 8(2): 151-156.
[6] Roger T Dean, Freya Bailes, William TM Dunsmuir. Time series analysis of real-time music perception: approaches to the assessment of individual and expertise differences in perception of expressed affect. Journal of Mathematics and Music. Taylor and Francis. 2014; 8(3): 183-205.
[7] Anja Volk, Aline Honingh. Mathematical and computational approaches to music: challenges in an interdisciplinary enterprise. Journal of Mathematics and Music. Taylor and Francis. 2012; 6(2): 73-81.
[8] Rajeswari Sridhar, TV Geetha. Raga Identification of Carnatic music for Music Information Retrieval. International Journal of Recent Trends in Engineering. 2009; 1(1): 571-574.
[9] Takahashi Nicholson, R Nakatsu. Emotion Recognition in Speech Using Neural Networks. Neural Computing and Applications. Springer-Verlag London Limited. 2000; 9: 290-296.
[10] Jon McCormack. Grammar Based Music Composition, In Complex Systems. From local Interactions to Global Phenomena. R. Stocker et. al., eds, ISO Press, Amsterdam, 2009; 320-336.
[11] Parag Chordia. Automatic Transcription of Solo Tabla Music. Ph.D. diss. Stanford University, 2006.
[12] S Essid, G Richard, B David. Musical Instrument Recognition Based on Class Pair-wise Feature Selection. In Proceedings of International Conference on Music Information Retrieval, 2004.
[13] Debashis De, Samarjit Roy. Polymorphism in Indian Classical Music: A Pattern Recognition Approach. In Proceedings of International Conference on Communications, Devices and Intelligent Systems (CODIS). IEEE, 2012: 612-615.
[14] Debashis De, Samarjit Roy. Inheritance in Indian Classical Music: An Object-Oriented Analysis and Pattern Recognition Approach. In Proceedings of International Conference on Radar, Communication and Computing (ICRCC), IEEE, 2012: 193-198.
[15] Sayanti Chakraborty, Debashis De. Object Oriented Classification and Pattern Recognition of Indian Classical Ragas. In Proceedings of the 1st International Conference on Recent Advances in Information Technology (RAIT), IEEE, 2012.
[16] Sayanti Chakraborty, Debashis De. Pattern Classification of Indian Classical Ragas based on Object Oriented Concepts. International Journal of Advanced Computer engineering & Architecture, 2012; 2: 285-294.
[17] M Bhattacharyya, D De. An Approach to identify Thhat of Indian Classical Music. In Proceedings of International Conference on Communications, Devices and Intelligent Systems (CODIS), IEEE, 2012: 592-595.
[19] Edward J Coyle, I Shmulevich. A System for machine recognition of music patterns. In Proceedings of the Acoustic, Speech and Signal Processing, IEEE, 1998: 3597-3600.
[20] V Marian Iordache, Panos J Antsaklis. Supervisory Control of Concurrent Systems. Ch. 2, A Petri Net Structural Approach. Birkhauser Boston.
[21] Tado Murata. Petri Nets: Properties, Analysis and Applications. Proceedings of the IEEE, 1998; 77(4) 541-580. [22] Mitrović Dalibor, Matthias Zeppelzauer, Christian Breiteneder. Features for content-based audio
retrieval. Advances in Computers. 2010; 78: 71-150.
[23] Didiot Emmanuel, et al. A wavelet-based parameterization for speech/music discrimination. Computer Speech & Language, 2010; 24(2): 341-357.
[24] G Freeman, R Dony, S Areibi. Audio environment classification for hearing aids using artificial neural networks with windowed input. In Proceedings of IEEE Symposium on Computational Intelligence in Image and Signal Processing, 2007.
[25] Ntalampiras Stavros, Ilyas Potamitis, Nikos Fakotakis. Exploiting temporal feature integration for generalized sound recognition. EURASIP Journal on Advances in Signal Processing, 2009 1: 807162.
[26] Ntalampiras Stavros, Nikos Fakotakis. Speech/music discrimination based on discrete wavelet transform. Artificial Intelligence: Theories, Models and Applications. Springer, Berlin, Heidelberg. 2008: 205-211.
[27] M Khan, G Al-Khatib Wasfi, Muhammad Moinuddin. Automatic classification of speech and music using neural networks. Proceedings of the 2nd ACM international workshop on Multimedia databases, 2004.
[28] Hervé Platel et al. Semantic and episodic memory of music are subserved by distinct neural networks. Neuroimage, 2003; 20(1): 244-256.
[29] Paul Scott. Music classification using neural networks. Manuscript Class ee373a, Stanford, 2001.
[30] Eck Douglas, Juergen Schmidhuber. A first look at music composition using lstm recurrent neural networks. Istituto Dalle Molle Di Studi Sull Intelligenza Artificiale, 2002.
[31] Cowie Roddy, Ellen Douglas-Cowie, Cate Cox. Beyond emotion archetypes: Databases for emotion modelling using neural networks. Neural Networks, 2005; 18(4): 371-388.
[32] Peter M Todd, Gareth D Loy. Music and connectionism. Mit Press, 1991.
[33] Perfecto Herrera et al. Towards instrument segmentation for music content description: a critical review of instrument classification techniques. International symposium on music information retrieval, ISMIR, 290, 2000. [34] Eronen Antti, Klapuri Anssi. Musical instrument recognition using cepstral coefficients and temporal
features. Acoustics, Speech, and Signal Processing, 2000.
[35] John Platt. A resource-allocating network for function interpolation. Neural Computation. 1991; 3(2): 213-225. [36] Judith C Brown. Computer identification of musical instruments using pattern recognition with cepstral coefficients
as features. The Journal of the Acoustical Society of America. 1999; 105(3): 1933-1941.
[37] Ronald J Williams, Zipser David. A learning algorithm for continually running fully recurrent neural networks. Neural computation, 1989; 1(2): 270-280.
[38] Samarjit Roy, Sudipta Chakrabarty, Pradipta Bhakta, Debashis De. Modelling High Performing Music Computing using Petri Nets. In proceedings of the International Conference on Control, Instrumentation, Energy and Communication (CIEC). IEEE, 2014: 757-761.
[39] Samarjit Roy, Sudipta Chakrabarty, Debashis De. A Framework of Musical Pattern Recognition using Petri Nets. In: Emerging Trends in Computing and Communication (ETCC)-2014. Springer-Link Digital Library. 2014: 245-252.
[40] Samarjit Roy, Sudipta Chakrabarty, Debashis De. Pervasive Diary in Music Rhythm Education: A Context Aware Learning Tool using Genetic Algorithm. In: Advanced Computing, Networking and Informatics, Springer-Verlag, 2014: 669-677.
[41] Samarjit Roy, Sudipta Chakrabarty, Debashis De. Automatic Raga Recognition using fundamental Frequency Range of Extracted Musical notes. In: International Conference on Image and Signal Processing (ICISP), Elsevier, 2014, pp. 337-345.
[42] J Kippen, B Bel. Modelling music with grammars: formal language representation in the Bol Processor. In: A. Marsden and A. Pople (Eds.). Computer Representations and Models in Music.London: Academic Press,1992. [43] M Clayton. Time in Indian Music: Rhythm, Metre, and Form in North Indian Râg Performance. Oxford
Monographs on Music. Oxford: Oxford University Press, 2000.
[44] Simon Heykin. Neural Networks: A Comprehensive Foundation. Second Edition, Pearson Prentice Hall, Pearson Education. New Delhi, India, 2005.
[45] Omar Lopez-Ortega, Shani Ioana Lopez-Popa. Fractals, Fuzzy Logic and expert Systems to assist in the construction of musical pieces. Expert Systems with Applications. Elsevier, 2012; 39: 11911-11923.
[46] Ramamurthy Mani, SHamid Nawab. Integration Of DSP Algorithms And Musical Constraints For The Separation Of Partials In Polyphonic Music. IEEE, 1998: 1741-1744.
[47] Yading Song, Simon Dixon, Marcus Pearce. A Survey of Music Recommendation Systems and Future Perspectives. International Symposium on Computer Music Modelling and Retrieval. IEEE, 2012: 395-410.
[48] Cheng-Che Lu, Vincent S Tseng. A novel method for personalized music recommendation. Expert Systems with Applications, Elsevier, 2009; 36: 10035-10044.
[49] Datta, AK, Sengupta, R, Dey, N, Nag, D. (2002). Automatic Extractions of Swaras and shrutis from kheyal renditions. Journal of Acoust. Soc. India, 30.
[50] AK Datta, et.al. Multiple States in a Note in Hindustani Music and their Relevance to Consonance. J. Acoust. Soc. Ind. XXVI, 1998: 394.
[51] K Datta, et.al. Relevance of Consonance in Indian Musical Scale: Theory and Practice. J. Acoust. Soc. Ind., XXIII, 1995: 110.
[52] K Datta, et.al. Pitch Analysis of Recorded Vocal Performances in Hindustani Music: Evidence of a Personal Scale. J. Acoust. Soc. Ind., XXV, VI-1.1, 1997.
[53] K Datta, R Sengupta, N Dey, D Nag, A Mukherjee. A Methodology of Note Extraction from the song signals. In Proceedings of the Yugoslav Journal of Operations Research, 2010; 20(1): 157-177.
[54] Shmulevich, O Yli-Harja, EJ Coyle, D Povel, K Lemstrm. Perceptual Issues in Music Pattern Recognition Complexity of Rhythm and Key Finding. Computers and the Humanities, Kluwer Academic Publishers, 2001. [55] Shmulevich, D Povel. Rhythm Complexity Measures for Music Pattern Recognition. In Proceedings of IEEE
Workshop on Multimedia Signal Processing, 1998.
[56] Shmulevich, EJ Coyle. Establishing the Tonal Context for Musical Pattern Recognition. In Proceedings of the 1997 IEEE Workshop on Applications of Signal Processing to Audio and Acoustics, 1997.
[57] Marc Chemillier. Synchronization of musical words. Theoritical Computer Science. 310, 2004: 35-60.
[58] Roberto Bresin. Artificial neural networks based models for automatic performance of musical scores. Journal of New Music Research, Taylor and Francis, 1998; 27(3): 239-270.
[59] Michael C. Mozer. Neural Network Music Composition by Prediction: Exploring the Benefits of Psychoacoustic Constraints and Multi-scale Processing. Journal of Connection Science, Taylor and Francis, 1994; 6(2): 247-280. [60] P Sinha. Artificial Composition: An Experiment on Indian Music. Journal of New Music Research, Taylor and
Francis, 2008: vol. 37, vol. 3: 221-232.
BIOGRAPHIES OF AUTHORS
Samarjit Roy is an Assistant Professor in the Department of Computer Science and Engineering, Techno India Silli, Ranchi, Jharkhand. He has completed B.Tech in Information Technology from Govt. College of Engineering and Leather Technology, Kolkata, West Bengal and M.Tech in Information Technology from Sikkim Manipal Institute of Technology, Sikkim, Gangtok. His areas of specialization are Musical Pattern Recognition, Information Retrieval, Speech, Audio and Signal Processing, Soft Computing. He has published number of research papers, books, book chapters etc. in his areas in several International Publication Societies.
Sudipta Chakrabarty obtained his M.Tech degree in Information Technology from Bengal Engineering and Science University, presently known as IIEST. Presently he is working as an Assistant Professor in Techno India, Salt Lake in the Department of Master of Computer Application affiliated by West Bengal University of Technology. His research interest is on the field of Pattern Recognition using Soft Computing Optimizing techniques. He has more than four book publications and some research papers in his credit.
Debashis De obtained his M.Tech degree in Radio physics & Electronics, University of Calcutta (2002). He obtained his Ph.D. (Engineering) from Jadavpur University in 2005. He worked in the field of Nano Technology and Communication. He worked as R&D Engineer at Telektronics and Programmer, CTS. His research interest is on nano-structure semiconductor devices. He has more than 50 publications in International Journals, more than 10 books and more than 100 Conferences to his credit. His current research interest is in nanotechnology, QCA and Mobile Computing.He received young Scientist Award by URSI (Belgium) and Received the award from president of India Dr. A.P.J. Kalam at rashtrapati Bhavan, India on 2005. Was awarded the prestigious Boyscast Fellowship 2008 by department of Science and Technology, Govt. of India to work in the nanofabrication Group of Kevin Prior at Heriot-Watt University, Scotland, UK. He is also awarded Endeavour Fellowship Award during 2008 - 2009 by DEST Australia to work in the University of Western Australia, Perth, Australia.