Sharif University of Technology
Scientia IranicaTransactions A: Civil Engineering www.scientiairanica.com
Application of trend analysis and articial neural
networks methods: The case of Sakarya River
G. Ceribasi
a;, E. Dogan
b, U. Akkaya
cand U.E. Kocamaz
da. Sakarya University, Technology Faculty, Department of Civil Engineering, Sakarya, Turkey. b. Sakarya University, Faculty of Engineering, Department of Civil Engineering, Sakarya, Turkey. c. Sakarya University, Science Institute, Department of Civil Engineering, Bolu, Turkey.
d. Uludag University, Vocational School of Karacabey, Department of Computer Technology, Bursa, Turkey. Received 7 November 2015; received in revised form 1 February 2016; accepted 5 September 2016
KEYWORDS Trend analysis; Articial neural networks; Sakarya river; Rainfall; Stream ow; Suspended load.
Abstract.Various articial intelligence techniques are used in order to make prospective estimations with available data. The most common and applied method among these articial intelligence techniques is Articial Neural Networks (ANN). On the other hand, another method which is used in order to make prospective estimations with available data is Trend Analysis. When the relation of these two methods is analyzed, Articial Neural Networks method can present the prospective estimation numerically, while there is no such a case in Trend Analysis. Trend Analysis method presents result of prospective estimation as a decrease or increase in data. Therefore, it is quite important to make a comparison between these methods which brings about prospective estimation with the available data, because these two methods are used in most of these studies. In this study, annual average stream ow and suspended load measured in Sakarya River along with average annual rainfall trend were analyzed with trend analysis method. Daily, weekly, and monthly average stream ows and suspended loads measured in Sakarya River and average daily, weekly, and monthly rainfall data of Sakarya were all analyzed by ANN Model. Results of trend analysis method and ANN model were compared.
© 2017 Sharif University of Technology. All rights reserved.
1. Introduction
Due to recent climate changes, hydraulic structures are being built in order to eectively use water resources, which are in danger of being consumed totally. Some important parameters are estimated properly in order to complete economic life of hydraulic structures in the planned time schedule. The most important parameter is the amount of solid material carried by the river throughout the planned life of the structure [1].
There-*. Corresponding author. Tel.: +902642956510; Fax: +902642956424
E-mail addresses: [email protected] (G. Ceribasi); [email protected] (E. Dogan); [email protected] (U. Akkaya); [email protected] (U. Erkin Kocamaz)
fore, this study aims to make a prospective estimation of suspended load transported by the river.
In recent years, Articial Neural Networks (ANN) have been used in various disciplines eectively and commonly since they can form an easy, fast and more accurate model with low error margin on the basis of nonlinear relations among parameters which inuence cases [1].
On the other hand, since hydrological sizes (rainfall, stream ow, suspended load, etc.) have a randomly changing characteristic in time, special methods are required to analyze a continuous decrease or increase trend [2-6]. Basic assumptions, such as normality, linearity, and independence, about classical parametric tests are not practicalized yet in typical sur-face water quality. Therefore, it is suitable to use
non-years. Therefore, it is one of the most important issues to analyze whether these two methods contradict or correspond to each other. Therefore, this study aims to apply Trend Analysis Method and Articial Neural Networks Method to rainfall, stream ow, and suspended load of Sakarya river and Sakarya city. 2. Materials and methods
In order to apply Articial Neural Networks Method, this paper considered daily, weekly, and monthly av-erage stream ows and suspended loads of Stream Flow Observation Station no. 1257 of Sakarya River as well as daily, weekly, and monthly average rainfall of State Meteorological Station no. 17069 of Sakarya city [7,8]. In order to apply trend analysis method, annual average stream ow and suspended load of Stream Flow Observation Station no. 1257 of Sakarya city and annual average rainfall of State Meteorological station no. 17069 of Sakarya city were used.
2.1. Articial neural networks method
MATLAB program was used while implementing Ar-ticial Neural Networks Method. ANN method was applied as three years of training, one year of valida-tion, and one year of testing. Data of daily stream ow, suspended load and rainfall of 33 years in total (1979-2011) were used which constituted 65% training, 18% validation, and 17% test, respectively.
One of the issues deserving attention in ANN studies is the determination of number and charac-teristics of input. Determination of suitable input can be eective in problem-solving [9-13]. In this study, various tests were made in order to determine correct input parameters. As a result of these tests, ANN model composed of 4 inputs and 1 output was determined.
In ANN model: Day no, Water year, Rainfall (mm), and Stream ow (m3/s), were used as inputs,
and the suspended load values (ton/day) were used as output.
2.2. Trend analysis method 2.2.1. Spearman's Rho test
This is a quick and simple test to determine if there is a correlation between two observation series. Rxi,
i.e. rank statistic, was determined by ordering data in
Z = rs n 1: (2)
It is concluded that if normal distribution correspond-ing to signicance level, which is chosen as absolute value of Z, is smaller than Z=2, then null hypothesis is
accepted. In addition, there is no trend in time series observed if it is bigger. Consequently, there is a trend, and if Z value is positive, then there is an increase trend; if it is negative, then there is a decrease trend. 2.2.2. Mann-Kendall test
Since the Mann-Kendall test is a non-parametric test, it is independent from random variable distribution. With this test, the presence of a trend in a time series is checked with null hypothesis \H0: no trend" [15-20].
In x1; x2; :::; xn time series to which the test will be
applied, xi, xj pairs are divided into two groups. For
i < j, if P represents the number of pairs xi< xj and
number of pairs xi> xj, test statistics (S) is calculated
by the following relation:
S = P M: (3)
Kendall correlation coecient is calculated as follows:
= S
[n(n 1)=2]: (4)
For n 10: s=
p
n(n 1)(2n + 5)=18; (5) Z =
8 > < > :
(S 1)=s S > 0
0 S = 0
(S + 1)=s S < 0
(6) It is concluded that if normal distribution corre-sponding to signicance level, chosen as the absolute value of Z, is smaller than Z=2, then null hypothesis
is accepted. Moreover, there is no trend in time series observed if it is bigger; there is a trend and if Z value is positive, then there is an increase trend; if it is negative, then there is a decrease trend [4-6,21-24].
2.2.3. Mann-Kendall rank correlation test
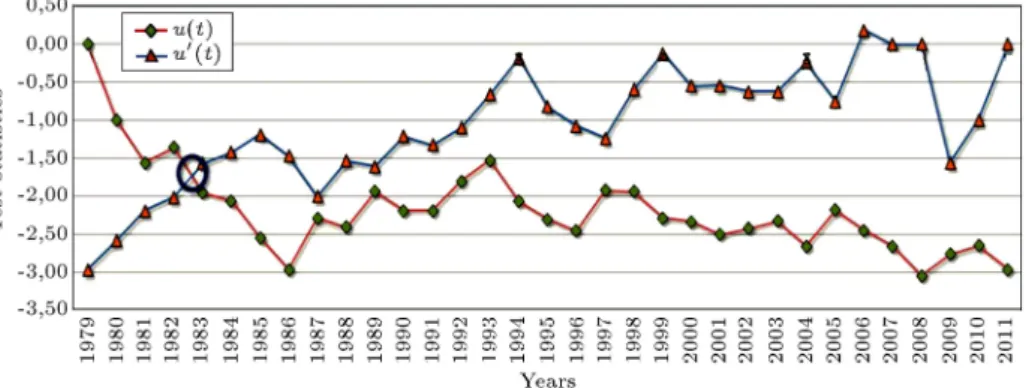
This nonparametric test is used to determine whether an increase or decrease trend is present in the applied series in time. The test graphically expresses the results and also determines starting point of the trend [3-5]. In
Figure 1. u(t) u0(t) graph of the annual ow of Sakarya River.
the hydro-meteorology time series, starting from the left-hand side, the data xi are considered to be the
larger ones in the data that comes before itself instead of the data. If this number is called ni, then xi data
values are replaced with them and a whole number sample function is obtained. If ti represents sequential
sums of these whole numbers, t, which is required by the magnitude to test the method, becomes:
t =
n
X
i=1
ni: (7)
Mean E(t) follows:
E(t) = n(n 1)4 ; (8)
variance follows:
var(t) = n(n 1)(2n + 5)72 : (9) and u(t) function follows:
u(t) = [t E(t)]p
var(t) : (10)
Considering the assumption that there is no change over time expressed by the near-zero values of u(t), the bigger values of u(t), surprisingly, show that a change occurs. On the other hand, graphical intersection point of u(t) and u0(t) shows the starting time of the trend.
3. Results and discussion
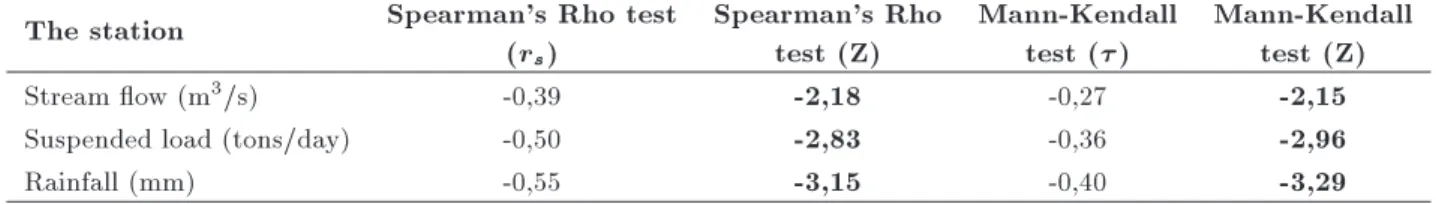
3.1. Results of the trend analysis method Results of Spearman's Rho and Mann-Kendall tests of the stream ow, suspended load, and rainfall data of Sakarya River and Sakarya are given in Table 1.
When Trend Analysis results were analyzed, it was seen that there is a decrease trend in stream ow, suspended load, and rainfall for both tests (Spearman's Rho and Mann-Kendall tests).
Graphic results of Mann-Kendall Rank Correla-tion test of the stream ow and suspended load data of Sakarya River and rainfall data of Sakarya are given in Figures 1, 2 and 3.
According to Mann-Kendall rank correlation test, the starting years of a decrease trends are the year 1983 for stream ow, 1983 for suspended load, and 1985 for rainfall. Therefore, these results were obtained when accuracy of the results of trend analysis was analyzed. 3.2. Results of articial neural networks
method
ANN model was applied as three years of training, one year of validation, and one year of testing. 65% of the whole 33 years of data was for training, 18% for validation, and 17% for testing. Daily testing performance, weekly testing performance, and monthly testing performance are given in In Figures 4, 5 and 6, respectively.
When graphics of Figures 4-6 are analyzed, the best test performance is the graph of test performance of suspended load predicted by ANN with the aid of average daily data. But, in order to be certain of this, the decision can be made after analyzing validation performances. On the other hand, results of daily, weekly, and monthly test scatter of real values and predicted values are given in Figure 7.
R2is close to the value of 1 as given in Figure 7,
and so, we can discuss such a successful ANN. More-over, if an ANN model is trained with much data,
Table 1. Results of Spearman's Rho and Mann-Kendall tests of the stream ow, suspended load, and rainfall data. The station Spearman's Rho test
(rs)
Spearman's Rho test (Z)
Mann-Kendall test ( )
Mann-Kendall test (Z)
Stream ow (m3/s) -0,39 -2,18 -0,27 -2,15
Suspended load (tons/day) -0,50 -2,83 -0,36 -2,96
Figure 2. u(t) u0(t) graph of the annual suspended load of Sakarya River.
Figure 3. u(t) u0(t) graph of the annual rainfall of Sakarya.
Figure 4. Test performances of predicting suspended load levels with ANNs using average daily data.
Figure 5. Test performances of predicting suspended load levels with ANNs using average weekly data.
Figure 6. Test performances of predicting suspended load levels with ANNs using average monthly data.
a much more successful ANN model will be formed. Therefore, when the graphics in Figure 7 are observed, the value of daily test determination coecient is the closest to that of R2. The reason is that while 365
data are used in daily data, 52 data are used in weekly data and 12 data in annual data. Again, validation performance should be considered in order to make a decision on daily data.
Real average stream ow and real average rainfall values were used while calculating validation perfor-mances. When Figures 8 to 10 are analyzed, it is seen that the best test performance is the graphs of validation performance of suspended load predicted by ANN with the aid of average daily data. On the other hand, results of daily, weekly, and monthly test scatter of real and predicted values are given in Figure 11.
When the graphics in Figure 11 are analyzed, daily validation determination coecient value is the closest to R2 value.
Afterwards, graphics of validation performances of suspended load with ANN are analyzed by using average monthly values in Figures 8 to 10. Graph-ics of average daily, weekly, and monthly validation correlations of real and predicted values are presented in Figure 11. It is seen that the best validation performance is the validation performance of average daily data. Therefore, the best test performance is the performance of average daily data.
(be-Figure 7. Comparison between observed and daily (a), weekly (b), monthly (c) simulated sediment level with ANNs for test data.
Figure 8. Validation performances of predicting
suspended load levels with ANNs using average daily data.
Figure 9. Validation performances of predicting suspended load levels with ANNs using average weekly data.
Figure 10. Validation performances of predicting suspended load levels with ANNs using average monthly data.
tween 2012-2023) suspended load prediction of ANN method was done, trained with average daily rainfall, stream ow, and suspended load data (Figure 12).
Sakarya River suspended load, which was pre-dicted by ANN model, has a decrease trend compared to every passing year.
Figure 12. Forecasting suspended load levels with ANNs using daily data.
4. Conclusion
The factors causing decrease for hydraulic parameters were analyzed. When the year 1972 is considered which is the time Gokcekaya Dam on Sakarya River began storing water with storage volume of 910 106 m3,
it is seen that the starting point of trends starts after this time. Therefore, since Gokcekaya Dam arranged stream ows respectively and kept suspended load in dead storage, it caused decrease both in stream ow and suspended load. Moreover, when starting and completion dates of Saryar Dam building in the region are considered and when the year 1956, which is the completion date of Saryar Dam building, is regarded as the year it began to store water, Sariyar Dam can be seen as a factor in the decrease of stream ow and suspended load [4,25-28].
With respect to climate, considering that water resources can be aected by global warming, it is estimated that water resources in specic regions of the world will run out and be insucient in 50 years. As a result of this inuence, it is estimated that the amount of water per people would be nearly 40% in
Figure 11. Comparison between observed and daily (a), weekly (b), monthly (c) simulated sediment level with ANNs for validation data.
of test analysis result, it was again observed that daily validation test results present the best results. Therefore, Articial Neural Networks, trained in this way, would give more accurate results for the future predictions to be carried out for Sakarya River sus-pended load. As a result of ANN method applied in this way, it is observed in Figure 12 as well that the suspended load predicted between 2012-2023 continues by decreasing every year. In other words, based on Articial Neural Network method, it is observed that there is a decrease trend in suspended load transported by Sakarya River.
Therefore, it is observed that trend analysis and articial neural network methods applied to the sus-pended load data of Sakarya River correspond, which means that the results of both methods are similar in the comparison.
References
1. Kayaalp, N. \Determination of monthly
suspended-sediment load transported in dicle river with articial neural networks", XVII. Technical Congress and Ex-hibition of Turkey Construction Engineering, Istanbul, Turkey (2004).
2. Helsel, D.R. and Hirsch, R.M. \Statistical methods in
water resources. Techniques of water-resources investi-gations of the united states geological survey", Book 4, Hydrologic Analysis and Interpretation, Chapter A3, Amsterdam (1992).
3. Gumus, V., Evaluation of Firat River Basin
Stream-ow by Trend Analysis, Institute of Science, Depart-ment of Civil Engineering, Harran University, Sanli-urfa, Turkey (2006).
4. Ceribasi, G., Estimation of Sediment Discharge
Trans-ported in Sakarya River by Using Trend Analysis Method, Institute of Science, Department of Construc-tion, Sakarya University, Sakarya, Turkey (2010).
5. Ceribasi, G., Dogan, E. and Sonmez, O. \Evaluation of
Sakarya river streamow and sediment transport with rainfall using trend analysis", Journal of Fresenius Environmental Bulletin, 3A, pp. 846-852 (2013).
6. Ceribasi, G., Dogan, E. and Sonmez, O. \Evaluation of
meteorological and hydrological data of Sapanca basin by trend analysis method", Journal of Environmental Protection and Ecology, 2, pp. 705-714 (2014).
University, Denizli, Turkey (2007).
10. Partal, T. Estimation of Turkish Precipitation Data
Using Articial Neural Networks and Wavelet Trans-formation Methods, Institute of Science, Department of Civil Engineering, Istanbul Technical University, Istanbul, Turkey (2007).
11. Sahin, M., Rainfall-Runo Model Using an Articial
Neural Network Approach for Black Sea Catchments, Institute of Science, Department of Civil Engineering, Istanbul Technical University, Istanbul, Turkey (2007).
12. Oguz, V., Monitoring Suspended Sediment Transport
of Korubasi-Arak Stream by Analytical Methods, Insti-tute of Science, Department of Soil Science, Graduate School of Natural and Applied Sciences, Ankara Uni-versity, Ankara, Turkey (2010).
13. Yildirim, E., Classication of Soil Properties Using
Absorptive Characteristics of Seismic Waves, Institute of Science, Department of Civil Engineering, Sakarya University, Sakarya, Turkey (2013).
14. Buyukkaracigan, N. and Kahya, E. \The dependency
analysis of annual peak ows of streams in Konya Basin", In: Proc. of the International Conference on Water Problems in the Mediterranean Countries, Ankara, Turkey (1997).
15. Mann, H.B. \Non-parametric tests against trend", The Econometric Society, 3, pp. 245-259 (1945).
16. Kendall, M.G., Rank Correlation Methods, 4th Ed.
Charles Grin, London (1975).
17. Van Belle, G. and Hughes, J.P. \Nonparametric tests
for trend in water quality", Water Resources Research, 1, pp. 127-136 (1984).
18. Partal, T. and Kucuk, M. \Long-term trend analysis
using discrete wavelet components of annual precip-itations measurements in Marmara region (Turkey)", Physics and Chemistry of the Earth, 18, pp. 1189-1200 (2006).
19. Gumus, V. and Yenigun, K. \Evaluation of lower Frat
basin streamow by trend analysis", 7th International Advances in Civil Eng. Conf., YTU, Istanbul, Turkey (2006).
20. Kalayci, S. and Kahya, E. \Assessment of streamow
variability modes in Turkey 1964-1994", Journal of Hydrology, 1-4, pp. 163-177 (2006).
21. Yu, S., Zou, S. and Whittemore, D. \Non-parametric
trend analysis of water quality data of rivers in Kansas", Journal of Hydrology, 1, pp. 61-80 (1993).
22. Cengiz, T., Kahya, E. and Karaca, M. \Trends and annual cycles in Turkish lake levels", In: Proc. of the International Association of Hydraulic Engineering and Research Congress, Thessaloniki, Greece (2003).
23. Aris, P., Sophia, M. and Antonios, P. \Simulation
and trend analysis of the water quality monitoring daily data in Nestos river delta", Contribution to the Sustainable Management and Results for the Years 2000-2002, Environ Monit Assess, 3, pp. 543-562 (2006).
24. Hong, W., Leen-Kiat, S., Ashok, S. and Xun-Hong,
C. \Trend analysis of streamow drought events in Nebraska", Water Resources Management, 2, pp. 145-164 (2008).
25. Atalay, I., Applied Hydrography-I, Ege University,
Faculty of Arts, Izmir, Turkey (1986).
26. Bakir, H. Determination of Erzurum Ilica Sinirbasi
Stream Basin Rainfall and Stream Flow Characteris-tics, Ataturk University, Erzurum, Turkey (2003).
27. Atalay, A. and Ikiel, C. \Trend analysis of monthly
and annual ow values of Sakarya river", International Symposium on Geography, Environment and Culture in the Mediterranean Region, Balikesir, Turkey (2007).
28. Ikiel, C. and Kacmaz, M., Global Evolution; Involving
Change of Climate. Natural Resources and Human Politics, Italy (2007).
Biographies
Gokmen Ceribasi is an Assistant Professor in the De-partment of Technology Faculty at Sakarya University. He graduated with PhD from the University of Sakarya in 2014. He has published many works in dierent elds of civil engineering.
Emrah Dogan is an Associate Professor in the De-partment of Civil Engineering in Sakarya University. He received a BS degree in Civil Engineering in 2001. He graduated with PhD from the University of Sakarya in 2008. He has published many works in dierent elds of civil engineering.
Ugur Akkaya is a Lecturer in the Department of Architecture and urban planning in Abant Izzet Baysal University. He is a PhD student in Sakarya University. His areas of expertise are ood risk management, hydraulic, uid mechanics, hydrology and meteorol-ogy.
Ugur Erkin Kocamaz is a Lecturer in the Depart-ment of Computer Programming at Uludag University. He is a PhD student at Sakarya University. His areas of expertise are articial neural networks and computer and information systems.