Impact of human activities on benthic biotopes and species
Report to Department for Environment, Food and Rural Affairs Contract no. CDEP 84/5/244
Dr Harvey Tyler-Walters &
Dr Keith Hiscock
Contractor: Marine Life Information Network for Britain and Ireland, Marine Biological Association of the UK, Citadel Hill, Plymouth, PL1 2PB.
FINAL REPORT June 2005
(Contract period November 2001 to October 2004)
Reference:
Tyler-Walters, H. & Hiscock, K., 2005. Impact of human activities on benthic biotopes and species. Report to Department for Environment, Food and Rural Affairs from the Marine Life Information Network (MarLIN). Plymouth: Marine Biological Association of the UK. [Contract no. CDEP 84/5/244]
1. Introduction to the report ...11
2. Background to the project...11
3. Contract objectives ...11
4. Tasks and Milestones...13
4.1 Introduction ...13
4.2 Task 1. Maintain the MarLIN database and Web site...13
4.3 Task 2. Contribute to the application of sensitivity information to marine environmental protection especially by promoting approaches developed in the UK in Europe. ...13
4.4 Task 3. Undertake further research on species and habitats that are keystone, characterizing or indicator species including species and habitats found in UK waters that are selected under the OSPAR prioritization process. ...17
4.5 Task 4. Develop links between sensitivity and survey data ...17
4.6 Task 5. Identify locations of nationally important benthic species and habitats, at particular risk from pollution from accidental oil spills, to contribute to 3-yearly reviews of MEHRA’s environmental sensitivity data. ...20
4.7 Task 6. Report on programme ...20
5. Maintain the MarLIN database and Web site. ...20
5.1 Introduction ...20
5.2 The redesigned MarLIN Web site ...21
5.2.1 Introduction ...21
5.2.2 Pull-down menus ...21
5.2.3 Search tools ...22
5.3 The Biology and Sensitivity Key Information Database...23
5.4 The SEArchable BEnthic Data (SEABED) Map...23
5.4.1 Introduction ...23
5.4.2 The Data Access Sub-programme ...23
5.4.3 Mapping software ...24
5.4.4 The SEABED Map ...24
5.5 Use of the MarLIN Web site...26
6. Undertake further research on species and habitats that are keystone, characterizing or indicator species ...29
6.1 Introduction ...29
6.2 The Biology and Sensitivity Key Information database ...29
6.4 Update of database and Key Information reviews ... 30
6.5 Biology and Sensitivity Key Information research ... 32
6.5.1 Priority species ... 32
6.5.2 Key information research completed... 33
6.5.3 OSPAR Annex V threatened and declining species ... 35
6.5.4 OSPAR Annex V threatened and declining habitats... 47
6.5.5 Indicator species... 47
7. Linking sensitivity information and marine benthic survey data ... 49
7.1 Introduction ... 49
7.2 Sensitivity Mapping Advisory Group... 50
7.3 A combined ‘sensitivity’ scale ... 50
7.3.1 Introduction... 50
7.3.2 Rationale and approach ... 51
7.4 Updating existing scales and definitions ... 53
7.5 Review of sensitivity, intolerance and recoverability across species and biotopes . ... 54
7.6 Assessing sensitivities at the biotope complex, lifeform, and habitat complex levels ... 60
7.7 Sensitivity mapping in marine environmental management... 61
7.7.1 Introduction... 61
7.7.2 Irish Sea Pilot trial sensitivity maps... 61
7.7.3 CCW trial of sensitivity maps in oil spill response... 68
7.7.4 CEFAS contract to identify offshore biotope complexes and their sensitivities. ... 73
7.8 Benefits and limitations of sensitivity mapping in environmental management ... 76
8. Conclusions ... 79
9. Recommendations ... 83
10. References ... 85
Figure 2. SEABED Map. Example search for survey data for Mytilus edulis, Modiolus
modiolus and Atrina fragilis...25
Figure 3. SEABED Map. Comparative distribution of Sabellaria alveolata and Sabellaria spinulosa (left), with close-up of the north Irish Sea (right). ...25
Figure 4. SEABED Map. Species list for an individual survey point. ...26
Figure 5. SEABED Map. Histogram of relative species abundance within survey sample. ...27
Figure 6. The top twenty countries of origin of our users (excluding the USA)...28
Figure 7. The range of different organization types using the Web site...28
Figure 8. Range of species information on the MarLIN Web site (October 2004). ...34
Figure 9. Number of research biotopes representative of the interest features of the EC Habitats Directive Annex I habitats (October 2004). ...34
Figure 10. Number of researched biotopes that represent UK BAP habitats (October 2004). ...35
Figure 11. Sensitivity of Marine Landscapes to substratum loss as assessed by MarLIN for the Irish Sea Pilot...63
Figure 12. Sensitivity of Marine Landscapes to smothering as assessed by MarLIN for the Irish Sea Pilot...64
Figure 13. Sensitivity of Marine Landscapes to physical disturbance and abrasion as assessed by MarLIN for the Irish Sea Pilot. ...65
Figure 14. Sensitivity of species to physical disturbance and abrasion within Marine Landscapes in the vicinity of Bardsey Island, as assessed by MarLIN for the Irish Sea Pilot. ...66
Figure 15. Sensitivity of biotopes to physical disturbance and abrasion within Marine Landscapes in the vicinity of Bardsey Island, as assessed by MarLIN for the Irish Sea Pilot. ...67
Figure 16. Example sensitivity map of West Angle Bay, Pembrokeshire to hydrocarbon contamination...70
Figure 17. Example map of sensitivity to hydrocarbon contamination for sedimentary biotopes from Caldicot to Newport, Severn Estuary...71
Figure 18. Similarity between biotope complex and biotopesensitivity of Phase I biotopes in West Angle Bay, Pembrokeshire to physical disturbance and abrasion, a)Phase I biotopes b)Phase I biotope complexes. Data courtesy of CCW (see Tyler-Walters & Lear, 2004)...75
Table 2. European fora, meetings and workshops attended to promote the use of
sensitivity information in marine environmental management, and obtain feedback.. 15
Table 3. Biology and Sensitivity Key Information species research tranches completed (*=surrogates)... 17
Table 4. Web statistics since the re-launch of the Web site (November 2003 to mid September 2004)... 27
Table 5. Revision of physical disturbance and abrasion benchmark March 2003... 30
Table 6. Revision of the changes in nutrient levels benchmark March 2003... 31
Table 7. Species research priorities ... 32
Table 8. Species information reviews researched or updated in the contract period. ... 36
Table 9. OSPAR Annex V threatened and declining species on the MarLIN Web site .... 47
Table 10. OSPAR Annex V threatened and declining habitats on the MarLIN Web site.. 48
Table 11. Potential indicator species information on MarLIN.... 48
Table 12. Sensitivity Mapping Advisory Group members ... 50
Table 13. Defining ‘sensitivity’ sensu lato for habitats and species. ... 52
Table 14. Combining 'intolerance' and 'recoverability' assessments to determine 'sensitivity'... 53
Table 16. ‘Very high’ and ‘high’ sensitivity (combined scale) biotopes within the Biology and Sensitivity Key Information database (VH= Very high; H= H), in order of sensitivity. ... 58
List of Appendices Appendix 1. Biology and Sensitivity Key Information reviews completed, in priority order. ... 91
Appendix 2. Basic information pages completed, in priority order. ... 97
Appendix 3. MarLIN hosted datasets (October 2004)... 111
Appendix 4. Sensitivity assessment rationale - a summary ... 119
Appendix 5. Relative sensitivity (combined scale) of species within the Biology and Sensitivity Key Information database. ... 133
Appendix 6. Relative sensitivity (combined scale) of biotopes within the Biology and Sensitivity Key Information database.. ... 141
Appendix 7. Sublittoral sediment biotope complexes (2004) versus 1997 codes and intolerance, recoverability and sensitivity to physical disturbance... 153
Appendix 8. Notes for interpretation of sensitivity assessments and the benchmarks used. ... 161
human activities on benthic biotopes and species’ carried out by the Marine Life
Information Network for Britain and Ireland (MarLIN) on behalf of the Department of the Environment, Food and Rural Affairs (Defra). The contract contributed the majority of the funding for the Biology and Sensitivity Key Information Sub-programme of MarLIN.
The MarLIN programme provides quality controlled, scientifically based information to a wide and multi-disciplinary audience via the Internet. This information is provided in a form that can support scientifically sound decision-making for marine environmental
management and protection. It is not possible to do justice to the volume of work
undertaken in this project, its resultant functionality or applicability in a written report of this kind. The reader should refer to the MarLIN Web site (www.marlin.ac.uk) to appreciate the results of the contract.
This report addresses each phase of the contract development and each contract
deliverable in turn. The report demonstrates how the different phases of the programme integrate to produce the resultant product.
The Biology and Sensitivity Key Information Sub-programme and the MarLIN Web site have involved input of time and effort from all members of the MarLIN team. The members of the MarLIN team responsible for the results of this contract were:
Dr Keith Hiscock (Programme Director); Guy Baker (Communications & Liaison Officer); Dan Lear (Data Systems Developer); Dr Harvey Tyler-Walters (Senior Data Researcher); Will Rayment, Georgina Budd, and Charlotte Marshall (Data Researchers); and Jon Parr (Network Coordinator).
The MarLIN team would like to thank our other data research staff and volunteers whose efforts and input have considerably benefited the programme: Kate Reeds, Olwen Ager, Marie Skewes, Susie Ballerstedt, Lisa Curtis, Penny Avant, Joelene Hughes, Catherine MacDougall, Frances Peckett, Hugh Jones, Edward Mayhew, Jenny Smirthwaite, Anna Neish, Elizabeth Barton, Rose Edwards, Michelle Carter, Jack Sewell, Marisa Sabatini, Ken Neal, Sonia Rowley, Judith Oakley, and Jessica Heard. We would also like to thank Dan McGreal for the development of the SEArchable Benthic Data (SEABED) Map and search tools, undertaken as a MarLIN student bursary.
The Biology and Sensitivity Key Information Sub-programme has been improved by constructive criticism and additional information from outside experts who have kindly refereed many of our Key Information reviews. MarLIN is grateful for the input from all our referees, who are acknowledged on the relevant Key Information review Web pages. In addition, the Key Information reviews and the MarLIN Web site as a whole have been greatly enhanced by the use of photographic images, which bring both marine species and biotopes ‘alive’ for the user. The MarLIN team would like to thank all our image providers for the permission to use their images on our Web site.
The MarLIN team is indebted to the members of the Biology and Sensitivity Key
Information Sub-programme Technical Management and the Sensitivity Mapping Advisory Groups for their contribution to the development of the sensitivity scales and criteria and the Sub-programme as a whole. Further development of the Biology and Sensitivity Key Information Sub-programme also benefited from additional contract funding from the Countryside Council for Wales (CCW), the Irish Sea Pilot, and the Centre for Environment, Fisheries and Aquaculture Science (CEFAS). We are also grateful to the members of the MarLIN Steering Group and our wide-range of funders for their continued support and encouragement, without which the MarLIN programme would not be possible.
Report to Department for Environment, Food and Rural Affairs Executive Summary
1. The Marine Life Information Network (MarLIN) has been developed since 1998. Defra funding has supported a core part of its work, the Biology and Sensitivity Key
Information Sub-programme. This report relates to Biology and Sensitivity work for the period 2001-2004.
2. MarLIN Biology and Sensitivity research takes information on the biology of species to identify the likely effects of changing environmental conditions linked to human
activities on those species. In turn, species that are key functional, key structural, dominant, or characteristic in a biotope (the habitat and its associated species) are used to identify biotope sensitivity. Results are displayed over the World Wide Web and can be accessed via a range of search tools that make the information of relevance to environmental management.
3. The first Defra contract enabled the development of criteria and methods of research, database storage methods and the research of a wide range of species. A contract from English Nature and Scottish Natural Heritage enabled biotopes relevant to marine SACs to be researched.
4. Defra funding in 2001-2004 has especially enabled recent developments to be targeted for research. Those developments included the identification of threatened and
declining species by the OSPAR Biodiversity Committee, the development of a new approach to defining sensitivity (part of the Review of Marine Nature Conservation), and the opportunity to use Geographical Information Systems (GIS) more effectively to link survey data to MarLIN assessments of sensitivity.
5. The MarLIN database has been developed to provide a resource to ‘pick-and-mix’ information depending on the questions being asked. Using GIS, survey data that provides locations for species and biotopes has been linked to information researched by MarLIN to map the likely sensitivity of an area to a specified factor. Projects
undertaken for the Irish Sea pilot (marine landscapes), in collaboration with CEFAS (fishing impacts) and with the Countryside Council for Wales (oil spill response) have demonstrated the application of MarLIN information linked to survey data in answering, through maps, questions about likely impacts of human activities on seabed
ecosystems.
6. GIS applications that use MarLIN sensitivity information give meaningful results when linked to localized and detailed survey information (lists of species and biotopes as point source or mapped extents). However, broad landscape units require further interpretation.
7. A new mapping tool (SEABED map) has been developed to display data on species distributions and survey data according to search terms that might be used by an environmental manager.
8. MarLIN outputs are best viewed on the Web site where the most up-to-date information from live databases is available. The MarLIN Web site receives about 1600 visits a day.
9. The MarLIN approach to assessing sensitivity and its application to environmental management were presented in papers at three international conferences during the current contract and a ‘touchstone’ paper is to be published in the peer-reviewed
10. MarLIN information is being used to inform the identification of potential indicator species for implementation of the Water Framework Directive including initiatives by ICES.
11. Non-Defra funding streams are supporting the updating of reviews and increasing the amount of peer review undertaken; both of which are important to the maintenance of the resource. However, whilst MarLIN information is sufficiently wide ranging to be used in an ‘operational’ way for marine environmental protection and management, new initiatives and the new biotopes classification have introduced additional species and biotopes that will need to be researched in the future.
12. By the end of the contract, the Biology and Sensitivity Key Information database
contained full Key Information reviews on 152 priority species and 117 priority biotopes, together with basic information on 412 species; a total of 564 marine benthic species.
1. Introduction to the report
The report that follows outlines the tasks and deliverables achieved under a Defra contract between November 2001 and October 2004. The report updates and continues the report of our prior contract (Tyler-Walters et al., 2001) and draws on work already published under other contracts but that fulfilled the objectives of the Defra contract, i.e. Tyler-Walters et al. (2002, 2003, 2004), Tyler-Walters & Hiscock (2003) and Tyler-Walters & Lear (2004).
A description of the tasks and milestones of the project and the degree to which they were met is shown below in Sections 3 and 4. The major areas of work under the contract are discussed in detail in Sections 5, 6 and 7 below.
2. Background to the project
The United Kingdom (UK) Department for Environment, Food and Rural Affairs (Defra) supported a programme of research into the sensitivity of seabed species and biotopes and the dissemination of that information on the Internet, between 1998 and 2001, in support of UK commitments to protect species and habitats in the marine environment, particularly those commitments under the Oslo and Paris Commission (OSPAR)
Convention. The three year programme of work by the Marine Life Information Network (MarLIN) resulted in a Web site (www.marlin.ac.uk), which provides information on the biology and sensitivity of species and habitats, prioritized because they are keystone, characteristic, important for the implementation of conventions and directives or are nationally rare or scarce.
The MarLIN Web site and its supporting database require maintenance and development, especially to improve links with survey data. Additional keystone and characteristic species need to be researched to contribute to the identification of species and biotope sensitivity and to improve links with survey data, which can be facilitated by the
development of interactive mapping and GIS tools, improving functionality and ease of access. The development of Ecological Quality Objectives for the North Sea (De Boer et al., 2001) and the preparation of a Priority List of threatened or declining species and habitats under the auspices of the OSPAR Biodiversity Committee have or will generate more species requiring research.
The 2001 to 2004 contract aimed to maintain and extend the MarLIN database and Web site so that it can support UK commitments under the OSPAR Convention and contribute to reviews of environmental sensitivity data that could be used to establish Marine
Environmental High Risk Areas. The contract also required support of any future commitments that may arise related to UK implementation of the Habitats Directive, the further development of the UK Biodiversity Action Plans, the North Sea Conference and the Pilot scheme being undertaken as part of the Review of Marine Nature Conservation. The contractor also required the MarLIN teamto be aware of, and if necessary, respond to requirements under the Water Framework Directive.
3. Contract objectives
The MarLIN team completed all the objectives of the DEFRA contract between November 2001 and October 2004. Each objective and their achievements under those objectives follow.
current high standard.
The Biology and Sensitivity Key Information database, and hence the relevant section of the MarLIN Web site, was continuously maintained and updated throughout the contract period. The MarLIN approach to sensitivity assessment was revised to accommodate the Review of Marine Nature Conservation (RMNC) definition of ‘sensitivity’ (see Section 6). The database and hence the biology and sensitivity Web pages were subject to a
complete edit to remove typographical errors and improve consistency throughout the site, partly as a result of changes in our sensitivity assessment rationale. In addition, the entire Web site has been revised and redesigned to improve layout and navigation of the Web site and address comments received over the last several years.
Objective 2
To develop links between sensitivity and survey data, utilizing GIS technology to increase functionality and speed of access to data.
MarLIN made considerable progress in linking sensitivity information and marine benthic survey data. MarLIN developed in-house Geographical Information Systems (GIS) using both ArcGIS and MapInfo software to map marine benthic survey data and ‘tag’ that data with sensitivity information extracted from the Biology and Sensitivity Key Information database. In this way, it was possible to display maps of the sensitivity of researched species and biotopes. MarLIN has demonstrated its approach to sensitivity mapping for species and biotopes and broad scale mapping units. MarLIN mapped the sensitivity of species, biotopes and Marine Landscapes for the Irish Sea Pilot. MarLIN mapped the likely sensitivity of Phase I biotopes and species to environmental factors likely to be affected by oil spills for the Pembrokeshire SAC and Severn Estuary SAC under contract to CCW. An approach for using biotope sensitivity to assess biotope complex sensitivity was also developed and tested under contract to CEFAS. Details are given in Section 7. Objective 3
To undertake further research on species and habitats that are keystone, characterizing or indicator species including species and habitats found in UK waters that are selected under the OSPAR prioritization process.
Biology and Sensitivity Key Information research into priority species, especially those listed under OSPAR Annex V continued throughout the contract. A total of 45 additional full Key Information reviews were researched and placed on-line, and 480 basic
information pages researched or updated in the contract period. The species and habitat research is detailed in Section 6.
Objective 4
To apply the Faial/Texel criteria developed under OSPAR, as appropriate, to the preparation of species and habitat information reviews.
The OSPAR priority threatened or declining species are identified on the Web site, and the available information of these species can be retrieved via a separate search field.
Biotopes found within or that represent OSPAR threatened or declining habitats are similarly identified.
protection especially by promoting approaches developed in the UK to Europe.
At the beginning of the contract, MarLIN submitted an EU 6th framework bid to extend the MarLIN programme into Europe but it was unsuccessful. Nevertheless, MarLIN has taken all available opportunities to present our approach to sensitivity assessment to European fora. In particular, MarLIN presented a paper outlining our approach to the 38th European Marine Biology Symposium in Portugal entitled ‘Assessing the sensitivity of seabed species and biotopes – the Marine Life Information Network (MarLIN)’, which will be published in the journal Hydrobiologia shortly. Papers that refer to MarLIN Biology and Sensitivity Key Information were also presented at the 30th Pacem in Maribus, in 2003 and at the Littoral 2004 conferences. In addition, we are involved in the Marine Biodiversity and Ecosystem Functioning (MARBEF) and ‘European Lifestyles and Marine Ecosystems (ELME) European projects.
Objective 6
To identify locations of nationally important benthic species and habitats, at particular risk from pollution from accidental oil spills, to contribute to 3-yearly reviews of MEHRAs environmental sensitivity data.
MarLIN was unable to engage with the review of the MEHRA’s environmental sensitivity data. However, we negotiated a contract with the Countryside Council for Wales (CCW) to test sensitivity mapping in oil spill pollution incident response. As part of the CCW
contract, we were able to map species and biotopes likely to be sensitive to the effects of oil spills (i.e. smothering, physical disturbance, and hydrocarbon contamination) within the Pembrokeshire SAC and Severn Estuary SAC, including nationally important species and biotopes. Therefore, we were able to demonstrate the identification of nationally important benthic species and habitats at particular risk from oil spills as specified in the objective. 4. Tasks and Milestones
4.1 Introduction
The work programme was divided into a number of tasks and associated milestones. The work programme is show in Table 1 below.
4.2 Task 1. Maintain the MarLIN database and Web site.
M1 Maintain, improve and develop the database and Web site including software upgrades.
M2 Incorporate fields to the database / Web site that address application of the Faial / Texel criteria
The Web site was maintained and continually updated throughout the contract period, culminating in a major redesign and relaunch of the site in November 2003. Fields to identify OSPAR Annex V threatened and declining species and habitats were added to the Biology and Sensitivity Key Information database when a ratified list became available in 2003. Completion of Task 1 is detailed in Section 5.
4.3 Task 2. Contribute to the application of sensitivity information to marine environmental protection especially by promoting approaches developed in the UK in Europe.
M1 Contribute to appropriate European fora as opportunity arises.
The MarLIN has taken every opportunity to promote the application of sensitivity assessment to marine environmental management and protection, and hence the work funded by Defra, in the UK and Europe.
T1/M2 Incorporate fields to the database / Web site that address application of the Faial criteria. T2/M1 Contribute to appropriate European fora as opportunity arises.
Liaison with European scientists to develop the MarLIN approach for European seas. Aggregate EcoQOs 19-20 Oct, 2001. Lowestoft.
T3/M1 Submit list of species to be researched to DEFRA Nominated Officer. T3/M2 Have agreed species to be researched and prioritize (meeting). T3/M3 Complete research into tranche 1 species.
T6/M1 Progress reports & invoice on payment milestone dates. Due 8/3/02
T1/M1 Maintain, improve and develop the database and Web site including software upgrades. T3/M4 Complete research into tranche 2 species.
T6/M1 Progress reports & invoice on payment milestone dates. Due 13/9/02
T1/M1 Maintain, improve and develop the database and Web site including software upgrades. T2/M1 Contribute to appropriate European fora as opportunity arises.
InfoCoast meeting (spring 2002)
‘Identifying threatened species’ workshop as a part of the Review of Marine Nature Conservation.
T3/M5 Complete research into tranche 3 species.
T6/M1 Progress reports & invoice on payment milestone dates. Due 14/12/02
T1/M1 Maintain, improve and develop the database and Web site including software upgrades. T2/M1 Contribute to appropriate European fora as opportunity arises.
United Kingdom ‘Biotopes classification’ workshop. T3/M6 Complete research into tranche 4 species.
T4/M1 Advisory group meets to establish information to be displayed, links etc. T4/M2 Computer software purchased and installed.
T6/M1 Progress reports & invoice on payment milestone dates. Due 15/03/03
T1/M1 Maintain, improve and develop the database and Web site including software upgrades. T2/M1 Contribute to appropriate European fora as opportunity arises.
Anticipate attending the ICES/OSPAR/EEA Habitat classification workshop (dates unknown at present).
T3/M7 Complete research into tranche 5 species.
T6/M1 Progress reports & invoice on payment milestone dates. Due 15/09/03
T1/M1 Maintain, improve and develop the database and Web site including software upgrades. T2/M1 Contribute to appropriate European fora as opportunity arises.
T3/M8 Complete research into tranche 6 species.
T4/M3 Demonstration of link between survey data and sensitivity information. T6/M1 Progress reports & invoice on payment milestone dates.
T2/M1 Contribute to appropriate European fora as opportunity arises. T3/M9 Complete research into tranche 7 species.
T5/M1 Collaborate in re-development of the oil spill sensitivity atlas as required (meetings). T5/M2 Demonstrate the identification of areas at risk from oil spills using the survey data-sensitivity link (with T4/M3).
T6/M1 Progress reports & invoice on payment milestone dates. Due 28/10/04
T1/M1 Maintain, improve and develop the database and Web site including software upgrades. T2/M1 Contribute to appropriate European fora as opportunity arises.
T6/M2 Final Report on Programme.
The MarLIN team has taken a proactive approach and attended and contributed to numerous relevant meetings and workshops during the contract period (Table 2). The following meetings originally specified in the contract were either cancelled or did not take place:
• InfoCoast 2002,
• ‘Identifying threatened species’ for the Review of Marine Nature Conservation meeting, and the
• UK biotope classification workshop.
In addition, we were not invited to subsequent ICES/EEA/OSPAR Habitat classification workshops.
Table 2. European fora, meetings and workshops attended to promote the use of sensitivity information in marine environmental management, and obtain feedback. Keith Hiscock (KH), Harvey Tyler-Walters (HTW), Dan Lear (DL), Jon Parr (JP).
Date Conference, workshop or meeting Contributor
4-5 December
2001 ‘Managing the resources of the Atlantic Margin’ (Atlantic Frontier Environmental Network), Edinburgh. KH 21 March 2002 ‘Habitats and Habitat Integrity as Indicators for Interpreting and
Describing Change in Marine Ecosystems’ Workshop, Edinburgh
HTW
15 August 2002 Offshore wind farms workshop, London. KH
10 September 2002
Presented ‘Sensitivity of marine biodiversity to environmental change’ at British Association for the Advancement of Science meeting, Leicester.
KH 11 September
2002
Delivering Integrated Marine Mapping for the UK, London. KH 16 October 2002 Information Management for Strategic Environmental
Assessment and Regulation in the Marine Environment, Chester.
HTW 31 October -1
November 2002
‘Oceans of Change’ conference, Greenwich, London. KH 14 November
2002
Marine Stewardship, London. KH
24 November 2002
Ocean Biodiversity Information System, Brussels. KH 25 November
2002
Offshore Wind Farms Strategic Environmental Assessment workshop, London.
JP 25-27 November
2002
Date Conference, workshop or meeting Contributor 13 December
2002 Workshop on Sensitivity Mapping, Marine Institute, Dublin. JP, DL, HTW. 22-23 January
2003
‘Coastal futures’ meeting, London. KH
11 February 2003
Meeting with representatives of the Irish Sea Pilot to discuss collaboration and contribution, Peterborough.
KH, HTW 13 February
2003
Assessing the cumulative effects of marine activities, a CCW workshop, Chester.
HTW 6 March 2003 Marine Aggregates and Biodiversity: developing a common
understanding, London.
HTW 16 June 2003 Indicators of Marine Biodiversity, Defra, London. KH 18 June 2003 Important New Developments in Marine and Coastal GIS, Metoc,
London.
DL 22 August 2003 Irish Sea Pilot – Mapping Sensitivity within Marine Landscapes -
Consultative workshop, Plymouth. DL, HTW, KH
9-12 September 2003
38th European Marine Biology Symposium, Alveiro, Portugal. Presentation by Keith Hiscock & Harvey Tyler-Walters on “Assessing sensitivity of seabed species and biotopes – the Marine Life Information Network (MarLIN)”.
KH
18 September 2003
Climate change & Biodiversity Action Plans, Edinburgh. KH 22 September
2003 Astra Zeneca, Brixham. Presentation on
MarLIN. KH
26 September 2003
MIRO Best Practice Guide to Assessing the Impacts of Aggregate Extraction on the Marine Environment: Benthic/Epibenthic ecology workshop. London.
HTW 1 October 2003 Spatial Planning in the Coastal and Marine Environment: next
steps to action, London.
HTW 2 October 2003 Climate change and biodiversity, Scottish Executive. Edinburgh. KH 27-30 October
2003
30th
Pacem in Maribus, Kiev, Ukraine. Presentation by Keith Hiscock on “Establishing and managing marine protected areas: using science effectively”.
KH 11 December
2003.
Inter Agency Committee on Marine Science and Technology Marine Environmental Data Advisory Group, London. [Presentation].
KH 3 March 2004 Water Framework Directive: implications for estuaries and
coasts, London.
HTW 22-24 March
2004
ICES Working Group on Sensitivity, Copenhagen. KH 29 April 2004 UK Climate Impact Programme / MarClim, London. KH 20–22
September 2004
Littoral 2004 – Delivering Sustainable Coasts: Connecting Science and Policy conference, Aberdeen, Scotland.
Presentation of paper by Keith Hiscock, Jon Parr and Harvey Tyler-Walters “Bringing Marine Life Information Together for Decision Making”.
KH
18 October 2004 ‘State of marine benthos’, Defra meeting, Peterborough. KH MarLIN presented a paper outlining our approach to the 38th European Marine Biology Symposium in Portugal entitled ‘Assessing the sensitivity of seabed species and biotopes – the Marine Life Information Network (MarLIN)’, which will be published in the journal Hydrobiologia shortly. MarLIN Biology and Sensitivity Key Information was part of a paper
MarLIN also presented a paper entitled ‘Bring marine life information together for decision making’ at the Littoral 2004 Delivering Sustainable Coasts: Connecting Science and Policy conference in Aberdeen, Scotland. The utility of MarLIN information for environmental managers, amongst other sorts of information, has been described in an article in Marine Pollution Bulletin (Hiscock et al., 2003). In addition, we are involved in the Marine
Biodiversity and Ecosystem Functioning (MARBEF) and ‘European Lifestyles and Marine Ecosystems (ELME) European projects.
4.4 Task 3. Undertake further research on species and habitats that are keystone, characterizing or indicator species including species and habitats found in UK waters that are selected under the OSPAR prioritization process.
M1 Submit list of species to be researched to Defra Nominated Officer M2 Have agreed species to be researched and prioritize (meeting) M3 Complete research into tranche 1 species
M4 Complete research into tranche 2 species M5 Complete research into tranche 3 species M6 Complete research into tranche 4 species M7 Complete research into tranche 5 species M8 Complete research into tranche 6 species M9 Complete research into tranche 7 species
The list of species to be researched was agreed in January 2002. The Biology and Sensitivity Key Information reviews of species listed in tranches 1-7 (see Table 3) were completed to schedule by end March 2004. In some cases, there was not enough
information available to complete a full Key Information review and only basic information could be completed. In a few cases, although there was not enough information available on the chosen species to prepare a full review, a similar or surrogate species was chosen. For example, Electra pilosa was subject to full Key Information research, while only basic information was completed for Electra crustulenta. Similarly, full reviews of Nephtys hombergii, Spisula solida, and Nucula nitidosa were completed.
The full Key Information reviews and basic information available on the MarLIN Web site at the end of the contract (October 2004) are listed in Appendices 1 and 2.
4.5 Task 4. Develop links between sensitivity and survey data M1 Advisory group meets to establish information to be displayed. M2 Computer software purchased and installed.
M3 Demonstration of link between survey data and sensitivity information. The Sensitivity Mapping Advisory Group was convened in December 2001 in Dublin, Ireland, to discuss MarLIN’s approach to sensitivity assessment and sensitivity mapping. The advisory group members were consulted on changes to our benchmarks and
sensitivity assessment rationale, together with the existing Biology and Sensitivity Technical Advisory Group. Both advisory groups were merged towards the end of the contract and met again in February 2004 to discuss progress made towards sensitivity mapping and its role in marine spatial planning. MySQL was installed to aid queries from the Biology and Sensitivity Key Information database. ArcGIS was adopted as the in-house GIS, although MapInfo was later purchased through a sensitivity mapping contract
we were able to demonstrate linking survey data and sensitivity information to the nominated officer on schedule in September 2003.
Table 3. Biology and Sensitivity Key Information species research tranches completed (*=surrogates).
Species name Common name Reason for inclusion Tranche Review
type Ahnfeltia plicata A red seaweed Representative / Characterizing 1 Full Brissopsis lyrifera A burrowing sea
urchin
EcoQ vulnerable indicator? 1 Full Chondrus crispus Carragheen Representative / Characterizing;
Exploited
1 Full Fabulina fabula A bivalve mollusc Representative / Characterizing 1 Full
Magelona mirabilis A worm Representative / Characterizing; EcoQ opportunist indicator?
1 Full Musculus discors A mussel Representative / Characterizing;
EcoQ vulnerable indicator?
1 Full Amphiura chiajei A brittle star Representative / Characterizing 2 Full
Bathyporeia pelagica An amphipod Representative / Characterizing 2 Full Cordylophora caspia A hydroid Rare or scarce; Representative /
Characterizing
2 Full Electra crustulenta An encrusting
bryozoan
Representative / Characterizing 2 Basic Electra pilosa An encrusting
bryozoan Representative / Characterizing * Full Eurydice pulchra An amphipod Representative / Characterizing 2 Full
Flustra foliacea Hornwrack Representative / Characterizing 2 Full Gammarus salinus An amphipod Representative / Characterizing 2 Full
Hartlaubella gelatinosa A hydroid Rare or scarce; Representative /
Characterizing 2 Basic
Molgula manhattensis A sea squirt Representative / Characterizing 2 Full Neomysis integer A mysid Representative / Characterizing 2 Full Spio filiformis A worm Representative / Characterizing 2 Full Spiophanes bombyx A worm Representative / Characterizing;
EcoQ opportunist indicator? 2 Full
Tubificoides benedii A worm Representative / Characterizing 2 Full Abra alba A bivalve mollusc Exemplary; Representative /
Characterizing 3 Full
Bugula turbinata A bryozoan Representative / Characterizing 3 Full Capitella capitata A worm Representative / Characterizing 3 Full Cladophora rupestris A green seaweed Representative / Characterizing 3 Full Conopeum reticulum A bryozoan Representative / Characterizing 3 Full Lanice conchilega A tube worm Representative / Characterizing 3 Full Pomatoceros triqueter Keeled tube worm Representative / Characterizing 3 Full Suberites carnosus A sponge Representative / Characterizing 3 Basic Talitrus saltator An amphipod Representative / Characterizing 3 Full Eucratea loricata A bryozoan Representative / Characterizing 4 Basic Eudendrium
arbusculum
A hydroid Representative / Characterizing 4 Basic Nephtys cirrosa A worm Representative / Characterizing 4 Basic Nephtys hombergii A worm Representative / Characterizing * Full Obelia longissima A hydroid Representative / Characterizing 4 Full Petricola pholadiformis A bivalve mollusc Representative / Characterizing 4 Basic
type Rhodothamniella
floridula
A red seaweed Representative / Characterizing 4 Full Corbula gibba Basket shell Representative / Characterizing 5 Full Patella ulyssiponensis China limpet OSPAR; Key; Representative /
Characterizing
5 Full Aphrodita aculeata Sea mouse Fisheries impacts indicator of,
EcoQ vulnerable indicator ; Representative / Characterizing
6 Full
Arctica islandica Icelandic Cyprine OSPAR; Eutrophication indicator, EcoQ vulnerable indicator, Representative / Characterizing;
6 Full
Dipturus batis Common skate OSPAR; BAP; RDB Endangered A1abcd+2bcd; Exploited 6 Full Hippocampus guttulatus Long snouted seahorse
RDB Vulnerable 6 Basic
Hippocampus hippocampus
Short snouted seahorse
RDB Vulnerable 6 Full
Osilinus lineatus Thick top shell Key; Representative / Characterizing
6 Full Cancer pagurus Edible crab EcoQ vulnerable indicator;
Representative / Characterizing;
7 Full Carcinus maenas Common shore
crab
Indicator of endocrine disruption, cold winters and hypoxia;
Representative / Characterizing
7 Full
Cirratulus cirratus A polychaete Indicator; Key; Representative / Characterizing
7 Full Corophium volutator. An amphipod Indicator of endocrine disruption;
Representative /Characterizing 7 Full Crangon crangon A shrimp Indicator of cold winters and
hypoxia; Representative / Characterizing
7 Full
Nephrops norvegicus Norway lobster Indicator of hypoxia; Key; Representative / Characterizing; Exploited
7 Full
Nucula sulcata A bivalve Indicator of eutrophication; Representative / Characterizing
7 Basic Nucula nitidosa A bivalve Indicator of eutrophication;
Representative / Characterizing
* Full Owenia fusiformis A polychaete Indicator oil & gas extraction;
EcoQ opportunist indicator; Representative / Characterizing
7 Full
Spisula elliptica A bivalve Indicator of hypoxia, oil & gas extraction; EcoQ vulnerable indicator; Representative / Characterizing
7 Basic
Spisula solida A bivalve Indicator of hypoxia, oil & gas extraction; EcoQ vulnerable indicator; Representative / Characterizing
M1 Collaborate in re-development of the oil spill sensitivity atlas as required (meetings).
M2 Demonstrate the identification of areas at risk from oil spills using the survey data-sensitivity link (with T4/M3).
MarLIN was unable to engage with the review of Marine Environmental High Risk Areas (MEHRA). The redevelopment of the national oil spill atlas was lead by the Marine and Coastguard Agency (MCA). In spite of numerous attempts, we were unable to meet with MCA representatives and no representatives were able to attend our Sensitivity Mapping Advisory Group meetings. The MCA eventually decided to adopt the old but safe
surrogates for sensitivity in the redevelopment of the national oil spill sensitivity map, and no information was requested from MarLIN.
However, we negotiated a contract with the Countryside Council for Wales (CCW) to test sensitivity mapping in oil spill pollution incident response. As part of the CCW contract, we were able to map species and biotopes likely to be sensitive to the effects of oil spills (i.e. smothering, physical disturbance, and hydrocarbon contamination) within the
Pembrokeshire SAC and Severn Estuary SAC, including nationally important species and biotopes. Therefore, we were able to demonstrate the identification of nationally important benthic species and habitats at particular risk from oil spills, albeit only within two marine SACs.
4.7 Task 6. Report on programme
M1 Progress reports & invoice on payment milestone dates. M2 Final Report on Programme.
Progress reports were produced for each invoice period and agreed with the nominated officer on time. The final report was completed to schedule.
5. Maintain the MarLIN database and Web site. 5.1 Introduction
The MarLIN Web site, database and supporting server have developed substantially throughout the contract period. Development was fueled by the continued growth of the Web site content, feedback from users and the increasing demand for our services. In 2002, it became apparent that our existing server was unable to cope with the increasing demands placed on it, especially when it was required to serve out detailed searches of our increasing marine life survey data holdings. As a result, the server began to crash periodically. The problem was partly alleviated by increasing its memory capacity, and converting some database software to more powerful MySQL software (an open source product). In addition, some computer code was re-written in a more efficient manner. Nevertheless, demand continued to grow and, in 2003, the existing server was replaced with a modern dedicated server. The MarLIN team took the opportunity
presented to totally redesign the MarLIN Web site, incorporating many of the comments received from users and providing space for future development and growth. The new server was installed in March 2003 and the redesigned Web site launched in October 2003. The following section outlines the MarLIN Web site from October 2003 onwards.
The redesign of the Web site retained and improved existing functionality of the older version, and built on the design principles for the MarLIN Web site outlined in Tyler-Walters et al. (2001). The Web site redesign removed the use of frames, a format not supported by HTML standards, and replaced much of the navigation functionality with pull down menus using Java Script. The overall appearance of the Web site was standardized using a background Cascading Style Sheet (CSS), so that the style was consistent
through-out the site, and retained its style when viewed by users. Web site upgrades included:
• adoption of a clearer easier to read font (Arial) to improve accessibility to users with reading difficulties;
• inclusion of a systematic header with pull-down menus throughout the site, so that users can navigate to different parts of the site or supporting information with a single ‘click’;
• adoption of a pull-down menu for each section of the Web site, i.e. o Biology and Sensitivity,
o Data Access,
o Education and Recording, o search tools,
o publications and products, and o MarLIN services;
• the introduction of ‘thumb-nailed’ images to the lists of species information; • a link from each species page to a search of relevant survey data, to add further
value to the species reviews;
• a complete edit of the Active Server Page (ASP) Scripts behind the Web pages to increase speed;
• a complete edit of the species and biotope key information Web pages, and
• a ‘search’ menu providing searches for species or biotopes, for important species or biotopes, and for species or biotopes likely to be sensitive to human activities, together with a general search tool and database of relevant Web links. 5.2.2 Pull-down menus
The pull-down menus improved navigation greatly, by providing direct links to the relevant sections of the Web site and supporting documentation. The pull-down menus form part of the Web site header and are, therefore, always accessible from any part of the Web site. For example, the Biology and Sensitivity menu includes direct links to:
• a description of the contents of the Key Information reviews; • species and biotopes information reviews;
• notes on conventions and legislation relevant to marine life protection; • a summary of the sensitivity assessment rationale;
• the sensitivity assessment benchmarks;
• the matrix linking activities to affected environmental factors; • species and biotope bibliographies, and
prepared specifically to support the biology and sensitivity key information reviews, and to explain the MarLIN approach to sensitivity assessment.
The ‘Data Access’ menu provides direct links to:
• information about the data access sub-programme;
• the search tools for MarLIN hosted marine life survey data; • the SEArchable BEnthic Data (SEABED) Map;
• the National Biodiversity Network (NBN) Gateway, and • a search by data or information provider.
5.2.3 Search tools
The existing search tools (see Tyler-Walters et al., 2001) were retained and expanded. The search for ‘important’ species and biotopes now includes those identified as
threatened or declining under Annex V of the OSPAR convention (OSPAR, 2003). A ‘general search’ of the Web site has also been added. The general search allows users to search either:
• the entire Web site by key words or combinations of key words, or
• within separate sections of the Web site by scientific name, common name or phylum.
The general ‘key word’ search of the Web site is also available via the home page. The general search enables users to locate information by key word; for example, ‘ecological function’ will locate every page on the site where the words ‘ecology’ or ‘function’ are used. The ‘Search’ menu includes direct links to:
• a search for species by scientific name, common name, phylum or words in the species description;
• a search for biotopes by biotope code, biotope name, words in the biotope description or species names within the biotope name;
• a search for species or biotopes likely to be sensitive to the effects of human activities and natural events;
• a search for ‘important’ species or biotopes;
• a search for biotopes included within interest features of Annex I habitats of the Habitats Directive, and
• a general key word search.
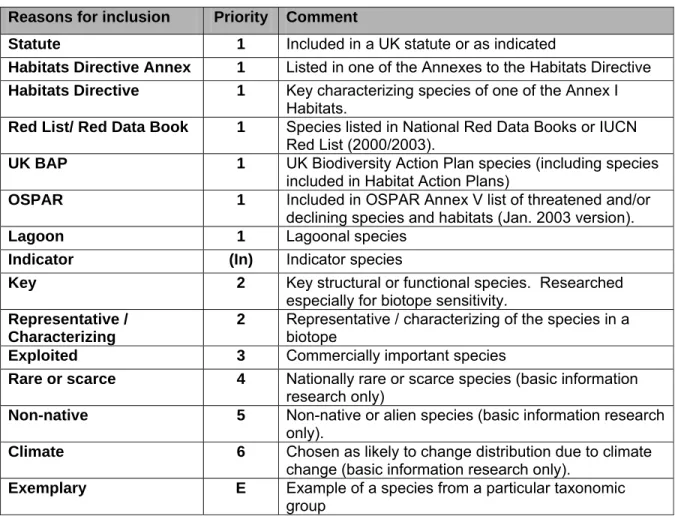
The search for ‘important’ species or biotopes searches identify species or biotopes in the MarLIN Biology and Sensitivity Key Information database that are listed under:
• international conventions (e.g. Berne, CITES);
• European or national legislation (e.g. EC Habitats Directive, Wildlife & Countryside Act 1981, Nature Conservation and Amenity Lands (NI) Order 1985 (as amended 1989) Wildlife (NI) Order 1985);
• IUCN Red list 2000/2003;
• nationally rare or scarce species;
The Biology and Sensitivity Key Information Database (the database) was described in detail by Tyler-Walters et al. (2001). The database continued to grow during the contract period as new species were added. The species and biotope coverage is detailed in Section 6.
The database itself has been adjusted to accommodate the requirements of the revised sensitivity assessment rationale (see Section 7). The database now includes fields for the revised (combined) sensitivity scale (Section 7.6). The database uses the relevant
intolerance and recoverability ranks to complete the sensitivity field automatically based on the revised sensitivity scale. However, the information can be amended where necessary by the review author based on the Key Information.
In addition, new fields have been added to the ‘importance’ forms and tables to identify species and habitats that were identified as threatened or declining under Annex V of the OSPAR Convention. These fields allow the database to be searched on-line for OSPAR threatened or declining species and habitats (see Section 5.22 above).
5.4 The SEArchable BEnthic Data (SEABED) Map 5.4.1 Introduction
Objective 2 of the contract placed greater emphasis on building links between sensitivity information and survey data. The link between species and biotope sensitivity information and survey data in a desktop Geographical Information System (GIS) using either ArcGIS or MapInfo is detailed in Section 7.
The Data Access Sub-programme had previously mapped hosted survey data using static outputs from our in-house GIS, which were them manually linked the to survey data information using ‘hotspots’; a time consuming task, especially as the volume of hosted survey data increased. Therefore, we took the opportunity of a short term bursary student (Daniel McGreal) to develop an on-line mapping capability.
5.4.2 The Data Access Sub-programme
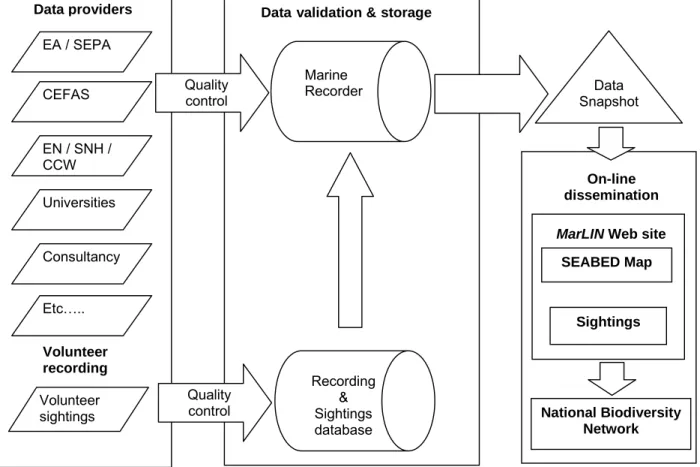
The Data Access Sub-programme of MarLIN began in 1999 and has gradually built-up an extensive metadata catalogue of marine survey data sets; the majority of which can be interrogated on-line to view their metadata, details of the survey type and sampling techniques, and most importantly, a list of the species recorded and their location. Data Access receives marine survey data in paper or electronic format from data
providers, e.g. statutory agencies, marine biology laboratories, consultancies and wildlife trusts. The information is checked in-house and entered into Marine Recorder (see Figure 1). Marine Recorder is the standard data entry tool developed by the UK National
Biodiversity Network (NBN) for biological recording within the UK. In addition, the MarLIN Web site hosts a sighting scheme for a selection of Biodiversity Action Plan (BAP) species, keystone species, non-native species and species likely to change in distribution due to climate change, under the auspices of the Education and Recording Sub-programme. Sightings can be submitted by users via an on-line recording form, or by the telephone, email or paper recording form. All records are entered into Marine Recorder.
At the end of October 2004 the MarLIN Web site hosted information on over 372 datasets (see Appendix 3), which included:
• 5,600 survey events, • 19,000 samples and
‘Snapshot’ is used by the Web server to power on-line queries, and is interrogated by the SEABED Map. The ‘Snapshot’ is also sent to the National Biodiversity Network (NBN) for inclusion in the NBN Gateway.
5.4.3 Mapping software
The on-line mapping tool (the SEABED Map) was created using Scaleable Vector
Graphics (SVG) and PHP Hypertext Processor (PHP) open-source software. Open source software was chosen because it was readily available and widely supported by a variety of operating systems and Web browsers. The open-source software is freely available, so that users can easily download any upgrades required to view the mapping tools on-line. The software allows users to interrogate our in-house Marine Recorder ‘Snapshot’. The ‘snapshot’ is converted into MySQL (another open source software programme), which is a much faster and more Web compatible database than MS Access.
Figure 1. The MarLIN Data Access Sub-programme data structure 5.4.4 The SEABED Map
The SEABED Map allows users to search for marine benthic survey data by: • species name;
• survey name or survey organization name;
• location name or Marine Nature Conservation Review (MNCR) sector, or • any combination of all three.
Data providers EA / SEPA CEFAS
EN / SNH / CCW Universities
Consultancy Etc…..
Quality control
Marine Recorder
Volunteer recording Volunteer sightings
Data Snapshot
MarLIN Web site
SEABED Map On-line dissemination
National Biodiversity Network Quality
control
Recording & Sightings database
Sightings Data validation & storage
MarLIN hosted data, in which the user can ‘zoom in’ to view their location of interest.
Figure 2. SEABED Map. Example search for survey data for Mytilus edulis, Modiolus modiolus and Atrina fragilis.
Figure 3. SEABED Map. Comparative distribution of Sabellaria alveolata and Sabellaria spinulosa (left), with close-up of the north Irish Sea (right).
name, survey name etc.
Clicking on any one survey point lists the species recorded at that point, their relative abundance, and the survey name and sample location (lat/long) (see Figure 4). Where numerical data is available, the relative abundance of species can be displayed as a histogram (see Figure 5). The survey name is in turn linked to the survey metadata. In addition, available physical, biotope or sample replicate data for a species sample can be displayed.
Figure 4. SEABED Map. Species list for an individual survey point.
Overall, the SEABED Map tool provides a simple, fast, interactive mapping tool to display the marine benthic survey data hosted by MarLIN. In addition, each species basic
information and Biology and Sensitivity Key Information review is linked directly to the SEABED Map, so that a single click presents the user with an interactive map of MarLIN hosted survey data for that species.
5.5 Use of the MarLIN Web site
The MarLIN Web site continued to grow under the 2001-2004 Defra contract. During the contract period the Web site reached a ‘critical mass’ of species and biotope information, having researched the majority of key structural, key functional or characterizing species and the biotopes (or their representatives) that constitute Habitats Directive Annex I
marine habitats in England and Scotland, together with the majority of Scheduled, UK BAP or OSPAR Annex V marine benthic species It now represents a major source of
information on the biology and ecology of key marine species and habitats in the UK, and the likely effects of human activities and natural events.
The MarLIN Web site continues to attract a large user group, including statutory environmental protection agencies, environmental consultancies, marine biologists, university students, amateur naturalists and members of public. During the contract period, Web site usage overwhelmed our previous server, which was then upgraded (see
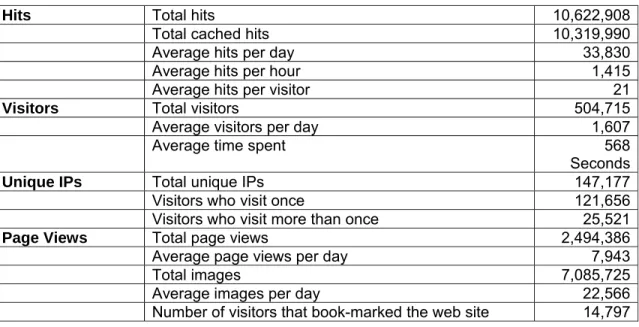
Figure 5. SEABED Map. Histogram of relative species abundance within survey sample. The Web statistics since the site was re-launched in November 2003 are shown in Table 4. Statistics for previous years are not available. It can be seen from Table 4 that we received over 10 million hits from over 500,000 visitors, and averaged over 1,600 visitors a day in the last 11 months alone.
Table 4. Web statistics since the re-launch of the Web site (November 2003 to mid September 2004).
Hits Total hits 10,622,908
Total cached hits 10,319,990
Average hits per day 33,830
Average hits per hour 1,415
Average hits per visitor 21
Visitors Total visitors 504,715
Average visitors per day 1,607
Average time spent 568
Seconds
Unique IPs Total unique IPs 147,177
Visitors who visit once 121,656
Visitors who visit more than once 25,521
Page Views Total page views 2,494,386
Average page views per day 7,943
Total images 7,085,725
Average images per day 22,566
Number of visitors that book-marked the web site 14,797 The Web site received users from over 139 different countries since November 2003. The use of the Web site was dominated (69%) by the United States of America (USA).
November 2003 (Figure 7).
Brazil
Sweden
Japan India Norway China Mexico
Ireland Belgium Singapore
Italy Portugal
France
Canada Australia
Germany Netherlands Spain
European Union
United Kingdom
Figure 6. The top twenty countries of origin of our users (excluding the USA).
Unknown
Search engine
NI Government Agency Private
Countryside Council for Wales Environment
Agency Canadian Government
Agency Academic
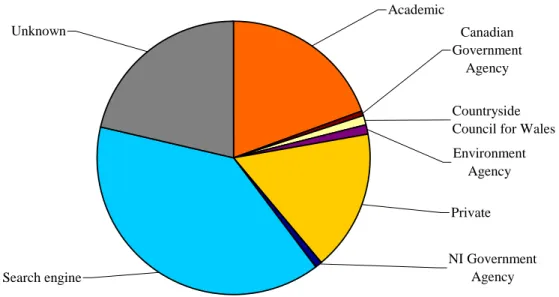
Figure 7. The range of different organization types using the Web site.
Government or statutory agencies contributed a relatively small number of visitors. However, it should be noted that many statutory environmental protection agency users use their home systems to access the Internet, and may be included in the ‘unknown’
6. Undertake further research on species and habitats that are keystone, characterizing or indicator species
6.1 Introduction
Objective 3 of the contract specified:
To undertake further research on species and habitats that are keystone, characterizing or indicator species including species and habitats found in UK waters that are selected under the OSPAR prioritization process.
Objective 4 of the contract specified:
To apply the Faial / Texel criteria developed under OSPAR, as appropriate, to the preparation of species and habitat information reviews.
The development and dissemination of Biology and Sensitivity Key Information species reviews were detailed by Tyler-Walters et al.(2001), while the biotope reviews, funded by English Nature (EN) and Scottish Natural Heritage (SNH), were detailed by Tyler-Walters & Hiscock (2003). The structure and content of the reviews were retained with only minor adjustments through the contract period. However, the sensitivity assessment rationale was amended in March 2003 to take into account recent developments under the Review of Marine Nature Conservation (RMNC) (Laffoley et al., 2000) and to facilitate sensitivity mapping (see Section 7).
6.2 The Biology and Sensitivity Key Information database
The Biology and Sensitivity Key Information database holds the key information, and supports the queries run via the Web site. The Biology and Sensitivity Key Information Web pages are generated from the information in the database using in house Visual Basic scripts (see Tyler-Walters et al., 2001).
The database increased in size as new species and biotope information were added. The following additional fields were added to the database in the contract period:
• revised intolerance, recoverability and sensitivity fields; • identified as an OSPAR threatened or declining species; • identified as an OSPAR threatened or declining habitat, and
• the OSPAR threatened or declining habitat in which a biotope is likely to occur. Species Key Information Web pages now identify species that have been identified as threatened or declining by the Biodiversity Committee of OSPAR (OSPAR, 2003). Biotope Key Information pages now identify OSPAR threatened and declining habitat in which the relevant biotope occurs. For example the Lophelia reef biotope (COR.Lop) is clearly identified as an OSPAR priority habitat.
6.3 Revision of benchmarks
The benchmarks used in the assessment of intolerance (= sensitivity sensu stricto) were agreed in late 1999 (Tyler-Walters & Jackson, 1999; Tyler-Walters et al., 2001). The MarLIN team has since accrued over five years experience of sensitivity assessment. Therefore, a few of the benchmarks were revised, in light of this experience and in discussion with our Technical Advisory Management Group and Sensitivity Mapping Advisory Group, in April 2003.
‘standard boat anchor’. However, physical disturbance as a result of mobile fishing gear continues to be a concern in marine conservation. In most cases, the weight of evidence regarding habitat or species sensitivity to physical disturbance concerns the effects of mobile fishing gear. Several of the biotope and species sensitivity assessments made since 1999, were based on their sensitivity to physical disturbance by mobile fishing gear, where their sensitivity to ‘anchorage’ would have been un-representative, e.g. epifaunal communities or Modiolus modiolus beds.
Therefore, the benchmark was revised and the magnitude of impact set as equivalent to that caused by a passing scallop dredge. A scallop dredge was more representative of the impact likely to cause damage to a habitat or species, and to be of concern for marine conservation or environmental management (see Table 5).
Table 5. Revision of physical disturbance and abrasion benchmark March 2003 Benchmark (1999 version)
The level of effect against which intolerance is rated. Abrasion or
physical impact
This factor includes mechanical interference, crushing, physical blows against, or rubbing and erosion of the organism or habitat of interest.
Force equivalent to a standard boat anchor landing on or being dragged across the organism e.g., a 5 –10 kg anchor and its chain (used by a 7-8 m boat). A single event is assumed for assessment.
Where trampling is relevant, the evidence and trampling intensity will be reported in the rationale.
Revised benchmark (April 2003 onwards)
The level of effect against which intolerance is rated. Physical
disturbance or abrasion
This factor includes mechanical interference, crushing, physical blows against, or rubbing and erosion of the organism or habitat of interest.
Force equivalent to a standard scallop dredge landing on or being dragged across the organism. A single event is assumed for assessment.
Where trampling is relevant, the evidence and trampling intensity will be reported in the rationale.
6.3.2 Changes in nutrient levels
The 1999 benchmark (Table 6), suggests a magnitude of nutrient enrichment of 3 mg/l N, or 0.3 mg/l P, or a 50% change in nutrient concentration. In our experience, it was
extremely difficult to obtain information on the effects of nutrient enrichment that included the level of accuracy required to make an assessment against the benchmark. In practice, it has proven to be neither practical nor accurate to set quantified benchmark levels for nutrient enrichment and an evidence based approach has been used (Table 6).
Therefore, the evidence based benchmarks used for other chemical contaminants are now used for changes in nutrient levels.
6.4 Update of database and Key Information reviews
The combination of ‘intolerance’ (previously sensitivity sensu stricto) and ‘recoverability’ and the development of a revised ‘sensitivity’ scale (Section 7), together with the revision of two benchmarks meant that the database and Key Information reviews has to be
As a result, all the relevant on-line glossaries, scales and definitions, were updated together with the sensitivity assessment protocol (Section 7). The physical disturbance and abrasion sensitivity assessments for all 152 of the species reviews and all 117 biotope sensitivity assessments were also updated. The combined ‘sensitivity’ scale also revealed inconsistencies in some of our older sensitivity assessments, and a running system of updates has been put in place. We have also replaced virtually every instance of 'sensitive' or 'sensitivity' on the Web site with the terms 'intolerant' or 'intolerance' respectively. A task roughly consistent with editing every paragraph in the sensitivity assessment sections of the biotope and species reviews sections, which contained over 750,000 words of text.
The entire database, and hence biotope and species Key Information Web pages, were subject to a complete edit, to remove typographical errors and inconsistent use of terms. All relevant glossaries and supporting documentation provided on the Web site was also checked and edited prior to the launch of our redesigned Web site in November 2003 (Section 4). The revised sensitivity scales and definitions came on-line with the revision of the Web site.
In addition, the distribution maps of all the algal (seaweed) reviews on the Web site were revised to take into account the recent British Phycological Society’s ‘Checklist and Atlas of the Seaweeds of Britain and Ireland’ (Hardy & Guiry, 2003). The general glossary of terms was continuously updated, as new terms were required by species or biotope research. New images were also added to the Web site as they became available. Table 6. Revision of the changes in nutrient levels benchmark March 2003.
Benchmark (1999 version)
The level of effect against which sensitivity is rated. Changes in
levels of nutrient
A change in background nutrient concentrations, e.g., a change of total nitrogen of 3 mg/l and/or phosphorus of 0.3 mg/l as an annual average. Alternatively, a 50% change in of nutrient concentration as an annual average.
Revised benchmark (April 2003 onwards)
The level of effect against which sensitivity is rated. Changes in levels of synthetic chemicals Changes in levels of heavy metals Changes in levels of hydrocarbons Changes in levels of radionuclides Changes in levels of nutrient
Sensitivity is assessed against the available evidence for the effects of contaminants on the species (or closely related species at low confidence) or community of interest. For example:
• evidence of mass mortality of a population of the species or community of interest (either short or long term) in response to a contaminant will be ranked as high sensitivity;
• evidence of reduced abundance, or extent of a population of the species or community of interest (either short or long term) in response to a contaminant will be ranked as intermediate sensitivity;
• evidence of sub-lethal effects or reduced reproductive potential of a population of the species or community of interest will be assessed as low sensitivity.
The evidence used is stated in the rationale. Where the assessment can be based on a known activity then this is stated. The tolerance to contaminants of species of interest will be included in the rationale when available, together with relevant supporting material.