Vol. 17, No. 2, pp. 119{132 c
Sharif University of Technology, December 2010
A New Evidential Distance
Measure Based on Belief Intervals
V. Khatibi
1and G.A. Montazer
1;Abstract. So far, most of the evidential distance and similarity measures proposed in the Dempster-Shafer theory literature have been based on the basic belief assignment function, so as the belief and plausibility functions as two main results of the theory are not directly used in this regard. In this paper, a new evidential distance measure is proposed based on these functions according to nearest neighborhood concept. After assigning basic belief values to propositions and constructing the belief and plausibility functions or the belief interval, this evidential distance measure compares the similarity between the unknown pattern and class belief intervals. For this purpose, we rst acquire the belief and plausibility functions or the belief intervals and then the distance between the belief intervals of uncertain pattern feature vectors and samples are calculated. We applied this novel distance measure to the bacillus colonies recognition and coronary heart disease patients classication problems to examine the proposed measure capability in contrast to other evidential measures. Our experiment illustrates that the belief interval distance measure yields the accuracy rates of 91.66 and 92.45 percent for unknown bacillus patterns recognition and coronary heart disease patients classication, respectively, which in contrast to other evidential measures shows superior performance.
Keywords: Evidence theory; Approximate reasoning; Pattern recognition; Belief interval distance; Bacillus colony recognition; Coronary heart disease patients classication.
INTRODUCTION
Pattern classication is concerned with the assignment of unknown patterns, represented by feature vectors, to predened categories or classes [1]. In fact, pattern recognition problems typically involve the classication of an unknown pattern L to a given set of K prototypes Pk, k 2 f1:2; :::; Kg [2-4]. Each prototype Pkbelongs to
a given class Cm, m 2 f1; 2; :::; Mg, which is specied
by the indicator function Ak:
Ak = lm; if Pk belongs to the mth class lm: (1)
Let S(L; Pk) be a similarity measure which measures
the degree of similarity, or compatibility, between the unknown pattern L and the kth prototype Pk. Then,
formally we may write the process of classifying or
1. Department of Information Technology, School of Engi-neering, Tarbiat Modares University, P.O. Box 14115-179, Tehran, Iran.
*. Corresponding author. E-mail: montazer@modares.ac.ir Received 27 September 2009; received in revised form 25 May 2010; accepted 23 August 2010
assigning the unknown pattern L to the class l= Ak,
where
%
k= arg max
k (S(L; Pk)): (2)
The pattern recognition problems could be found in many scientic disciplines [5-7], and are considered as one of the most applicable topics in engineering [8-10]. On the other hand, several evidential measures have been proposed so far, which use basic belief assignment function as a basis in classication [11-18], whereas in evidence theory literature, there is no work which relies mainly and directly on the belief intervals in this regard. The belief interval comprised of belief and plausibility functions constitutes all the knowledge available in the problem for a proposition, regardless of baseless assumptions [19]. Hence, using belief intervals leads us to an approximate reasoning approach which is more accurate than other methods. In this paper, a novel evidential distance measure based on nearest neighborhood concept is proposed. Our goal is to develop an approach of approximate reasoning in which
uncertain feature vectors and samples are classied according to existing knowledge and partial truth while considering problem uncertainty. In this approach, we rst acquire basic belief assignments for the proposi-tions, and then construct the belief and plausibility functions or the belief intervals. This procedure is done for all the attributes, so as we have a feature vector of belief intervals for the attributes. On the other hand, the appropriate feature vector of belief intervals for the classes can be built on several mechanisms such as investigations, observations, expertise etc. Then, applying the proposed evidential distance, we could identify the most similar class to each unknown pattern according to nearest neighborhood concept. Also, this evidential distance is applied to two medical diagnosis problems, and the acquired results are compared with other evidential measures.
This paper is organized as follows: In the next section, the fundamental notions of evidence theory are presented briey. Besides, the evidential distance measures in Dempster-Shafer theory literature are discussed. Also, a new evidential distance measure is proposed which relies mainly on belief intervals. Then, we apply the proposed measure to the bacillus colonies recognition and coronary heart disease patients classication problems, and the experimental results are illustrated and compared with other evidential measures in the last section.
DEMPSTER-SHAFER EVIDENCE THEORY Evidence theory was rst introduced by Dempster in 1968 [20]. Later, it was rened and further de-veloped by Shafer in 1976 [21]. Also, Smets intro-duced Transferable Belief Model (TBM) which extends Dempster-Shafer model to represent nonprobabilistic beliefs [22,23].
Evidence theory starts by dening a frame of discernment that is a set of mutually exclusive \elemen-tary" propositions. The nest subdivision of the set is considered as the elementary proposition. Therefore, the frame of discernment denoted by or X consists of all elementary propositions [24].
In evidence theory, the basic propagation of in-formation is through Basic Belief Assignment (BBA) function [19]. BBA expresses our degree of belief in a proposition. It is determined by various forms of information: sources, experimental methods, quantity and quality of information, experts' opinions and so on. BBA is assigned by making use of a mapping function (m) in order to express our belief in a proposition with a number in the unit interval [0,1], as shown below
%
m : 2! [0; 1]: (3)
This measure m (the basic belief assignment function)
must satisfy the following three properties
%
i. m(A) 0 for any A 2 2; (4)
ii. m() = 0; (5)
iii. X
A22
m(A) = 1: (6)
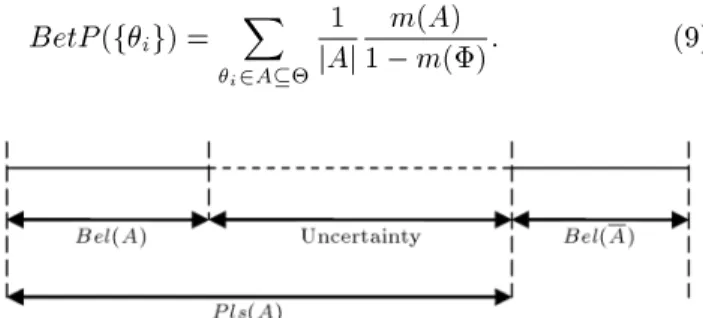
After assigning the basic belief degrees to the propo-sitions, we can proceed to determine the belief and plausibility functions. Due to a lack of information, it is more reasonable to present bounds for the result of uncertainty quantication as opposed to a single value of belief. Our total degree of belief in a proposition \A" is expressed within an interval, [Bel(A); P ls(A)], called the Belief Interval (BI) [19], which lies in the unit interval [0,1], as shown in Figure 1, where Bel and Pls functions are explained forth.
The lower bound, Belief (Bel), also known as Support (Sup), for a set A is dened as the sum of all the basic belief assignments of the proper subsets Ciof
the set of interest A, i.e., Ci A. The general relation
between BBA and belief functions can be written as: Bel(A) = X
CiA
m(Ci): (7)
It can be shown that Bel() = 0 and Bel() = 1. The upper bound, Plausibility (Pls), is the sum-mation of basic belief assignments of the sets Ci whose
intersection with the proposition A is not an empty set, i.e. Ci\ A 6= , and therefore, it can be written as:
P ls(A) = X
Ci\A6=
m(Ci): (8)
Also, it can be shown that P ls() = 0 and P ls() = 1. In fact, every proposition that allows for the proposi-tion A to be included at least partially is considered to imply the plausibility of the proposition A.
Belief functions cannot be directly used for deci-sion making. Hence we can apply the pignistic transfor-mation: a particular mapping of a belief function m to a Bayesian belief function (probability function) BetP . The resulting pignistic probability for the singletons i2 is given by [5]:
BetP (fig) =
X
i2A
1 jAj
m(A)
1 m(): (9)
In a sense, belief and plausibility measurements rep-resent lower and upper bounds which surround the certain belief value. In other words, the Belief Interval (BI) is an interval between belief and plausibility func-tions representing range in which exact belief resides. A narrow belief interval represents more precise beliefs. It can be shown that the belief is uniquely determined if Bel(A) = P ls(A). If BI(A) has an interval [0,1], it means that no information about hypotheses is available; on the other hand, if the interval is [1,1], it means that A has been completely conrmed.
Therefore, the degree of uncertainty which is the dierence between belief and plausibility functions becomes smaller as we obtain more information and knowledge. Even though evidence theory does not give us a single value, the given belief interval [Bel; P ls] retains all the information without any excessive and baseless assumptions. That is, the result of evidence theory is consistent with given partial truth, and therefore leads us to approximate reasoning. Since the belief interval represents the current uncertainty situation based on available evidence, a decision maker can obtain insight into the problem and avoid mistakes made by misusing assumptions [25].
Evidential Distance Measures
Several works could be found in the literature which tried to propose distance measures through the evi-dence theory framework [11,12,14-16,18]. In the Ev-idential Distance-based Classier (EDC) proposed by Denoeux [12], k-NN classication rule is addressed from the point of view of Dempster-Shafer theory. This evidence-theoretic k-NN rule considers each neighbor of a sample to be classied as an item of evidence that supports certain hypotheses regarding the class membership of that sample. The degree of support is dened as a function of the distance between the two feature vectors. Also, a learning algorithm was proposed by Zouhal and Denoeux [26] for determining the parameters of the proposed approach equation to reduce the classication errors. Denoeux argued that unknown samples can also be classied according to their distances to a limited number of reference patterns through multi-layer neural network to reduce computation time [13]. A characteristic of this ap-proach resides in the possibility of taking into account partial knowledge of the class of training samples [27]. In this way, a Euclidean measure for the evidence theory has been proposed as follows:
d(m(A); m(B)) = X
A2Fi
X
B2Fj
mi(A)mj(B); (10)
where Fi is the set of all focal elements of mi.
Another evidential measure has been represented by
Tessem [18]: The error due to an approximation of BBAs is quantied by the maximal deviation in the pignistic probabilities before and after approximation, so as we have:
d(i; j) = max
l jBetPi(l) BetPj(l)j ; (11)
where BetPi is the pignistic probability corresponding
to BBA mi.
Bauer [11], on the same problem, introduced two other measures of error to reect the quality of a decision based on the pignistic probability distribution after approximation. The idea to dene a measure on the power set has been used by Petit-Renaud, where an error criterion between two belief structures based on the generalized Hausdorf distance has been dened [15].
Also, Denoeux introduced the Interval-valued Be-lief Structures (IBS) allowing to model the situation in which hypotheses may only be expressed with some imprecision [28]. Actually, IBS copes with imprecision in the belief value itself attached to each hypothesis which is only known to lie within a certain interval. Using the theory of fuzzy sets as a very ecient tool for representing the vague quantities, belief values could also be expressed as fuzzy numbers, so called fuzzy-valued belief structures [29].
Jousselme et al. [15] apply a classical similarity measure to achieve the comparison of the focal elements of two BBAs, in order to dene a distance in a vector space generated by the focal elements. This distance is then used as a measure of performance of dierent algorithms and helps evaluate how fast they converge to the desired known solution. A BBAi can be seen
as a vector m!i in the mentioned vector space and the
normalized distance is a function
%
d(m!1;m!2) =r 1 2(
!
m1;m!2)TS=(m!1;m!2); (12)
where S
= is a similarity matrix between the focal
ele-ments lled by the application of the Jaccard measure between the corresponding subsets. Also, another way to write Equation 12 is:
d(m!1;m!2)=
r 1 2
!
m12+m!22 2
D! m1;m!2
E ; (13) whereDm!1;m!2
E
is the scalar product dened by: D!
m1;m!2
E =
2N
X
i=1 2N
X
j=1
m1(Ai)m2(Aj)jAjAi\ Ajj
i[ Ajj; (14)
where Ai; Aj 2 P () for i; j = 1; :::; 2N. m!2 is then
!m2=Dm;! m!E: (15)
A popular approach has been to take the conict of two Basic Belief Assignments (BBAs) as an indication of the belief that they do not belong to a same class, and then assume it as a measure of dissimilarity or distance between them. Schubert [17] presents a clustering of BBAs based on a measure of conict, resulting from the aggregation of the BBAs members of the cluster using Dempster's rule of combination. This measure gives an indication of how likely it is that they belong to the same class or not. The conicts from each cluster are then combined to nd the overall meta-conict of the partition. The clustering algorithm minimizes the metaconict to obtain the most credible partition of the pieces of evidence. Once the clusters are dened, a BBA prototype is found among members of each cluster by analyzing the evolution of the cluster's conict when removing each BBA. These prototypes can be then used to classify new samples to the cluster whose prototype has the smaller conict with.
Also, another distance measure is Bhattacharya distance [14,16] which is dened in probability theory as:
dB(p1; p2) = ln
Z
x
p
p1(x)p2(x)dx
; (16)
where p1, p2represent the probability density functions
of vector x of any dimension. This measure has the advantage that is designed to compare features for the two classes. It is a special case of the Cherno bound of the error probability in binary classication [30]. It is well known that the Cherno information gives the highest achievable exponent for the error probability. The Bhatacharya distance has the symmetric property, (d(p1; p2) = d(p2; p1)). The triangle property is only
satised for specic congurations. Also, the discrete expression of Equation 16 is:
dB(h1; h2) = ln
X
i
p
h1(i)h2(i)
!
; (17)
where i is an index of the bins of the normalized histograms h1 and h2. Also, Bhattacharya distance
denition in evidence theory [16] is as follows: d(mi; mj) =
v u u
t1 X
A2Fi
X
B2Fi
q
mi(A)mj(B)
! ;
(18) where Fi is the set of all focal elements of mi. Diaz
et al. [14] proposed a similarity measure between the focal elements, making way for the application of classical classication algorithms in this eld. The properties of this measure are particular to its context, considering the characteristics of the focal elements,
their relationship with each other and their proximity to the vacuous belief function that represents the state of total ignorance.
Another evidential measure has been proposed by Ristic and Smets [16] which derives the global cost of assignment (i.e. a dissimilarity measure) based on the plausibility of the global assignment. This measure is directly related to the conict as described in the TBM. The plausibility of the global assignment V is given by:
P l2n
((o1i) = (o2i) : i = 1; 2; :::; n) = n
Y
i=1
1 m
1i2i(); (19)
where o1and o2represent bodies of evidence, the null
set, and combination of the basic belief assignments or the global assignment. Also, they dened an additive global dissimilarity measure of an assignment as follows:
D = loghP l2n
((o1i) = (o2i)) : i = 1; 2; :::; n
i
=Xn
i=1
dii; (20)
where:
dij = log(1 m1i2j()): (21)
A NEW EVIDENTIAL DISTANCE MEASURE BASED ON THE BELIEF INTERVALS
In the real world problems, usually several features, components or criteria inuence the problem, and play important roles in proposing a solution, whereas each of them may be uncertain [31]. For instance, a cardiologist has to consider several medical markers to assess the Coronary Heart Disease (CHD) risk in the patients, whereas each marker indicates CHD occurrence risk with uncertainty. Therefore, it is more intuitive and reasonable to exploit the evidence theory and construct a belief interval through determining the belief and plausibility functions.
In this paper, we propose a new evidential dis-tance measure based on belief intervals. This mea-sure presents the distance between belief intervals associated to the imprecise unknown patterns and classes. In other words, this measure is based on the dierence between the analogous features' belief intervals which are assigned to unknown patterns and classes. Hereafter, we refer to this measure by the name of Belief Interval Distance (BID). In doing so, we develop an approach of approximate reasoning in which uncertain feature vectors are classied according to
existing knowledge and partial truth while considering problem uncertainty.
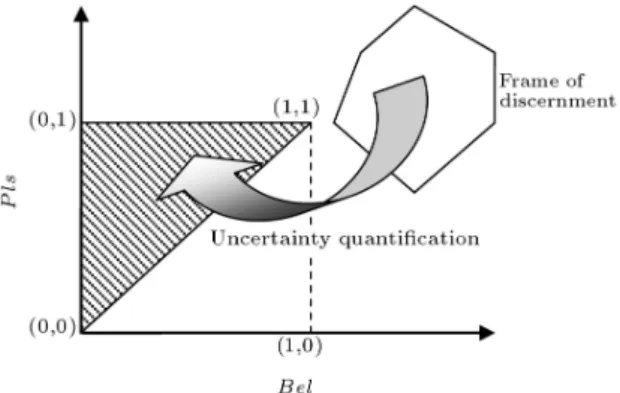
A convenient geometrical representation of the be-lief interval can be employed to illustrate this distance. As mentioned before, all the propositions are sur-rounded in the frame of discernment and after assigning BBAs, we quantify problem uncertainty through belief and plausibility functions which leads to the belief interval. This process could be expressed through a geometrical interpretation. We can assume a frame of discernment M and subset N in the Euclidean plane with the Cartesian coordinates. For a given belief interval, BI, a function f from M to N can be constructed, such that if x 2 M, then:
p = f(x) 2 N;
and the point p 2 N has the coordinates x 2 M ha; bi for which:
0 a; b 1; where:
a = Bel(x) and b = P ls(x):
In fact, function f quanties the problem uncertainty and assigns the appropriate values to the belief and plausibility functions, in other words, constructs the belief interval. As illustrated in Figure 2, this geomet-rical interpretation maps the frame of discernment as a polygon to the belief interval territory represented in a triangle area.
Now, we suggest an exact form of the belief interval which comprises of belief and plausibility func-tions, beside of uncertainty quantity which represents the status of problem uncertainty in each situation. Despite belief and plausibility functions could be used to reect the uncertainty, none of them could express the uncertainty alone. Besides, we found that using three coordinates lead to better results in pattern recognition. Thus, the exact belief interval has three coordinates as follows: < Bel; P ls; Uncer >. Hence, the most natural representation of a belief interval is
Figure 2. A geometrical interpretation of a belief interval.
Figure 3. A three-dimensional representation of a belief interval.
to draw a cube with edge length equal to 1, as shown in Figure 3, so as triangle ABD represents a typical belief interval. This representation of a belief interval is used to investigate the belief interval distance.
To lighten up this geometrical interpretation, let us consider a conceptual instance which concerns comparing the opinions of several experts regarding a hypothesis. These experts described their beliefs concerning dierent perspectives of the hypothesis, and after uncertainty quantications based on their beliefs, the belief intervals for each of them were formed. Each expert i is represented as a point having coordinates < Bel; P ls; Uncer >. Expert C: < 1; 1; 0 > fully accepts the discussed hypothesis. Expert A: < 0; 0; 0 > fully rejects it. The experts on the segment AC xed their points of view. In fact, their uncertainty measure equal zero, so that each expert is convinced to the belief Beli. Also, expert B: < 0; 1; 1 > is absolutely
uncertain, whereas expert C: < 1; 1; 0 > is absolutely conrmed that the hypothesis is true and expert A: < 0; 0; 1 > believes it is absolutely false. An orthogonal real representation of a belief interval has been show in Figure 4.
A line parallel to AC describes a set of experts with the same level of uncertainty. For instance, two sets are presented with uncertainty level equal to U1
Figure 4. An orthogonal projection of the real representation of a belief interval.
and U2 where U2 > U1. In other words, the triangle
ABC in Figure 4 is an orthogonal projection of the real situation, i.e. the triangle ABD in Figure 3.
Now, the belief interval distance is proposed using the Hamming distance measure. Instead of using 1-D Hamming distance to measure the dierence between two analogous crisp values, the dierences between two intervals besides their uncertainty quantities have been measured through 3-D Hamming distance, so that the dierences between two belief functions, two plausibility functions, and also two uncertainty quantities of both intervals are computed analogously. To formulate the distance, we depict it through the following denition:
Let A and B be two belief intervals associated to a class and unknown pattern, respectively. The Belief Interval Distance (BID) is dened as follows:
BID(A; B) = 1
2 X
Ai;Bi
0
@ jBel(AjP ls(Aii) Bel(B) P ls(Bii)j +)j + jUncer(Ai) Uncer(Bi)j
1
A ; (22) where Aiand Bidenote components (such as features)
of A and B, respectively. This denition satises the appropriate properties of a distance metric which is proved in following.
Proof
The belief interval represents the upper and lower bounds which surround the certain belief value. Es-sentially, if we could not represent the belief associated to a proposition as a certain value, it is more intuitive to express the belief through an interval. Hence, the belief interval implies a certain belief value. With attention to this point and its geometric interpretation, measuring the distance between two belief intervals could be considered as the distance between two values which are represented through intervals.
The proposed evidential distance must satisfy four properties to be a distance metric and show its validity. The proposed distance is a function that satises the following properties for any belief intervals A and B
%
I. Non-negativity: BID(A; B) 0: Because:
jAj 0 ! BID (A; B) 0: II. Nondegeneracy:
BID(A; B) = 0 , A = B;
A = B $ Bel(A) = Bel(B); P ls(A) = P ls(B);
and:
Uncer(A) = Uncer(B): So:
BID(A; B) = 1
2
jBel(A) Bel(B)j+jP ls(A) P ls(B)j+ jUncer(A) Uncer(B)j
= 0;
and vice versa. III. Symmetry:
BID(A; B) = BID(B; A); BID(A; B)
= 1 2
jBel(A) Bel(B)j+jP ls(A) P ls(B)j+ jUncer(A) Uncer(B)j
= 12
jBel(B) Bel(A)j+jP ls(B) P ls(A)j+ jUncer(B) Uncer(A)j
= BID(B; A): IV. Triangle inequality:
BID(A; B) BID(A; C) + BID(C; B); 8C 2 [0; 1];
because of:
jA Bj jAj + jBj ; BID(A; C) + BID(C; B)
= 1 2
0 B B B B @
jBel(A) Bel(C)j+jP ls(A) P ls(C)j + jUncer(A) Uncer(C)j
+
jBel(C) Bel(B)j+jP ls(C) P ls(B)j !+ jUncer(C) Uncer(B)j
1 C C C C A
12 0 B B @
jBel(A) Bel(C) (Bel(C) Bel(B))j+ jP ls(A) P ls(C) (P ls(C) P ls(B))j+ jUncer(A) Uncer(C)
(Uncer(C) Uncer(B))j
1 C C A
= 12
jBel(A)+Bel(B)j+jP ls(A)+P ls(B)j+ jUncer(A)+Uncer(B)j
1 2
jBel(A) Bel(B)j+jP ls(A) P ls(B)j+ jUncer(A) Uncer(B)j
So, we have:
BID(A; B) BID(A; C) + BID(C; B): Example 1
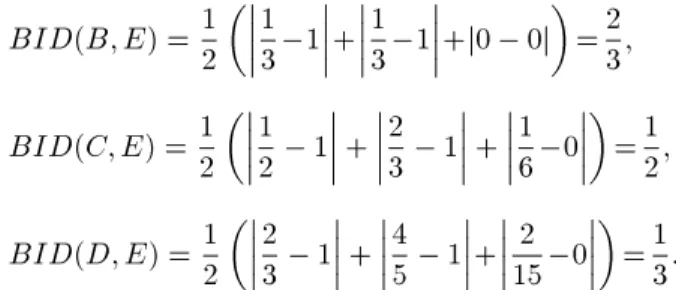
Let us consider the belief intervals A; B; C; D and E as follows:
A = (0; 0); B = (1=3; 1=3);
C = (1=2; 2=3); D = (2=3; 4=5); E = (1; 1): The geometrical interpretation of these belief intervals is shown in Figure 5.
Let us calculate the BID distance between the belief intervals based on Equation 22:
BID(B; E) =1 2
13 1+1 3 1
+j0 0j=2 3; BID(C; E) = 1212 1 +23 1 +16 0
=12; BID(D; E) = 1223 1 +45 1+152 0
=13: As we expected intuitively, these distances are de-scribing the real dierences between the belief inter-vals. For instance, the distance between B and E is greater than the one between D and E, as Figure 5 implies.
NUMERICAL EXPERIMENTS
In this section, we apply the proposed evidential distance measure in two medical diagnosis problems to examine its capability in pattern recognition. Also, the acquired results are compared with the other evidential measures. For this purpose, the performance of the proposed method is evaluated using classication
Figure 5. A geometrical interpretation of the belief intervals considered in Example 1.
accuracy, sensitivity and specicity [32], so as their representations in medical diagnosis are:
Accuracy = # true positives + # true negative # all patients ;(23) Sensitivity = # true positives
# all patients with the disease; (24) Specicity = # all patients without the disease# true negatives :
(25) The true positives are all patients with the disease and positive test result, whereas the true negatives are all patients without the disease and negative test result. We use the accuracy, sensitivity and specicity to perform ROC analysis. ROC (Receiver Operating Characteristic) graphs have long been used in signal detection theory to depict tradeos between hit rate (sensitivity) and false alarm rate (1-specicity) [32]. ROC analysis has lately been extended for use in vi-sualizing and analyzing the behavior of diagnostic sys-tems, and is used for visualization in medicine, where specicity-sensitivity relations are often analyzed. In the usual setting, the machine learning algorithms are tuned to maximize classication accuracy. In our case, the sensitivity and specicity are more important. The clinicians especially wanted to see if it is possible to increase the specicity of the diagnostic process without aecting the sensitivity too much (this may lead to the reduction of number of patients that are being unnecessarily submitted to invasive preoperative examinations). It must be noted that the ROC analysis is only used in two-class classications, so as multiclass problems cannot be analyzed through it. In analyzing a classier through ROC graph, we should note that by giving samples from the negative class higher scores, a good classier should become more specic and less sensitive. On the other hand, by giving examples from the positive class higher scores, a good classier should become more sensitive and less specic. In fact, a good classier ROC curve takes place in upper left corner of chart, so as the more upper-left the ROC graph, the more accurate the recognition rate.
BID Application in Bacillus Colony Recognition
Microbiologists broadly classify bacteria according to their shapes [33-35]. Most bacteria come in one of three shapes: rod, sphere or spiral. Rod-shaped bacteria are called bacilli, Spherical bacteria, cocci, and spiral or cockscrew-shaped bacteria are called spirilla, too. Bacteria may be further classied according to whether they require oxygen (aerobic or anaerobic) and how they react to a test with Gram's stain. Bacteria in
which alcohol washes away Gram's stain are called Gram-negative, while bacteria in which alcohol cause the bacteria's wall to absorb the stain, are called Gram-positive [33,34]. As noted before, bacillus is a rod-shaped bacterium which is active only in the presence of the oxygen (aerobic bacterium). Bacilli occur mainly in chains, produce spores, and include many saprophytes, some parasites and the bacterium that causes anthrax [36]. In this research, four intestinal bacilli named \Shigella, Salmonella, Bacillus coli and Klebsiella" are considered which have some similarity in culture medium and are Gram-negative.
Shigella [36] is a rod-shaped Gram-negative bac-terium (bacillus) that lives in the intestinal tracts of human beings and animals and causes bacillary dysentery. There are four species, all causing dysentery but with varying degrees of severity. Salmonella [36] is also a rod-shaped bacterium found in the intestine that can cause food poisoning, gastroenteritis and typhoid fever. Other two bacilli considered herein Klebsiella and Bacillus coli are also Gram-negative and found in the intestine. Primal features used for these bacilli classication comprise of macro shape which is domical in these four bacillus colonies, single microscopic shape, double microscopic shape and existence of agellum. Our target is to use the proposed evidential distance to recognize the bacillus type of the samples.
To confront this problem using BID measure, the next steps were followed. First, a data set consisted of 283 samples of dierent bacillus colonies were obtained from microbiology section of Resalat
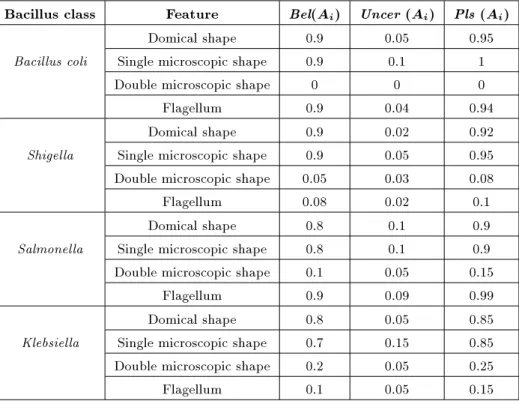
Laboratory in Tehran, Iran. Then, the basic belief assignment formulation has been performed by the medical experts, so as we rely mainly on the knowledge and expertise of the microbiologists. Consequently, the belief and plausibility functions were acquired. Hence, the bacillus patterns' features were expressed in the belief intervals. Second, we pursued to determine each class's feature vector which depict the relationship between the bacillus type and four features, as shown in Table 1. In fact, the classes are constructed based on the beliefs acquired from the microbiologists' medical knowledge and expertise.
To classify each unknown sample, we used BID distance. In fact, a sample's distances opposing four classes were calculated using BID distance measure. Having compared four BID distance values acquired, according to nearest neighborhood concept, the class which has the smallest BID distance to the unknown sample is chosen as the appropriate class for the sample. To review the recognition process, an example is denoted. According to the four bacillus colonies patterns exhibited in Table 1, the following classes are depicted:
Bacillus coli =
f(0:9; 0:95; 0:05); (0:9; 1; 0:1); (0; 0; 0); (0:9; 0:94; 0:04)g; Shigella =
f(0:9; 0:92; 0:02); (0:9; 0:95; 0:05); (0:05; 0:08; 0:3); (0:08; 0:1; 0:02)g;
Table 1. Imprecise feature vectors of four classes (patterns).
Bacillus class Feature Bel(Ai) Uncer (Ai) Pls (Ai)
Domical shape 0.9 0.05 0.95 Bacillus coli Single microscopic shape 0.9 0.1 1
Double microscopic shape 0 0 0 Flagellum 0.9 0.04 0.94 Domical shape 0.9 0.02 0.92 Shigella Single microscopic shape 0.9 0.05 0.95 Double microscopic shape 0.05 0.03 0.08 Flagellum 0.08 0.02 0.1 Domical shape 0.8 0.1 0.9 Salmonella Single microscopic shape 0.8 0.1 0.9 Double microscopic shape 0.1 0.05 0.15
Flagellum 0.9 0.09 0.99 Domical shape 0.8 0.05 0.85 Klebsiella Single microscopic shape 0.7 0.15 0.85 Double microscopic shape 0.2 0.05 0.25 Flagellum 0.1 0.05 0.15
Table 2. Classication result using BID distance versus microbiologists opinions. S. No. Bacillus coli Shigella Salmonella Klebsiella Microbiologists
S1 0.306 1.247 0.357 1.357 Bacillus coli
S2 0.520 1.293 0.405 1.273 Salmonella
S3 1.444 0.575 1.444 0.568 Shigella
S4 1.421 0.558 1.250 0.274 Klebsiella
S5 0.282 0.986 0.350 1.177 Bacillus coli
S6 1.311 0.563 1.227 0.655 Shigella
S7 0.413 1.086 0.408 1.242 Bacillus coli
S8 1.500 0.597 1.242 0.310 Klebsiella
S9 1.166 0.336 1.15 0.470 Shigella
S10 0.354 1.144 0.401 1.414 Bacillus coli
Salmonella =
f(0:8; 0:9; 0:1); (0:8; 0:9; 0:1); (0:1; 0:15; 0:05); (0:9; 0:99; 0:09)g; and
Klebsiella =
f(0:8; 0:85; 0:05); (0:7; 0:85; 0:15); (0:2; 0:25; 0:05); (0:1; 0:15; 0:05)g:
If we consider a sample A = f(0:8; 0:9; 0:1); (0:95; 1; 0:05); (0; 0; 0); (1; 1; 0)g; based on Equation 22, we have:
BID(A; Shigella)
=12 8 > > > > > > < > > > > > > :
j0:8 0:9j + j0:1 0:02j + j0:9 0:92j + j0:95 0:9j + j0:05 0:05j + j1 0:95j + j0 0:05j + j0 0:03j + j0 0:01j + j1 0:08j + j0 0:02j + j1 0:1j
9 > > > > > > = > > > > > > ;
= 1:15:
Also, For other three classes, similar calculations are performed which lead to:
BID(Bacilluscoli; A) = 0:25; BID(Salmonella; A) = 0:4; BID(Klebsiella; A) = 1:45:
From the above results, it is evident that sample A has the less distance or the most similarity to Bacillus coli pattern, and therefore is classied as a Bacillus coli colony.
After testing phase completion, all the unknown patterns were classied. The nal results of classica-tion have been checked with microbiologists' opinions.
Table 2 summarizes the classication result of ten samples which are compared with the microbiologists' opinions, where the shaded cells indicate the appro-priate class of the sample based on the BID distance measure.
Having compared all the classied samples with medical experts' ideas, we observed that 91.66 percent of the unknown samples have been classied correctly. For the current research data set, the following num-bers of cases have been identied correctly through BID evidential distance: Bacillus coli 34
40, Shigella 36
40, Salmonella 2020 and Klebsiella 2020. Also, the error
intervals of misclassied unknown patterns of Bacillus coli and Shigella classes reside in the following intervals, respectively: [0.01,0.18] and [0.01,0.09]. The bacillus recognition using the BID distance for a number of samples is represented in Figure 6 in which the most similar class has obtained a lower rank, meanwhile compared with the microbiologists' opinions.
As shown in Figure 6, the belief distance measure has been applied for each of the samples, so as its similarity to each of the classes has been assessed via
Figure 6. Bacillus colonies recognition using BID measure compared with microbiologists' opinions.
Table 3. Comparison between BID measure and other evidential measures in bacillus colonies recognition. Measure BID Bahatacharya Euclidean Tessem Jousellme et al. Ristic and Smets Accuracy rate 91.66% 48.33% 16.66% 76.66% 85.00% 16.60%
determining their distances to the classes. In this way, acquiring the least distance to a class means that the sample belongs to that class. Also, the microbiologists' opinions are represented in this gure which shows the high conformance of the proposed measure with real classications. The other evidential distance measures were applied to the bacillus colonies recognition. Joussellme et al.'s measure [15] could distinguish 85 percent of the samples properly, while Bahatacharya [14,16], Euclidean [27] and Tessem [18] evidential distance measures provided us with 48.33%, 16.66% and 76.66% accuracy rates in recognition. Also, Ristic and Smets measure [16] yielded weak recognition rate of 16.6% in this problem. Table 3 compares the BID distance measure result with the other evidential measures results in bacillus colonies recognition. BID Application in Coronary Heart Disease Patients Classication
Coronary heart disease is an important disease in heart medicine, so as we observe proliferation in CHD occurrence in humanity, nowadays, because of machine presence in various aspects of human being life which is along with obesity and psychological diseases such as depression. Annually, twelve million people around the world die because of heart disease and it is predicted that cause of 75 percent of mortalities in 2020 will be these diseases [37]. Recently it is announced that 317 people die in Iran daily because of coronary and heart diseases among which 47% are young [38].
Coronary heart disease is a chronic disease in which the coronary arteries, responsible for transport-ing oxygenized blood to heart muscles, get narrowed and are not able to convey enough fresh blood to this bloodpumping organ [39]. Often, narrowing of blood vessels is because of arteriosclerosis that is a common arterial disease in which raised areas of degeneration and cholesterol deposit plaques form on the inner sur-faces of the arteries obstructing blood ow. When the blood supply of the heart is reduced, it does not receive enough oxygen and nutrition to operate properly. This oxygen shortage leads to two important and critical results: angina pectoris and heart attack [40].
CHD patients classication assists the physicians to identify the patients with low and high CHD risk, and in this way control CHD progress in the appro-priate patients [41]. One of the best and common ways of the CHD patients classication is to investigate CHD medical markers or risk factors [42]. In fact, physicians through studying the CHD medical markers
in their medical research can diagnose this disease before being acute. Most important CHD medical markers are total cholesterol, systolic and diastolic blood pressures, highdensity cholesterol, age, smoking and diabetes mellitus [42]. In this section, we want to apply the BID distance measure to classify the patients into two classes: healthy and unhealthy, in association to CHD.
After a survey study on the heart and CHD liter-ature, it was found that various researches are done on CHD risk factors and medical markers, so as they could determine each marker's eect on the CHD occurrence. With reviewing these sources and interviewing with heart disease experts, the key medical markers aecting CHD were obtained [42]. After studying heart and CHD literature, importance and aection degree of the medical markers on CHD occurrence were acquired. It is worthy to note that none of the markers imply the CHD occurrence certainly and we observe uncertainty in the relation between the medical markers and CHD occurrence. To represent the relations between the markers and CHD risk, Framingham heart study [42] has been used, so as 28 association rules were extracted which models the uncertainty in the CHD occurrence, according to the respective markers, as shown in Table 4.
Taking into account the base patterns or classes for healthy and unhealthy people in association to coronary heart disease, the unknown patterns are classied using evidential distance measures. For this purpose, we acquired the feature vectors of healthy and unhealthy people from Framingham heart study [42]. Then, the BBAs for the unknown feature vectors of patients were assigned according to Table 4. Having applied the dierent evidential distance measures to the unknown patterns brought us their respective distances to healthy and unhealthy classes which were used as criteria to classify people in the classes, so as less distance to a class implies assignment to that class. Having applied the BID distance measure to the Hungarian institute of cardiology's heart disease data set in the university of California, Irvine's machine learning repository [43] comprised of 294 samples, the acquired CHD patients classication results were compared with the real diagnoses, so as it was found that the proposed measure could classify the samples with 92.54% accuracy rate.
Also, Jousellme et al. measure [15] yielded a classication with the same accuracy rate, while Ba-hatacharya [14,16] provided us the weak recognition rate of 29.24%. Besides, Euclidean [27], Tessem [18]
Table 4. Coronary heart disease medical markers and their basic belief assignments in CHD occurrence.
Medical Markers
Reference Range
CHD Occurrence
BBA 30-34 0 35-39 0 40-44 0.02 45-49 0.05 Age 50-54 0.09 55-59 0.13 60-64 0.18 65-69 0.23 70-74 0.27 <160 0 160-199 0 Total cholesterol 200-239 0.03
240-279 0.07 >280 0.12 Smoking No 0
Yes 0.09 <35 0.08 High density 35-44 0.04 cholesterol (HDL) 45-49 0.01 50-59 0
>60 0 Diabetes mellitus No 0 Yes 0.07 Systolic Diastolic
<120 <80 0 Blood pressure 120-129 80-84 0 130-139 85-89 0.03 140-159 90-99 0.05 >160 >100 0.11
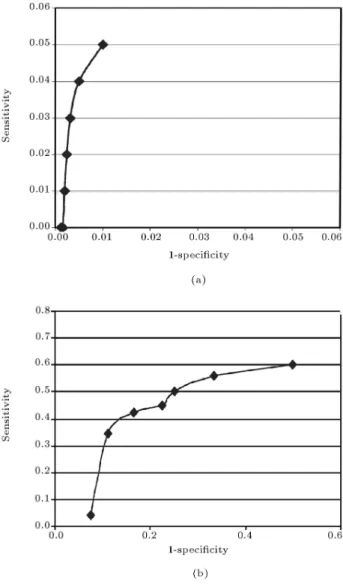
and Ristic and Smets [16] evidential distance measures could distinguish 91.5%, 88.67% and 91.5% of the samples correctly, respectively. Since this problem is twoclass classication, we could apply ROC analysis. For this purpose, sensitivity and specicity of the BID measure were acquired, as shown in Figure 7. As this gure shows, the BID's ROC graph takes place in the upper left corner that implies its great capability in classication, while Tessem measure ROC graph is nearly in middle of the chart. Also, ROC graph of Joussellme et al. measure is nearly the same as BID measure which implies its good capability in classication too. Table 5 compares the BID distance
Figure 7. ROC analysis of evidential distance measures. a) BID distance measure; b) Tessem distance measure.
measure result with the other evidential measures in coronary heart disease patients classication.
Also, the BID measure experimental results in CHD patients classication have been compared with the similar researches, as shown in Table 6, which implies the proposed measure encounters the problem more eciently. In one of these researches, various machine learning methods such as Bayesian classi-cation and neural networks have been applied to the heart diseases diagnoses [32], so as the accuracy rate of 80% has been reported for coronary heart diseases diagnoses based on the appropriate medical markers. In another research, neural networks have been used for recognizing the coronary heart diseases, so as the designed neural network could identify 84% of the CHD
Table 5. Comparison between BID measure and other evidential measures in CHD patients classication. Measure BID Bahatacharya Euclidean Tessem Jousellme et al. Ristic and Smets Accuracy rate 92.45% 29.24% 91.5% 88.67% 92.45% 91.50%
Table 6. Comparison between the proposed measure outcome and the similar researches. No. Research Methods Accuracy Rate (%)
1 Kukar et al. [32] Bayesian classication and neural network 80 2 Akay [44] Neural network 84 3 Haddad et al. [45] Neural network 48 4 Detrano et al. [46] Probability theory (logistic regression) 77 5 Proposed measure Evidence theory 92.45
occurrence in the patients [44]. Also, a research has been exploited the heart rate study using the neural networks which only could identify 48% of the disease in the patients [45]. Besides, the acquired result of the proposed evidential distance measure has been compared with the similar researches applied to the same data set among which we can mention Detrano et al. [46] and Gennari et al. [47] that yielded 77 and 78.9 percent accuracy rates, respectively.
CONCLUSION
The evidential measures proposed so far rely on the basic belief assignment function and do not exploit the belief intervals directly, whereas the belief interval could depict all the knowledge available regarding a pattern's feature. This paper proposed a new evidential distance measure based on the belief interval. Having obtained the belief and plausibility functions or the be-lief interval, the distance between the bebe-lief intervals of uncertain classes' pattern feature vectors and unknown patterns are calculated, so as the classication could be take place according to nearest neighborhood concept. This evidential distance measure can be used in classication for imprecise and uncertain feature vectors with a realistic look at problem uncertainty. In the proposed approach, we rst construct the belief intervals, and then examine the similarity between an unknown pattern and the classes based on the belief interval distance measure. As practical applications of proposed distance measure in classication, it was applied to the bacillus colony recognition and coronary heart disease patients classication. Experimental results showed that the proposed distance provided us with 91.66 and 92.54 percent accuracy rates in these applications, respectively. Comparison the acquired results with other evidential measures results depicts the proposed measure superior performance.
ACKNOWLEDGMENTS
The authors would like to thank Ms. Hoda Davarzani, the Ph.D. student at the Tarbiat Modares University, Tehran, Iran for her precious assistance in data gath-ering of their research. This work was supported by the Iran Telecommunications Research Center (ITRC), Tehran, Iran, under grant No. TMU 87-07-48.
REFERENCES
1. Han, J. and Kamber, M., Data Mining: Concepts and Techniques, Elsevier, Morgan Kaufmann, San Mateo, CA (2006).
2. Bishop, C.M., Neural Nnetworks for Pattern Recogni-tion, Oxford University Press, Oxford, England (1995). 3. Devijer, P.A. and Kittler, J., Pattern Recognition, a Statistical Approach, Prentice-Hall, London, England (1982).
4. Duda, R.O. and Hart, P.E., Pattern Classication and Scene Analysis, John Wiley, New York (2001). 5. Haji, M.M. and Katebi, S.D. \Machine learning
approaches to text segmentation", Scientia Iranica, 13(4), pp. 31-42 (2006).
6. Yazdchi, M.R. et al. \A new bidirectional neural net-work for lexical modeling and speech recognition im-provement", Scientia Iranica, 14(6), pp. 65-73 (2007). 7. Khatibi, V. and Montazer, G.A. \Intuitionistic fuzzy set application in bacteria detection", 14th Int'l Com-puter Conference of Iranian ComCom-puter Society (CS-ICC2009), Tehran, Iran (2009).
8. Khatibi, V. and Montazer, G.A. \Bacillus colonies recognition using intiuitionistic fuzzy sets", Notes on IFS, 14(2), pp. 91-99 (2008).
9. Gitizadeh, M. and Kalantar, M. \Genetic algorithm based fuzzy multi-objective approach to FACTS de-vices allocation in FARS regional electric network", Scientia Iranica, 15(6), pp. 35-42 (2008).
10. Montazer, G.A. et al. \A neurofuzzy inference engine for farsi numeral characters recognition", Expert Sys-tems with Applications, 37(9), pp. 6327-6337 (2010). 11. Bauer, M. \Approximation algorithms and decision
making in the DempsterShafer's theory of evidence -an empirical study", International Journal of Approx-imate Reasoning, 17(2-3), pp. 217 (1997).
12. Denoeux, T. \A nearest neighbor classication rule based on Dempster-Shafer theory", IEEE Transactions on Systems, Man, and Cybernetics, 25(5), pp. 804-813 (1995).
13. Denoeux, T. \A neural network classier based on Dempster-Shafer", IEEE Transactions on Systems, Man, and Cybernetics A, 30(2), pp. 131-150 (2000). 14. Diaz, J. et al. \A similarity measure between basic
belief assignments", 9th International Conference on Information Fusion, Florence, Italy (2006).
15. Jousselme, A.L. et al. \A new distance between two bodies of evidence", Information Fusion, 2, pp. 91-101 (2001).
16. Ristic, B. and Smets, P. \The TBM global distance measure for the association of uncertain combat ID declarations", Information Fusion, 7, pp. 276-284 (2006).
17. Schubert, J. \On nonspecic evidence", International Journal of Articial Systems, 8, pp. 711-725 (1993). 18. Tessem, B. \Approximations for ecient computation
in the theory of evidence", Articial Intelligence, 61(2), pp. 315-329 (1993).
19. Guan, J.W. and Bell, D.A., Evidence Theory and Its Applications, Elsevier Science Publisher B.V., Amster-dam (1991).
20. Dempster, A.P. \Upper and lower probabilities in-duced by a multivalued mapping", Annals of Math-ematical Statistics AMS, 38, pp. 325-339 (1967). 21. Shafer, G., A Mathematical Theory of Evidence,
Princeton Univ. Press, Princeton, NJ (1976).
22. Smets, P. \Belief functions; the disjunctive rule of combination and the generalized Bayesian theorem", International Journal of Approximate Reasoning, 9, pp. 1-35 (1993).
23. Smets, P. and Kennes, R. \The transferable belief model", Articial Intelligence, 66, pp. 191-243 (1994). 24. Khatibi, V. and Montazer, G.A. \Coronary heart dis-ease risk assessment using Dempster-Shafer evidence theory", 14th Int'l Computer Conference of Iranian Computer Society (CSICC2009), Tehran, Iran (2009). 25. Khatibi, V. and Montazer, G.A. \A fuzzy-evidential hybrid inference engine for coronary heart disease risk assessment", Expert Systems with Applications, 37(12), pp. 8536-8542 (2010).
26. Zouhal, L.M. and Denoeux, T. \An evidence-theoretic k-NN rule with parameter optimization", IEEE Trans-actions on Systems, Man, and Cybernetics- Part C, 28(2), pp. 263-271 (1998).
27. Denoeux, T. and Zouhal, L.M. \Handling possibilistic labels in pattern classication using evidential rea-soning", Fuzzy Sets and Systems, 122(3), pp. 47-62 (2001).
28. Denouex, T. \Reasoning with imprecise belief struc-tures", International Journal of Approximate Reason-ing, 20, pp. 79-111 (1999).
29. Denoeux, T. \Modeling vague beliefs using fuzzy-valued belief structures", Fuzzy Sets and Systems, 116, pp. 167-199 (2006).
30. Young, T. and Fu, K.S., Handbook of Pattern Recog-nition and Image Processing, Academic Press, London (1986).
31. Khatibi, V. and Montazer, G.A. \Intuitionistic fuzzy set vs. fuzzy set application in medical pattern recog-nition", Articial Intelligence in Medicine, 47(1), pp. 43-52 (2009).
32. Kukar, M. et al. \Analysing and improving the diag-nosis of ischaemic heart disease with machine learn-ing", Articial Intelligence in Medicine, 16, pp. 25-50 (1999).
33. Facklam, H. and Facklam, M., Bacteria, Twenty-First Century, Kent (1995).
34. Ricciuti, E.R., Microorganisms: The Unseen World, Blackbirch, San Diego (1993).
35. Singleton, P., Bacteria in Biology, Biotechnology, and Medicine, Wiley, Chichester (1999).
36. Sankaran, N., Microbes and People: An A-Z of Mi-croorganisms in Our Lives, Oryx, Phoneix (2001). 37. WHO \International coronary and heart diseases
re-port", Report World Health Organization (2008). 38. IMHMT \Iranian population's coronary and heart
diseases report", Report Iran's Ministry of Health and Medical Treatment, Tehran, Iran (2008).
39. Simon, S., The Heart: Our Circulatory System, Mor-row Junior (1996).
40. McGoon, M.D., Mayo Clinic Heart Book, William Morrow (2000).
41. McMahan, C. et al. \Risk scores predict atherosclerotic lesions in young people", Arch Intern Med, 165, pp. 883-890 (2005).
42. Wilson, P. et al. \Prediction of coronary heart disease using risk factor categories", Circulation, 97, pp. 1837-1847 (1998).
43. Janosi, A. University of California, Irvine; Machine Learning Repository; Heart Disease Data Set; Hungarian Institute of Cardiology's Heart Disease Data Set. 1988 [cited; Available from: http://archive. ics.uci.edu/ml/machinelearning-databases/heart-disease/.]
44. Akay, M. \Noninvasive diagnosis of coronary artery disease using a neural network algorithm", Biological Cybernetics, 67, pp. 361-367 (1992).
45. Haddad, M. et al. \Feasibility analysis of a casebased reasoning system for automated detection of coronary heart disease from myocardial scintigrams", Articial Intelligence in Medicine, 9, pp. 61-78 (1999).
46. Detrano, R. et al. \International application of a new probability algorithm for the diagnosis of coronary artery disease", American Journal of Cardiology, 64, pp. 304-310 (1989).
47. Gennari, J.H. et al. \Models of incremental con-cept formation", Articial Intelligence, 40, pp. 11-61 (1989).
BIOGRAPHIES
Vahid Khatibi received his B.S. degree in Computer Software Engineering from University of Applied Sci-ence and Technology, Tehran, Iran in 2006, and his M.S. degree in Information Technology Engineering from Tarbiat Modares University, Tehran, Iran, in
2009. Also, he is a researcher of the Iran Telecom-munication Research Center (ITRC), Tehran, Iran. His areas of research include Information Systems Engineering, Knowledge Discovery, Pattern Recogni-tion, e-Business, IT Development Models and Using Soft Computing and Data Mining Techniques in the Relative Systems Analysis.
Gholam Ali Montazer received his B.S. degree in Electrical Engineering from K.N. Toosi University of
Technology, Tehran, Iran, in 1991, his M.S. degree in Electrical Engineering from Tarbiat Modares Uni-versity, Tehran, Iran, in 1994, and his Ph.D. degree in Electrical Engineering from the same university in 1998. He is an associate professor of the Information Technology department in Tarbiat Modares University, Tehran, Iran. His areas of research include Infor-mation Engineering, Knowledge Discovery, Intelligent Methods, System Modeling, e-Learning and Image Mining.