High Voltage Circuit Breakers Vibration Signal Analysis based on Power Spectrum
Estimation
Fu.Chao
Hebei Normal University.Shi Jiazhuang, China
ABSTRACT: Power spectrum estimation method refers to vibration or random signal power spectrum calculation method, The
power spectrum analysis is an important part of the signal analysis, can be used to detect the periodic component and the percentage of the signal. And it has important implications for the diagnosis of mechanical failure.
Keywords: Spectrum Estimation, Vibration Signal, AR Model
Received: 25 May 2015, Revised 26 July 2015, Accepted 2 August 2015 © 2015 DLINE. All Rights Reserved
1. Introduction
Generally speaking, power spectrum estimation method can be divided into classical spectral estimation method and modern spectral estimation method. Classical spectral estimation methods are defined by the finite-length sequence to estimate directly, there are two ways to achieve: (1)Estimate the correlation function first, and then get the power spectrum estimation by the Fourier transform;(2) Link The power spectrum and the square of the signal amplitude-frequency characteristics. No matter the use of which one way, the common problem is the characteristic estimation of variance is not good, and the estimated value of ups and downs along the frequency axis is very fierce. With the longer of the data, the phenomenon will be more serious.
Classical spectral estimation method can be divided into direct and indirect methods, direct method is to use a fast Fourier algorithm (FFT) for a finite number of sample data to obtain a power spectrum of the Fourier transform method, also called periodogram; The indirect method is to get the autocorrelation function estimates of sample data firstÿthen performs Fourier transform of the power spectrum. Since direct method to obtain the power spectrum estimation spectral presence some shortcom-ings such as undulating curves, spectral resolution is not high,several improved algorithms proposed, such as Bartlett Law and Welch method. Modern spectral estimation is mainly made for the classic low resolution spectral estimation variance and poor performance and other issues, from the way the modern spectral estimation method can be divided into parametric model method and non-parametric model method, power spectrum estimation based on parametric modeling is an important content of modern power spectrum estimation. The main parameters of the model method has AR model method, MA and ARMA model method model law.
2. Classic Spectrum Estimation
Classical periodogram method (Periodgram) also called direct method, first calculate the Fourier transform of the random signal’s N observations x (n), then take the square of the amplitude,and dividing by Sequence of samples’ number N as the sequence x (n) estimates of the true power spectrum, namely:
(1)
When the sample sequence number N tends to infinity, the expected value of the direct method is equal to the power spectrum’s real value. The spectral estimated resolution is proportional to , and the data truncation and windowing, making that when the spectral curve larger the more dramatic ups and downs.
2.2 Direct Method’s Improved Algorithms
For the direct method to obtain the power spectrum estimation, when the data length is too large, the spectrum curves undulating; if the data length is too small, the spectral resolution is not high, So people also proposed several improved algorithms, such as Bartlett method and Welch method.
2.2.1 Bartlett Method
Bartlett average periodogram method is getting N points finite-length sequence x(n) segments seeking re average. Assuming that x (n) into L segments, and M samples per segment, Thus N = LM, paragraph i sample sequence can be written as:
(3)
(4)
2) Welch Method
Welch method of Bartlett law was amended in two respects: First, select the appropriate window function ω (n), and directly adding in front of the cycle diagram calculation, so that the resulting cycle Pictured each segment:
(5) in the formula,
(6) Is normalization factor. Windowed advantage is that no matter what kind of window functions can make non-negative spectrum estimation; and, when segmented, can overlap between segments, this would reduce the variance.
Corresponding to the sum, and then averaged to obtain an average Is the power spectrum:
(7)
2.3 The indirect method
The indirect method estimates the correlation function by the sequence x(n) first, Then do Fourier transform of the autocorrelation function evaluation, we get the the power spectrum estimation of sequence, x(n) namely:
(8)
2.4 Simulation Analysis
(a) Time Domain
(b) FFT Spectrum Analysis
(c) Direct method
(d) Indirect method
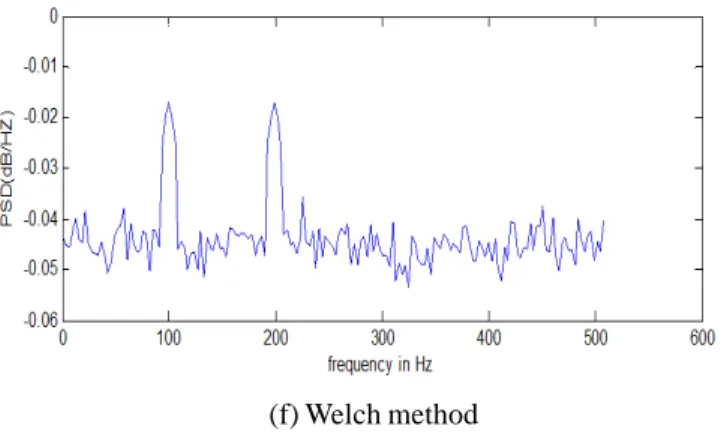
(f) Welch method
Figure 1. Comparative sequence x(n) of different power spectrum estimation
Although the Bartlett method does not specify window function, but for finite-length sequence, the equivalent rectangular windows; Meanwhile to facilitate comparison, Welch method also takes a rectangular window.
From the spectral estimation effect, the resolution of the indirect method is significantly better than the direct method; Comparison of Figure 1 (e), (f),we can see that Welch method’s spectral estimation’s errer is small than method’s. This is because although have adopted the rectangular window, But in the algorithm, when segments the same sequence, Welch method have overlap between the paragraphs, but Bartlett method didn’t, Experiments show that Overlapping data length is appropriate, therefore, the estimated variance characteristics, the former than the latter; If the window function better replaced Hamming window, Blackman window, using the Welch method was relatively smoother curve, as shown in Figure 1.
(a) Hamming window
(b) Gabe Blackman window
Figure 2. Welch power spectrum estimation method
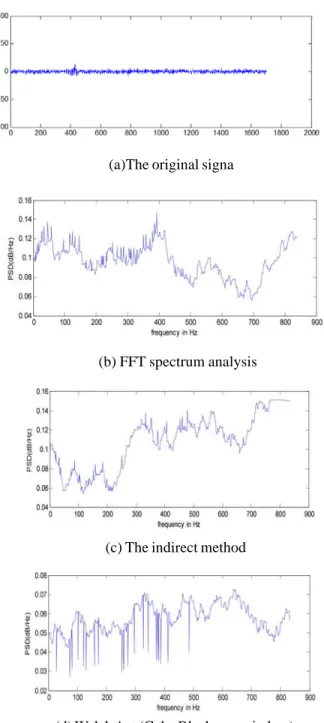
Despite the length of the vibration signal reaches N = 1500, can be counted as long data samples, Spectrum estimation results are still not satisfactory. Analysis found that although Welch method does a considerable improvement, but still essentially unknown outside the work area data assume that the data is zero, equivalent data windowing, resulting in reduced resolution and spectral estimation instability; The indirect method is the autocorrelation function of the sequence directly as Fourier transform, so the impact will be better than the Welch method.
(a)The original signa
(b) FFT spectrum analysis
(c) The indirect method
(d) Welch Act (Gabe Blackman window)
Figure 3. Two power breaker vibration signal spectrum estimation
spectrum estimation performance is superior to the classical spectrum estimation. Therefore, the following attempts to adopt modern spectral estimation methods.
3. AR model of the Power Spectrum Estimation
The power spectrum estimation based on the parametric modeling is an important part of modern power spectrum estimation, Its purpose is to improve the frequency resolution of the power spectrum estimation. Modern spectral estimation is parametric model spectrum estimation method based on random process, It can also be called a parametric model approach or simply model approach. Spectrum estimation method based on the general parameters of the model according to the following three steps: (1) To be determined or estimated random process to select a reasonable model;
(2) Model parameter estimation based on known observation data; (3) Model parameter estimation was used to calculate the power spectrum.
Modern spectral estimation model is divided into AR model, MA model and the ARMA model. model, also called moving average model, is the all-zero model; model is also known as auto-regressive moving average model, the “pole-zero” models. or course of any process can be represented by an infinite order, Even if you choose an appropriate model spectrum estimation procedure, you can always possible to select a sufficiently high order of approximation to the stochastic process modeled. Since accurate estimation of model parameters can be obtained by solving a set of linear equations, and for and model of the power spectrum estimation, accurate estimation of its parameters need to solve a set of higher-order nonlinear equations. Practice shows, AR
model has a power spectrum for short data analysis, calculation is simple, get a smooth spectral resolution advantages, therefore model has been widely used.
3.1 AR Model of the Power Spectrum Estimation Fundamentals
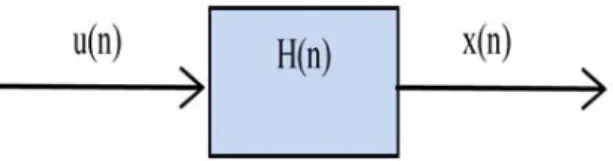
A number of stationary random processes can be generated by using white noise excitation linear time-invariant systems. Fig ure 4, x(n) is composed of an input sequence u(n) excitation output of a causal linear shift invariant discrete-time system H(n).
Figure 4. Parameters of the system model
If the discrete stationary random sequence x (n) can be linear differential equation (8) to describe:
(8) Where u(n) is a discrete white noise, called {x(n)} is ARMA process.
Formula (8) on both sides were taken Z transform, and assuming b0 = 1, can be obtained by formula (9), that is
(9)
of formula (9)
(11) Thereby obtaining the output sequence is a power spectrum
(12)
If b1, b2, ..., bq are all zero, the formula (8) becomes:
(13)
This model is called autoregressive model, referred to as AR, model. Where u(n) is a white noise with variance σ2 sequence, p
is the order of the AR model, ak the AR model parameters, k = 1, 2, ..., p. For the AR model, signal x(n) from the previous value itself several excitation current value and generating a linear combination, and the accurate estimation of AR model parameters can be obtained by solving a set of linear equations.
Also, the formula (12) becomes:
(14)
That random signal x(n) of the AR model of the power spectrum. It can be seen, to power spectrum estimation, we must obtain the AR model order p, model parameters a1, a2, ..., apand σ2.
3.2 Choose the AR Model Order
Select the appropriate AR model order AR spectral estimation is a key issue, Order pAR model is generally not known in advance, you need a slightly larger pre-selected value, determined in the recursive process. When using the Levinson recursive algorithm (Levinson-Durbin), can be given by the low-level to high-end of each set of parameters, and the minimum prediction error model of the power Pmin (equivalent to white noise sequence variance σ2 is decreasing. Intuitively, p when the prediction error reaches a specified desired value, or no longer change, then the correct order of the order that is to be selected.
Because prediction error power p is a monotonically decreasing, This value is reduced to just the right number is often hard to choices, Order selection too low will have a greater bias, and may cause peaks can’t tell; Select the parameters to be estimated too high is because too much performance degradation caused by spectral estimation variance. To this end, there are several different criteria have been proposed, the following are a few of the more common criteria.
1) Several Common Criteria to Determine the AR Model Order a) Final Prediction Error Criterion (FPE)
Make FPE(r) for the application of the minimum value of the order of r
(15)
Where r is the order of the prediction error Pr power, N is the number of samples, according to the following formula to calculate
Pr.
aj as a model parameter, R(j) of the signal x(n) of the autocorrelation function.
b) Information Criterion (AIC)
Make AIC (r) for the application of the minimum value of the order of r
(17)
Wherein the parameters N, Pr same as defined above. When the order r of a start to increase, FPE(r) and the AIC(r) are obtained at a certain minimum value of the r, r at this time is the most appropriate as the order p.
When the data is shorter, FPE, AIC given the low number of bands, and the results are given in the two is basically the same. When the sample size N tends to infinity, the amount of information FPE(r) and AIC(r) equivalent, when N → ∞, criteria for selecting the correct order of the probability of error is not zero.
c) The Minimum Description Length (MDL)
Rissanen proposed an alternative information criterion -minimum description length (MDL), criterion is based on the process to make the model corresponding probability distribution probability approaching the maximum possible distribution of the actual process of thinking. It is defined as the amount of information.
(18)
MDL statistical information criterion is consistent, experimental results show that the short data, AR order should be selected in the range will have good results.
Clayton Ulrych and proved that for a short segment, FPE, AIC work was not good.3
d) The Empirical Formula
Engineering frequently using the following formula:
(19)
Where N is the length of the data signal, k is the wavelet packet decomposition level.
According to the formula shows that order of a), b), c) three criteria estimates on the prediction error power Pr, by the formula (16), Prconsists x(n) of a sequence of the autocorrelation function r (j) , AR model parameters two parts; According to the definition of both, when the sequence x(n) changes in the autocorrelation function r (j) , AR model parameters a (j) values also changed; The empirical formula is defined by commonly known, order p by the sequence length N, the number of wavelet packet
k decisions and sequence values N, the noise itself is irrelevant; so the four methods, in addition to commonly used empirical formula, the order p under the other three criteria were randomly change (see Table 1), Wherein i is a random number of operations, i = 4.
It should be noted that the above is only a few criteria for order selection provides a basis, for the study to a specific signal, and ultimately choose their AR model order, you need to practice to compare the results of multiple.
3.3 Simulation Analysis
Take a sequence of noisy is a random Gaussian white noise, sampling rate
As can be seen by the sequence x(n) of the expression, because e(n) is a random Gaussian white noise, random values generated by each operation, so that the sequence x(n) values have changed.
Table 1. Random distribution of each criterion with random Gaussian white noise signal number order
Take another noisy sequence is a noisy square wave, is not randomly
distributed, In the same bandwidth (assuming here are [0,1]) of the premise, change the sample rate fs (equivalent to changing the sequence length N), the results in Table 2.
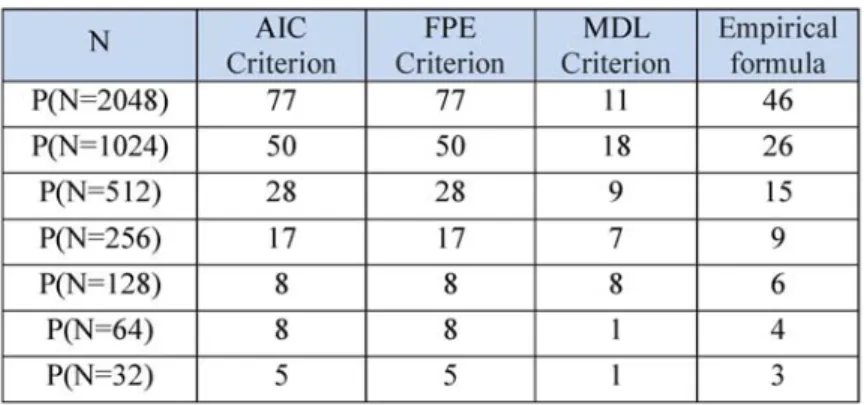
Table 2. The following four kinds of sequences of different lengths in order to determine
Found from Table 2, the sequence x(n) by a longer data (N = 2048) becomes short data (N = 32) of the process, the method of determining the order of four substantially decreased. Detailed analysis of the following variation of the order under AIC, FPE,
MDL criterion p’s:
(1) AIC criteria and guidelines for the FPE, regardless of size N samples, the results given both are the same, when the number of samples N is shorter, the order declined rapidly, but compared with the other two methods, the value is relatively high;
(2) For MDL criterion when short data is much smaller than the estimated value given by range, the power spectrum estimation done, the frequency resolution is very poor, or even not affect the resolution of frequency components; For short data, AR order should be selected in the range will have good results. I try several randomly noisy sequence analysis results of many experiments show that when changes in the order r range, the result is the estimation of each [N/3].
Take the following sequence of noisy , is a Gaussian
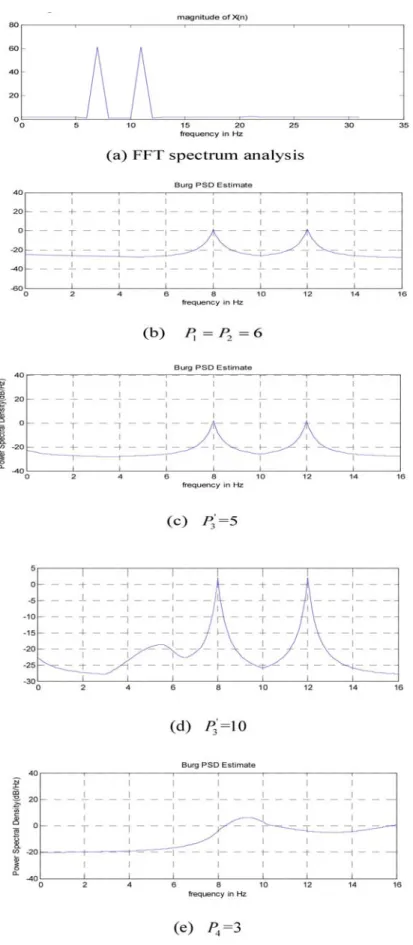
white noise, four methods (AIC, FPE, MDL, commonly used empirical formula) results are given as follows: P1= P2 = 6, P3 = 5, P4
When the data sequence is short, that is N = 32, the order of AIC, FPE standards and guidelines for obtaining similar MDL, when the order of P1, P2 , P3 were taken Figure 5 (b), (c) the power spectrum of the frequency curve can be clearly distinguished f1= 8Hz, f2 = 12Hz two peaks, this is consistent with the results of (a) the fast Fourier algorithm (FFT) spectrum analysis; the results of empirical formula used P4 = 3, the spectral curve is too smooth, the spectral resolution is poor, unable to distinguis f1= 8Hz,
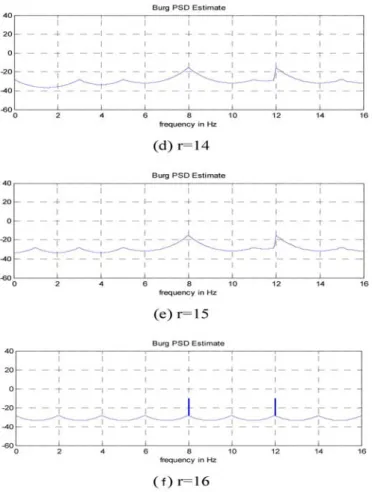
f2 = 12Hz two peaks (Figure 5 (e)), this is because we can see by the empirical formula, the results of the order P4 only by the signal length N, wavelet packet decomposition level k to decide, regardless of the frequency components of the signal; Figure 5 (d) MDL criterion is also used, the order taking , the effect of the power spectrum estimate (b), (c), as can clearly distinguish the two frequency peaks; Note that, in order to continue to increase during , the spectrum smoothing section undulating curve intensified, new peaks appeared, the spectrum changes shown in Figure 6.
When the order r to 13, starting at spectrum spurious peaks (see Figure 6 (c)); continue to increase r, the spectrum has been found in more false peaks, figure 6 (d), (e), (f) shown below, but the pseudo-peak energy relative to the two main peaks appear (f = 8Hz, f= 12Hz Department) is very weak, from the curve was still able to clearly distinguish the two peaks.
Figure 6. Different orders of power spectrum estimation
4. Conclusion
Based on the above analysis, although some guidelines have been proposed, but no single criterion can be well suited to a variety of situations, several selection criteria described in the order of only provide a basis for determining the order of the final signal is often affected by the specific nature of the study, the analysis of the results of the actual need for several experiments.
References
[1] Huhns, M.N. et al. (2005). Research Directions for Service-Oriented Multiagent Systems, IEEE Internet Computing, IEEE Computer Society.
[2] Liu, Y., Anne, H.H., Ngu , Zeng, L.(2004). QoS Computation and Policing in Dynamic Web Service Selection, IEEE Computer Scociety, ACM Press, New York, May .
[3] Er-fu WANG., Zhi-fang WANG., Jing MA., Qun DING. (2011). A New Method of Time-frequency Synthesis of Harmonic Signal Extraction from Chaotic Background, Special Issue on Selected Best Papers of the International Workshop CSEEE 2011. 6 (7).
[4] Burstein, M., Yaman, F., Laddaga, R., Bobrow, R. POIROT. (2009).Acquiring workflows by combining models learned from interpreted traces, In : Proceedings of the fifth international conference on knowledge capture. ACM;2009. 129–36.
[5 Xu. Jianyuan, Lang. Fucheng. (2005).Current situation and development trend of mechanical characteristics of high voltage circuit breaker online monitoring technology, Huatong Technology, (2).
[7] Srirama, S., Batrashev, O. ,Vainikko, E. (2010). Scicloud: scientiûc computing on the cloud, In : Proceedings of the 2010 10th IEEE/ACM International Conference on Cluster, Cloud and Grid Computing, IEEE Computer Society, 579–580.
[8] Feier, C., Roman, D., Polleres, A., Domingue, J., Stollberg, M., Fensel, D. (2005). Towards intelligent web services: the web service modeling ontology (wsmo), International Conference on Intelligent Computing (ICIC).
[9] Huang, Qingjia., Shuang, Kai., Xu, Peng., Li, Jian., Liu, Xu ., Su, Sen. (2014). Prediction-based Dynamic Resource Scheduling for Virtualized Cloud Systems, Journal of Networks, 9 (2), 375-383, February .
[10] Farrier, D. R. (1991). Introduction to High Resolution Array Spectrum Estimation, Numerical Linear Algebra, Digital Signal Processing and Parallel Algorithms NATO ASI Series , 70, 495-500.
[11] Zhang, X., Pietsch, G., Gockenbach, EM. (2006). Investigation of the thermal transfer coefficient by the energy balance of fault arcs in electrical installations, IEEE Trans. Power Deliv. 21 (1), 425–431 .
[12] Yunlu Ni, Hang Chen. (2013). Detection of Underwater Carrier-Free Pulse based on Time-Frequency Analysis, Journal of Networks, 8 (1), 205-212, January 2013.
[13] Jing, Z. H., Hua, J., Yang, X. N. (2007). A new method for detecting negative SNR UWB Signal, Communication Countermeasures. 4, 17–21.
[14] Kathirvel, P., Manikandan, M. S., Maya , P., Soman, K. P.(2011). Detection of power quality disturbances with overcomplete dictionary matrix and 1-norm minimization, Power and Energy Systems (ICPS), 2011 International Conference on, 1–6, December. [15] Li, Xiang., Yao, Haiyan (2013). Improved Signal Processing Algorithm Based on Wavelet Transform, Journal of Multimedia, 8(3), 226-232, June .
[16] Ma, J. G.., Xi, M. X., Lin, Y. M., Li, Y. P. (2008). Chinese Internet routerlevel hop count measurement and analysis, Application Research on Computer, 25 (27), 2112-2114.
[17] Kong, H. Y., Khuong, H. V. (2006). Performance analysis of space-time block coded cooperative wireless transmission in Rayleigh fading channels, KICS JCN, 8, 306–312, September.
[18] Xiong, K., Qiu, Z. D., Zhang, H. K., Li, C. S., Chao, H. C. (2008). A scalable fast forwarding approach for IP networks,
International Journal of Internet Protocol Technology, 3 (2), 119-127.
[19] Park, H. M., Min, Y. I., Han, J. S., Choi, H. J. (2010). Enhanced detection method for 3GPP LTE QO-SFBC system in frequency selective Rayleigh fading channel environment, ICUIMC, 558–562, February.
[20] Seddighian, P. et. al. (2007). All-optical swapping of spectral amplitude code labels for packet switching, In : Proc. Photonics in Switching , San Francisco, USA, 143-144.