Australian Journal of Basic and Applied Sciences
ISSN:1991-8178Journal home page: www.ajbasweb.com
Corresponding Author: Associate Professor Dr Abdul Talib Bon, Universiti Tun Hussein Onn Malaysia, Faculty of Technology Management and Business, 86400 Parit Raja, Johor, Malaysia.
Ph: +60127665756. E-mail: [email protected]
Optimization on Conveyor System Performance using Overall Equipment Effectiveness
1
Abdul Talib Bon and 2Anuar Mohamad Nor
1Universiti Tun Hussein Onn Malaysia, Faculty of Technology Management and Business, 86400 Parit Raja, Johor, Malaysia 2Open University of Malaysia, Faculty Science and Technology, Kuala Lumpur, Malaysia
A R T I C L E I N F O A B S T R A C T Article history:
Received 28 January 2015 Accepted 25 February 2015 Available online 6 March 2015
Keywords:
Conveyor, Overall equipment effectiveness, Courier company.
For this project we will try to improve the conveyor effectiveness by using weighing scale. The conveyor is located at Cargo warehouse used by Courier Company, the combination between conveyor systems and weighing scale system, the weighing scale is mounted at the frame structure that called table. This combination will improve the equipment effectiveness, workmanship and operation of the system. The data collected is in line with the requirements of overall equipment effectiveness. Overall equipment effectiveness is the tool for improving productivity. Productivity of conveyor lines enables better yield and utilization of the available resources. The real time production monitoring system together with overall equipment effectiveness will help companies to generate higher revenue. Courier company cargo production was succeed and achieved the Overall equipment effectiveness word class standard. Implementation of KPIs in performance management and measurement systems is of great value to organization, provided that the right measures and goals are chosen. Empirical literature suggests that goal setting, especially specific challenging goals, results in improved performance and productivity.
© 2014 AENSI Publisher All rights reserved. To Cite This Article: Abdul Talib Bon and Anuar Mohamad Nor., Optimization on Conveyor System Performance using Overall Equipment Effectiveness. Aust. J. Basic & Appl. Sci., 8(22): 44-48, 2014
INTRODUCTION
Conveyors are powerful material handling tool. It offers the opportunity to boost productivity, reduce product handling and damage, and minimize labour content in a manufacturing or distribution facility. Conveyors are generally classified as either Unit Load Conveyors that are designed to handle specific uniform units such as cartons or pallets, and Process Conveyors that are designed to handle loose product such as sand, gravel, coffee, cookies, cargo, food and etc. which are fed to machinery for further operations or mixing. It is quite common for cargo and manufacturing plants to combine both Process and Unit Load conveyors in its operations.
The conveyor is located at Cargo warehouse used by Courier Company, the conveyor is used to divide the cargo by region, before they divided the cargo, and several processes have to go through the cargo. First the cargo will past the mezzanine floor in order to check the cargo packaging. Second, the cargo will past the packaging area so as to check the packaging condition. The last process requires at least 6 man powers to weigh the cargo. For this project we will improve the conveyor effectiveness by using combination between the weighing scale and conveyor.
An improvement over the above problems will be done using the conveyor with weighing scale. Why do we need to improve the conveyor by add in git with the weighing scale? First of all, we can avoid from double handling and instead of doing the cargo weighing using six people, we can minimize the manpower needed using the conveyor with weighing scale to one or two people. In addition it can also reduce labour costs and increase the equipment effectiveness of the work force.
Literature Review:
Balachandran (1995) and it seemed to be quite effective when looking at a single weighing measurement with an improvement of 300%. Repeated measurements were not as effective only showing a 50% improvement, possibly due to interferences between the items. Unfortunately, Halimic & Balachandran (1995) did not provide details of the apparatus used to perform the measurements, nor did they provide information on the weights or speed for testing. These oscillations were also noted by McGuinness et al. (2005) when analyzing the power spectrum noticing there were usually two, or sometimes three, frequencies that were dominating in each spectra. It was mentioned that the lower frequency oscillations corresponded to the bouncing which decreased in frequency value yet increased in amplitude as the weight increased.
There is a stream of literature dealing with Overall equipment effectiveness directly, e.g. Leachman (1997), Ljungberg (1998), Jonsson and Lesshammar (1999), Dal et al. (2000), Jeong and Phillips (2001), Da Costa and Da Lima (2002), Bamber et al. (2003), De Ron and Rooda (2005, 2006), Abdul Talib Bon and Ping (2011), Abdul Talib Bon et al (2012), Muthiah and Huang (2007), Muthiah et al. (2008), Muchiri and Pintelon (2008), and Braglia et al. (2009). Other literature approach Overall Equipment Effectiveness either from maintenance (Nakajima, 1997; Waeyenbergh and Pintelon, 2002; Chan et al., 2005; Pinjala et al., 2006), from performance measurement (Ahmad and Dhafr, 2002; Berrah et al., 2004) or from productivity improvement (Huang et al., 2002, Huang et al., 2003, Kenyon et al., 2005). Most of this literature deals with the technical aspects of Overall equipment effectiveness as a measure. Some propose alternative measures that assumingly would fit better in a particular circumstance. Overall equipment effectiveness measure captures the reduction of scheduled operations with respect to maintenance, production and quality effectiveness, and distinguishes between these three components.
Research Methodology: (a) Data collection:
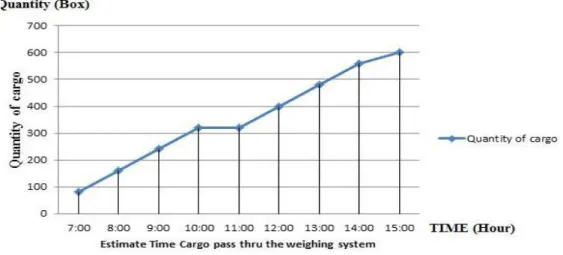
Base on Dimension analysis and Intelligent experimentation (Andrew C Palmer, 2008) The data taken at Courier company by not divert the cargo to the portable weighing scale, because the new design conveyor with weighing scale is runs parallel with main conveyor system, because the conveyor is motorized, it reflect of finding useful result that can be used efficiently and economically to make prediction, it show advantage of fact phenomena. Figure 1: Data taken Quantity cargo vs. time.
Table 1 and item 1 to item 3 below is contain all analysis and data collection, the data to be used for data analysis as discuss in further.
Fig. 1: Data Quantity cargo vs. time.
Table 1: Conveyor with weighing scale data.
ITEM DATA COLLECTION
Shift length 8 hours = 480 minute
Short breaks 15mnt
Meal break 45 minute
Ideal run rate 1.33nos per minute
Total Cargo pass thru the weighing scale 600Box
Cargo target per Shift 500Box
Conveyor down time Nil
(i) Total cargo in per day = 1500Nos per day (ii) Operation per day with 3shift
(iii) Cargo target per shift = 500Box
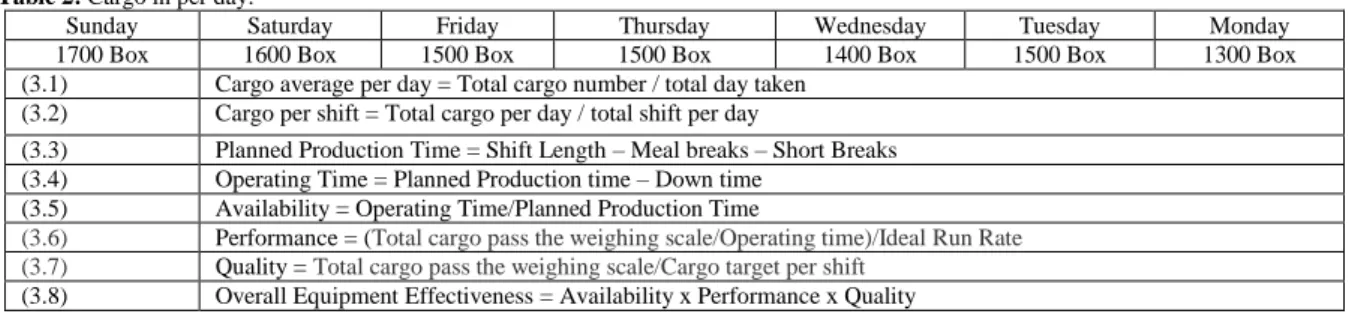
Table 2: Cargo in per day. The data is given by Operation supervisor Courier’s company for our reference to increase Efficiency and improve the conveyor system with weighing scale, Operation team informed they had 3 shifts per day, normally in the morning shift the have a problem as discuss in the problem statement, cargo stuck. Time given normally at 14:00, this will affect the operation, because in 8hours they target to clear and weighing 500Box of cargo to achieve target and gain productivity.
Table 2: Cargo in per day.
Monday Tuesday
Wednesday Thursday
Friday Saturday
Sunday
1300 Box 1500 Box
1400 Box 1500 Box
1500 Box 1600 Box
1700 Box
Cargo average per day = Total cargo number / total day taken (3.1)
Cargo per shift = Total cargo per day / total shift per day (3.2)
Planned Production Time = Shift Length – Meal breaks – Short Breaks (3.3)
Operating Time = Planned Production time – Down time (3.4)
Availability = Operating Time/Planned Production Time (3.5)
Performance = (Total cargo pass the weighing scale/Operating time)/Ideal Run Rate (3.6)
Quality = Total cargo pass the weighing scale/Cargo target per shift (3.7)
Overall Equipment Effectiveness = Availability x Performance x Quality (3.8)
(b) Data analysis:
Overall equipment effectiveness has been considered the ultimate efficiency tool for equipment’s and machineries used in industries. In 1971 the Japan Institute of Plant Maintenance introduced the Total Productive Maintenance (TPM) which includes the concept of Overall equipment efficiency as one of the important elements (Giegling et al., 1997). Nakajima then introduced the TPM to the United State of America in 1988 (Daniel Sheu, 2006). Overall equipment efficiency has since gained a lot of attention as the ultimate performance measure of a piece of equipment (Gaboury et al., 2001). Today OEE is one of the most important calculation tools to determining machine effectiveness (Pherson, 2006) the industry keeps the same wording although using it to refer to efficiency instead of effectiveness (Daniel Sheu, 2006). Overall equipment efficiency can be used to save industries from making inappropriate machine purchases, and help the management focus on improving the performance of the machinery.
Overall equipment effectiveness (efficiency) is a best practice metric for monitoring and improving the efficiency of the machines, cells, assembly lines etc (Drickharner, 2001). Overall equipment effectiveness is simple, practical yet powerful. It takes the most common sources of manufacturing productivity losses and places them into three understandable categories which are Availability, Performance and Quality (Ziemerink & Bodenstein, 1998). By doing so, it distils complex production data into simple understandable metrics that provide a gauge for measuring true efficiency. It also forms the foundation for tools that help to improve productivity and machine efficiency. Figure 3.21describes the basic equation of overall equipment efficiency (Godfrey, 2002).
Availability, performance and quality combine into one Overall equipment effectiveness score and this single number provides a complete measure of machine efficiency (Gaboury et al.,2001). Overall equipment effectiveness is the ratio of fully productive time to planned production time (Pherson, 2006). Overall equipment effectiveness is calculated as (Daniel Sheu2006). The major goals of Overall equipment effectiveness are to reduce and/or eliminate the six big losses, the most common causes of efficiency loss in production (Gaboury et al, 2001). Lists the six big losses and show how they relate to Overall equipment effectiveness loss categories. Addressing the six big losses and some of the events that contribute towards these losses is an essential task for the management, whereby the responsible personnel can focus on ways to monitor and correct them (Konopka & Trybula, 1996).
Generally accepted world class goals or standards for each factor are different for each machine on industry. These individual factors will also vary every shift base on the machines current overall performance. Studies have indicated that the average Overall equipment effectiveness rate in industries is 60%. As shown in Table 3, a world class OEE is considered to be 85% or better. This is a bench mark set by the Japan Institute of Plant Maintenance and widely being practiced worldwide (Daniel Sheu, 2006). Clearly, there is room for improvement in most manufacturing plants (Ramon, 2007).
Table 3: World class standards for each Overall equipment effectiveness (Ramon 2007).
Overall equipment effectiveness World class
Availability rate 90%
Performance rate 95.%
Quality rate 99.9%
OEE rate 85.%
are capable to bringing the conveyor to a better condition. Overall equipment effectiveness implementation can achieve better and lasting result during the progress. Efficiency calculation was done most of industries in Malaysia and other countries.
Detail analysis will help the management and the production team to visualize truthful data of their Conveyor. With such valuable data for Conveyor system improvement on the Cargo productions performance especially involving machineries and unwanted wastages can be eliminated. The value data from this project is expected to achieve and reflects the overall objectives of this project.
RESULT AND DISCUSSION
Table 4: Conveyor with weighing scale data.
Item Data collection
Shift length 8 hours = 480 minute
Short breaks 15mnt
Meal break 45 minute
Ideal run rate 1.33nos per minute
Total Cargo pass through the weighing scale 600 Boxes
Cargo target per Shift 500 Boxes
Conveyor down time nil
Table 4 shown data was collected for conveyor with weighing scale, the data is contains hypothetical per shift data of Courier company, to be used for a complete Overall Equipment Effectiveness calculation, starting with the calculation of the Overall Equipment Effectiveness Factors of Availability, Performance, and Quality. Note that the same units of measurement (in this case minutes and Boxes) are consistently used throughout the calculations.
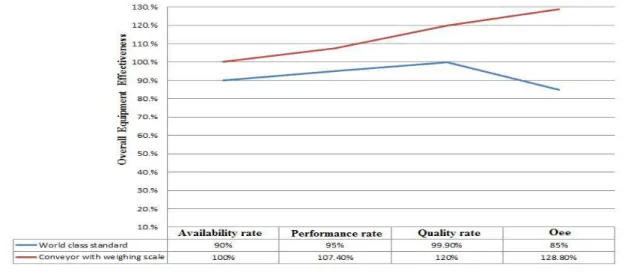
Table 5: Conveyor with Weighing Scale Overall Equipment Effectiveness compare with World classstandard.
Overall Equipment World class
Conveyor with Weighing Conveyor with weighing
Effectiveness(OEE) standard
Scale OEE (Company ABC) scale OEE Percent
increase
Availability rate 90%
100% 10%
Performance rate 95.%
107.4% 12.4%
Quality rate 99.9%
120% 20.1%
OEE rate 85.%
128.8% 43.8%
Table 5 shown the comparison between World class standard and Conveyor after apply the Weighing scale. The major goals of Overall equipment effectiveness are to reduce and/or eliminate the six big losses, the most common causes of efficiency loss in cargo management, Table 4.2 shown Overall Equipment Effectiveness of Courier company Conveyor system compare to World class standard, OEE comes with three important elements started with Availability rate that showed differences and increment of effectiveness of 10% followed by performance rate which showed increment of 12.4%, Quality rate also increased as 20.1%. These three elements has established accomplishment for Overall equipment effectiveness as 128.8% compared to OEE rate world class standard of 85%. The increment of 43.8% showed a significant boost and successfully achieved the objectives stated earlier.
Conclusion:
The main objective of this thesis was successfully achieved. It is to improve conveyor effectiveness. From the solutions given, it was learned that great improvements can be reached with Conveyor with weighing scale. Many manufacturing companies have capacity constraints and consider adding overtime, hiring new workers, or buying new equipment. The bottom line is a modest investment to optimize the performance of their existing machines may outweigh the major investment to purchase new equipment. By reducing down time, minimizing setup time, and improving operator performance, a manufacturing company can unleash hidden capacity and benefit from monitoring Simple OEE data.
In the Methodology it provided with design an improved system where using Conveyor with weighing scale. It was pointed out that better availability can be reached by reducing man-hours, but it increase of productivity and equipment effectiveness. With this solution, the Courier’s company had achieved goals and project Objectives. Intelligent data collection in Research method given useful data that can be used in the finding and discussion, Courier company cargo production was succeeded and achieved the Overall equipment effectiveness word class standard, Implementation of KPIs in performance management and measurement systems is of great value to an organization, provided that the right measures and goals are chosen. Empirical literature suggests that goal setting, especially specific challenging goals, results in improved performance and productivity. Courier company feedback on the results was good and the main objectives were accomplished. Detail analysis and results help the management and the production team to visualize truthful data of their Conveyor. With such valuable data for Conveyor system improved have value data which can reflect to achieve the Objective.
REFERENCES
Abdul Talib Bon, Lim Ping Ping, 2011. Implementation of Total Productive Maintenance (TPM) in Automotive Industry. 2011 IEEE Symposium on Business, Engineering and Industrial Applications (ISBEIA), Langkawi, Malaysia.
Abdul Talib Bon, Esam M.A. Mustafa, Umol Syamsyul Rakiman, 2012. Total quality management practices in Service organizations in malaysia: a review. Proceedings International Conference of Technology Management, Business and Entrepreneurship 2012 (ICTMBE2012), Renaissance Hotel, Melaka, Malaysia, 18-19.
Da Costa, G.S.E., P.E. da Lima, 2002. Uses and misuses of the overall equipment effectiveness for production management. Proceedings of IEMC 2002 IEEE International, 2: 816-820.
Dal, B., P. Tugwell, R. Greatbanks, 2000. Overall equipment effectiveness as a measure of operational improvement - A practical analysis. International Journal of Operations & Production Management, 20(12): 1488-1502.