AUSTRALIAN JOURNAL OF BASIC AND
APPLIED SCIENCES
ISSN:1991-8178 EISSN: 2309-8414 Journal home page: www.ajbasweb.com
Open Access Journal
Published BY AENSI Publication
© 2017 AENSI Publisher All rights reserved
This work is licensed under the Creative Commons Attribution International License (CC BY).
http://creativecommons.org/licenses/by/4.0/
To Cite This Article: Zakirah Mohd Zahari, Suriyati Salleh, Noor Asma Fazli Abdul Samad., Achieving the Target Crystal Size Distribution in the Case of Agglomeration and Breakage for Batch Cooling Crystallization Process. Aust. J. Basic & Appl. Sci., 11(3):
128-136, 2017
Achieving the Target Crystal Size Distribution in the Case of
Agglomeration and Breakage for Batch Cooling Crystallization Process
1Zakirah Mohd Zahari, 2Suriyati Salleh, 3Noor Asma Fazli Abdul Samad
Universiti Malaysia Pahang, Faculty of Chemical and Natural Resources Engineering, , 26300, Gambang, Pahang, Malaysia.
Address For Correspondence:
Noor Asma Fazli Abdul Samad, Universiti Malaysia Pahang, Faculty of Chemical and Natural Resources Engineering, 26300, Gambang, Pahang. Email: [email protected]
A R T I C L E I N F O A B S T R A C T
Article history:
Received 18 September 2016 Accepted 21 January 2017
Available online 26 January 2017
Keywords:
Crystal Size Distribution, Supersaturation, Analytical Estimator, Agglomeration, Breakage.
This paper aims to study the effects of agglomeration and breakage phenomena on the target crystal size distribution (CSD) in batch cooling crystallization process. An analytical CSD estimator has been extended to cover the effects of agglomeration and breakage in order to obtain the set-point trajectory needed for achieving the desired CSD. This set-point provides the supersaturation limit and total crystallization time that need to be maintained throughout the operation in order to achieve the target CSD. The application of the extended analytical CSD estimator is highlighted through sucrose case study where three different set-points generated from analytical CSD estimator is tested to achieve a similar crystal size distribution. In addition the performance of the controller for maintaining the crystallization operation is also discussed.
INTRODUCTION
Crystallization is an important separation process due to its ability to produce a highly purity separation product. Usually, the process can be operated in the continuous and batch modes. However, a batch crystallization process are widely used in many chemical, pharmaceutical, food and manufacturing industries rather than continuous due to its ability to produce a narrow crystal size distribution (CSD) and a large mean of a crystal product which contributing to high purity crystalline product (Paengjuntuek et al., 2008). The main specifications of the crystal product are usually given in terms of crystal size, size distribution, shape and purity (Samad et al., 2013). In order to obtain the desired quality of crystal product, it is necessary to control the crystallization operation within the metastable region. Usually a supersaturation set-point control is one of the ways to control the distribution of crystal particles in the batch cooling crystallization process. Here the set-point that needs to be maintained for the controller purpose can be generated using analytical CSD estimator (Samad et al., 2013; Nagy and Aamir, 2012).
extend the original analytical CSD estimator to cover the effects of agglomeration and breakage phenomena in order to obtain the desired target CSD. The application of the extended analytical CSD estimator is highlighted using sucrose crystallization case study. Here by specifying the target CSD, multiple set-points needed to achieve the target CSD are generated using extended estimator. The closed-loop simulation for sucrose crystallization is then performed for every generated set-point. The final CSDs obtained from every set-point are then compared and discussed.
Research Methodology:
Extension of Analytical CSD Estimator with Agglomeration-Breakage:
Previously, the analytical CSD estimator by Aamir (2010) has been developed under assumptions of constant supersaturation and crystal growth dominant phenomena. The function of this estimator is to generate a supersaturation set-point that provides a target crystal size distribution (CSD) assuming the initial seed distribution and growth kinetics of the system are known. In this work, the original analytical CSD estimator has been extended to cover the effects of agglomeration and breakage to analyze its effect towards the performance of the CSD. Here the agglomeration and breakage is defined as the production-reduction term and represented by the expressions term as shown in the Eqn. 1 below (Quintana-hernandez et al., 2004).
N M S K (L)
α r
rpm k c a a
(1)
In addition the effects of agitation rate are also considered in the extended analytical CSD estimator. Population balance equation (fn) incorporating production-reduction term, α (L) for one-dimensional case is shown in Eqn. 2.
L α dL
t , L df t , L dG dt
t , L df
i x,
i x, n i x, x i
x,
n
(2)
Where Lx is the characteristic length of crystal particles.
In the case of size independent growth rate (Gx), Eqn. (2) can be rewritten as:
L α dLdf G dt df
i x, n x
n (3)
The expression for size independent growth is given by: N
S K
Gx gx gx qrpm (4)
where Kgx is kinetic coefficient of crystal growth
S is relative supersaturation of crystal growth Nrpm is agitation rate
The supersaturation is assumed to be constant which is possible in a controlled crystallization and supersaturation expression is given by:
c c c
S sat
sat
(5)
where c is initial concentration csat is saturation concentration
Differentiating Eqn. (4) with respect to characteristic length gives:
0 dL dG x
x (6)
dZ df dt df dZ dt dL
df dZ
dL n n
i x, n i
x,
(7)
Comparing Eqn. (7) and (3) give:
1 dZ dt
(8)
G dZ dL
x i x,
(9)
α dZ dfn,i
(10)
Integrating Eqn. (8) with limits:
t
t
0
Z
Z
0
(11)By assuming
t
0
Z
0
0
, Eqn. (11) can be simplified:Z
t (12)
SincedtdZ, Eqn. (9) becomes:
G dt dL
x i
x, (13)
Substitute Eqn. (4) into (13) gives:
N S K dt
dL q
rpm gx gx i
x, (14)
Integrating Eqn. (14) with limits:
Lx,iLx0,i
KgxSgxNrpmq
tt0
(15)By assuming t0 0, Eqn. (15) can be simplified:
Lx,iLx0,i
KgxSgxNqrpmtc (16)Rearranging Eqn. (16) gives:
c q rpm gx gx i x0, i
x, L K S N t
L (17)
Since dtdZ, thus:
L α dt dfn,i (18)
Integrating Eqn. (18) with limit:
N M S K f
f q
rpm k c a a i, n0 i,
n (19)
Table 1: Analytical CSD estimator for sucrose
Characteristic Analytical model equations
Size independent growth : GKgSgNqrpm Final CSD :
2,...N 1, i , Nrrpm Mkc Sa Ka fn0,i
f in,
Final characteristic length:
tc Nqrpm S g Kg Lx0,i
Lx.i ,i1,2,....N
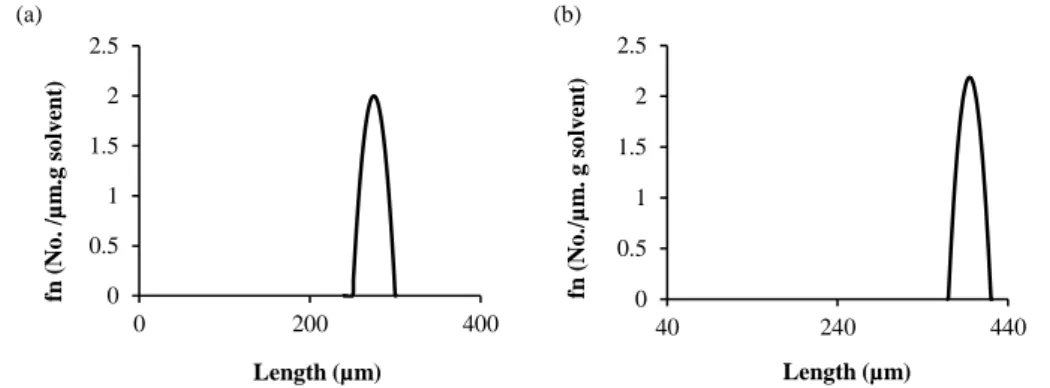
To generate the optimal supersaturation set-point using the extended analytical CSD estimator, three conditions must be taken into accounts which are the initial seed of crystals, a target CSD and parameters that represent the growth kinetic must be available. Usually, the target CSD, fn,i target is specified by the users in the form of normal, lognormal or bimodal distribution (Aamir, 2010). Here in this paper the initial seed distribution of the seeded batch crystallizer is assumed to be a parabolic distribution as reported by Shi et al. (2006) that starts from 250 to 300 µm as shown in Eqn. (20). The initial seed of CSD needs to be specified since it is serves as a starting point for the crystals starts to grow from initial characteristic length (Samad et al., 2013).
L,0 0.0032
300 L
L 250
,for250μm L 300μmn
L,0 0 ,forL 250μmandL 300μmn (20)
In this study, the target seed distribution chosen is also in the parabolic distribution as shown in the Equation (20).
L,0 0.0035
420 L
L 370
,for370μm L 420μmn
L,0 0 ,forL 370μmand L 420μmn (21)
Figure 1 shows the initial seed of CSD and target CSD generated from Eqns. (20) and (21). The highest peak for the initial seed is 2/µm. g solvent meanwhile for the target CSD is 2.12/µm. g solvent. Usually, in the case of size independent growth where the effects of both agglomeration and breakage are neglected, the peak and the curve shape of the initial and final CSD are similar except the mean of the characteristic length is increased due to the growth effect (Samad et al., 2013). However, in this case study with the incorporation of agglomeration and breakage, both the curve shape of CSD and characteristic length are changed.
Fig. 1: (a) Initial seed distribution (b) target seed distribution for sucrose crystallization
A model-based approach as shown in Eqns. (22) to (25) is then used to optimize the supersaturation set point and the total crystallization time in order to achieve the desired target CSD. The objective is to minimize the sum of squares of the relative errors between the desired target CSD and a predicted CSD obtained through the extension of analytical CSD estimator.
Minimize
2 N
1 i n,i
i n, i n, obj
f f f F
target target
(22)
Subject to: Ssp, tc
S S
Ssp,min sp sp,max (23)
t t
tmin c max (24)
c
c
tbatch
fmax (25)0 0.5 1 1.5 2 2.5
0 200 400
fn
(
N
o
.
/µ
m
.g
so
lv
ent
)
Length (µm) (a)
0 0.5 1 1.5 2 2.5
40 240 440
fn
(
N
o
./
µ
m
.
g
so
lv
en
t)
Where N is the number of discretization points, fn,i is the predicted CSD that is obtained from the analytical CSD estimator and fn.i target is the desired target CSD, ct, batch is the expected solute concentration at the end of the batch and cf, max represents the maximum acceptable solute concentration at the end of the batch to achieve the required yield.
RESULTS AND DISCUSSIONS
Simulation Results:
The case study used to demonstrate the application of the extended analytical CSD estimator is highlighted through sucrose crystallization process which has been adopted from Quintana-hernandez et al. (2004). The mathematical model used for sucrose case study is shown in Table 2 which is similar as published in the literature (Quintana-hernandez et al., 2004). The only difference is in this work the population balance equations are solved using the method of classes.
Table 2: List of model equations for the one dimensional model for sucrose (Samad et al., 2013) Population balance equation
(size independent growth)
2Δ Cl N B α ,i 1 L G L G N Cl 2Δ L G dt dN 1 2 0 1 2 2 1
1
n
N α ,1 i
Cl 2Δ G N Cl 2Δ G dt dN 1 i 1 i i i i
2ΔCl N α ,i n G N Cl 2Δ G dt dN 1 n 1 n n n
n
Overall mass balance (solute concentration)
1 i dt dNi S3xi G k 3ρ dt dc v c
Energy balance
dt dNi 1 i S3xi G k 3ρ c ΔH T T c M UA dt dT v c p w p
Energy balance for cooling jacket
T T A U T T A U T T c F ρ dt dT c V
ρw w pw w w win pw win w 1 1 w 2 2 ex w
Saturation concentration csat T6.291022.46103T7.14106T2
Supersaturation c c c S sat sat
Nucleation B K S MNp
rpm j c b b
Crystal growth rate (length direction) G K S Nq rpm g g x Characteristic size 2 L L Sxi xi xi1
Production reduction-term
Nrrpm Mkc Sa Ka L α
Total crystal mass
S N
k ρ M i 1 i 3 xi v c c
Cystal size distribution
2 cl /Δ N cl /Δ N L
fn xi i i i1 i1
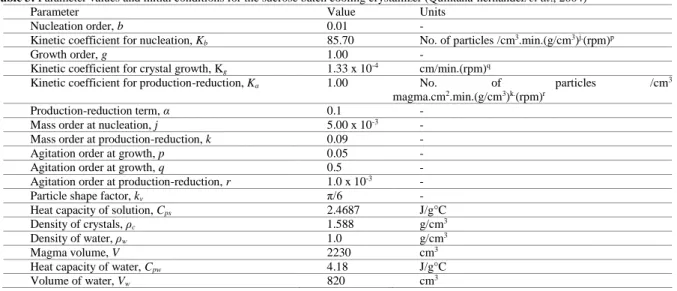
Meanwhile Table 3 shows the values of all parameters and known variables used to solve the mathematical model. In this work the sucrose crystallization mathematical model is developed in Matlab 2014a software and is solved using “ode15s” solver.
Table 3: Parameter values and initial conditions for the sucrose batch cooling crystallizer (Quintana-hernandez et al., 2004)
Parameter Value Units
Nucleation order, b 0.01 -
Kinetic coefficient for nucleation, Kb 85.70 No. of particles /cm3.min.(g/cm3)j.(rpm)p
Growth order, g 1.00 -
Kinetic coefficient for crystal growth, Kg 1.33 x 10⁻⁴ cm/min.(rpm)q
Kinetic coefficient for production-reduction, Ka 1.00 No. of particles /cm3
magma.cm2.min.(g/cm3)k.(rpm)r
Production-reduction term, α 0.1 -
Mass order at nucleation, j 5.00 x 10⁻³ -
Mass order at production-reduction, k 0.09 -
Agitation order at growth, p 0.05 -
Agitation order at growth, q 0.5 -
Agitation order at production-reduction, r 1.0 x 10⁻³ -
Particle shape factor, kv π/6 -
Heat capacity of solution, Cps 2.4687 J/g°C
Density of crystals, ρc 1.588 g/cm3
Density of water, ρw 1.0 g/cm3
Magma volume, V 2230 cm3
Heat capacity of water, Cpw 4.18 J/g°C
Exterior temperature, Tex 29 °C
Mass of total, MT 3328 G
Mass of water, Mw 800 G
Mass of solvent, Ms 2528 G
Mean length, ΔL 20.2525 µm
Crystal length, Lo 15.126 µm
Cooling water flow rate, Fwin 8100 cm3/min
Initial concentration, C 3.16 g sucrose/g water
Initial temperature, T 70 °C
Initial jacket temperature, Tj 70 °C
Initial agitation rate 600 rpm
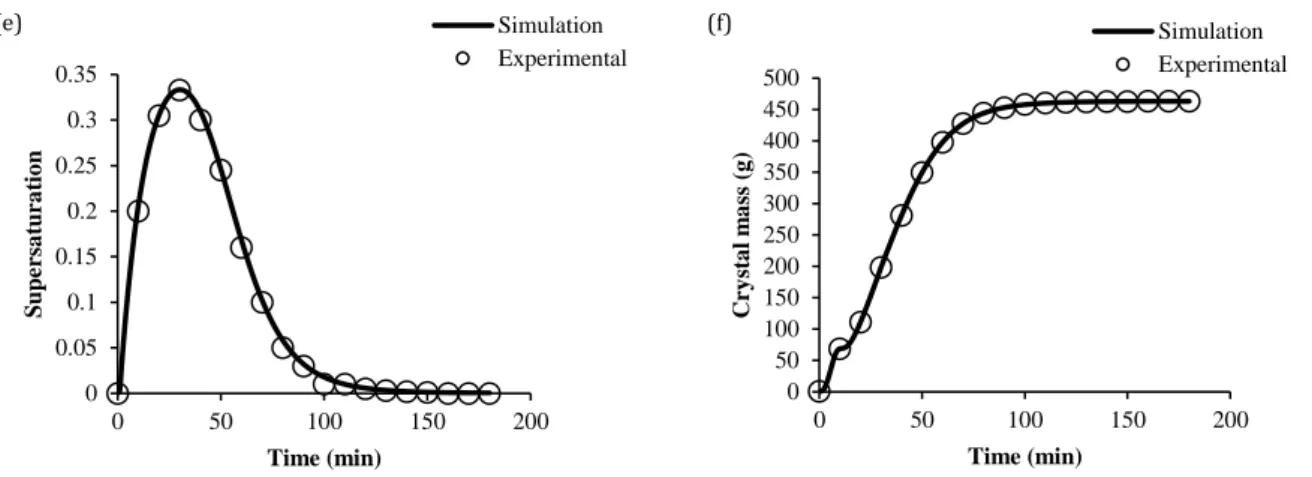
In this study, the mathematical model for sucrose crystallization process is solved under two conditions. Firstly, under open-loop simulation which will be acted as model validation and secondly under closed-loop simulation where the controller is employed in order to maintain the specified set-point at the desired trajectory. The open-loop simulation results for unseeded sucrose crystallization are shown in Figure 2 for model validation purposes. The crystallization starts with the initial cooling operation where the solution was cooled down from 70˚C to reach the saturation concentration. The sucrose concentration initially started at 3.16 g sucrose/g water is saturated at time 4.87 minutes. Once the saturation point is reached, the solution is further cooled to create supersaturation conditions where the solution starts to crystallize. However the concentration still maintained due to most crystal nuclei generated from nucleation kinetic will dissolve back to the solution and only starting to decrease obviously at time 43.4 minutes. The crystal nuclei then start to grow, thus necessitating the crystal growth rate kinetic until the end of the operation. The temperature profile when cooling down from 70 to 40˚C based on the natural cooling and a concentration of 2.33 g sucrose/g water was achieved by the end of the process as shown in Figure 2. Here approximately 460 g of the total crystal mass and 670 µm of mean size diameter were obtained based on the open-loop simulation. Here both total crystal mass and mean size diameter were obtained from crystal particles where it has been generated from nucleation kinetic since this is the unseeded system. Based on the simulation results of temperature, concentration, mean size diameter, agitation rate, supersaturation and total crystal mass profile, it shows that both simulation and experimental data are in good agreement indicating thereby a reliable and validated model are achieved.
39.8 44.8 49.8 54.8 59.8 64.8 69.8 74.8
0 50 100 150 200
T
em
p
er
a
tu
re
(
°C)
Time (min)
Simulation Experimental (a)
2.2 2.4 2.6 2.8 3 3.2 3.4
0 50 100 150 200
C
(
g
su
g
a
r/
g
w
a
te
r)
Time(min)
Simulation Experimental (b)
0 100 200 300 400 500 600 700 800
0 50 100 150 200
D
ia
m
et
er
(
µ
m
)
Time (min)
Simulation Experimental (c)
0 100 200 300 400 500 600 700
0 50 100 150 200
A
g
it
a
ti
o
n
r
a
te
(
rp
m
)
Time (min)
Fig. 2: (a) Temperature (b) Concentration (c) Mean size diameter (d) Agitation rate (e) Supersaturation (f) Total crystal mass profile of sugar in water
The next step concerns on the closed-loop simulation where controller performance is evaluated for maintaining the set-point at its trajectory. For this purpose, the extended analytical CSD estimator is employed by using the initial seed of CSD and target CSD as shown in Figure 1. The set-points generated from the model-based approach (Eqns. (22) to (25)) are shown in Table 4. All of the generated set-points will be tested in the closed-loop simulation to achieve the desired target CSD if it is maintained in the specified trajectory. For the closed-loop simulation, a proportional integral (PI) controller has been considered to maintain the sucrose concentration at the desired set-point.
Table 4: Supersaturation set-point values for the seeded sucrose batch cooling crystallizer
Time (min) Supersaturation set-point (g/g)
150 0.0352
180 0.0312
210 0.0281
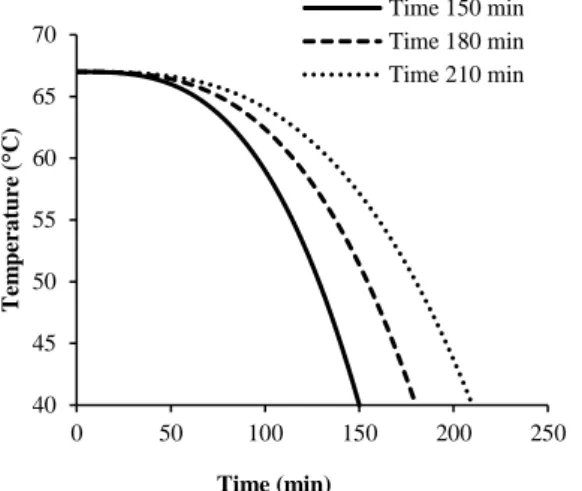
The closed-loop simulation results obtained are shown in Figure 3. The sucrose concentration profiles for all closed-loop simulation were successfully maintained at the required set-point until the end of the operation indicating a reliable PI controller. The sucrose concentration initially at 3.12 g sucrose/g water is decreased steadily to 2.30 g sucrose/g water at the end of operation time of 150 minutes, 180 minutes, and 210 minutes respectively. Meanwhile Figure 4 shows the temperature profiles when cooling down from 67 °C to 40 °C. It can be observed that the concentration is depending on the temperature where the concentration is decreased when the temperature is also decreased.
Fig. 3: (a) Concentration profile of sugar in water at 150 min (b) 180 min (c) 210 min. 0
0.05 0.1 0.15 0.2 0.25 0.3 0.35
0 50 100 150 200
S
u
p
er
sa
tu
ra
ti
o
n
Time (min)
Simulation Experimental (e)
0 50 100 150 200 250 300 350 400 450 500
0 50 100 150 200
C
ry
st
a
l
m
a
ss (g
)
Time (min)
Simulation Experimental (f)
2.3 2.4 2.5 2.6 2.7 2.8 2.9 3 3.1 3.2 3.3 3.4
0 50 100 150 200 250
C
o
n
c.
(
g
su
g
a
r/
g
w
a
te
r)
Time (min) Saturation Conc. Metastable Conc. Set-point Conc. Sucrose Conc. (a)
2.3 2.4 2.5 2.6 2.7 2.8 2.9 3 3.1 3.2 3.3 3.4
0 50 100 150 200 250
C
o
n
c.
(
g
su
g
a
r/
g
w
a
te
r)
Time (min) Saturation Conc. Metastable Conc. Set-point Conc. Sucrose Conc. (b)
2.3 2.4 2.5 2.6 2.7 2.8 2.9 3 3.1 3.2 3.3 3.4
0 50 100 150 200 250
C
o
n
c.
(
g
su
g
a
r/
g
w
a
te
r)
Fig. 4: Temperature profiles of sucrose crystallization
Meanwhile Figure 5 shows the mean size diameter and crystal size distribution for the sucrose crystallization process. The initial mean size diameter for seed crystals is 275 µm and the mean size is increased to 614 µm at the end of operation for all set-points as shown in Figure 5(a). This is due to the sucrose in the solution has been transferred into a seed crystal and thus resulting into the increment of the mean size diameter. Figure 5(b) shows the initial seed and final CSD for sucrose crystallization process. When the agglomeration-breakage is incorporated, the sucrose crystallization resulted in final crystal size distribution (CSD) at 210 minutes is about 2.12 µm per gram of solvent, with an approximate mean of 395 µm as similar to the targeted distribution. At this phase, the seeded formation for final CSD are tends to agglomerate rather than breakage due to the higher crystal size distribution value obtained. However, the secondary peak is appeared in the final CSD due to the nucleation effects that cannot be captured by the analytical estimator. As shown in Figure 5(b), the highest secondary peak was obtained when operating the crystallization process for 150 minutes (supersaturation set-point of 0.0352). Although the target CSD was achieved when operating at this condition however the drawback is higher secondary peak was obtained. This is due to the supersaturation set-point at 0.0352 operated closer to the metastable limit and thus more secondary nucleation has occurred in the operation. The secondary nucleation is not favorable in the crystallization process because it will produces more crystal particles at lower characteristic length and will affecting the growth of crystal seed. Meanwhile supersaturation set-point of 0.0281 and total crystallization time of 210 minutes produce lower secondary peak but the total crystallization time for this operation is too long compared to the others. This is mainly because the crystallizer has been operated close to the saturation line, and under such conditions it will take a long time to achieve the target CSD. If the total crystallization time is taken into consideration then it will not be very practical since the operating costs typically increase the longer the batch runs. As an alternative set-point of 0.0321 at crystallization time of 180 minutes can be selected due to its reasonable operation time while the performance is still acceptable, producing a CSD that is close to the target CSD generated by the analytical CSD estimator.
Fig. 5: (a) Mean size diameter (b) Crystal size distribution (CSD) for sucrose 40
45 50 55 60 65 70
0 50 100 150 200 250
T
em
p
er
a
tu
re
(
°C)
Time (min)
Time 150 min Time 180 min Time 210 min
270 370 470 570 670
0 50 100 150 200
M
ea
n
si
ze
d
ia
m
et
er
(
µ
m
)
Time (min)
(a)
0 1 2 3 4 5 6 7 8 9 10
0 100 200 300 400 500
fn
(
N
o
./
µ
m
.
g
so
lv
en
t)
Length (µm)
Conclusion:
An analytical CSD estimator has been extended to determine the set-point trajectory for all the necessary phenomena (crystal growth, agglomeration and breakage). Sucrose in batch crystallization process was considered as a case study. Based on the closed-loop simulation results, the extended analytical CSD estimator is able to provide the accurate supersaturation set-point in achieving the desired target CSD in the case of agglomeration and breakage phenomena. Although the target CSD is achieved using multiple set-points, however it is important to note that the shorter crystallization time yields a high secondary peak and a tradeoff needs to be decided between operational time and fines crystal production from secondary nucleation.
ACKNOWLEDGEMENT
The financial support for this Master project provided by the Universiti Malaysia Pahang (UMP) Vot Number RDU140395 is gratefully acknowledged.
REFERENCES
Aamir, E., 2010. Population balance model-based optimal control of batch crystallization processes for systematic crystal size distribution design, PhD thesis, Department of Chemical Engineering, Loughborough University, United Kingdom.
Nagy, Z.K., E. Aamir, 2012. Systematic design of supersaturation controlled crystallization processes for shaping the crystal size distribution using an analytical estimator, Chemical Engineering Science, 84: 656-670.
Quintana-Hernandez, P., E. Bolanos-Reynoso, B. Miranda-Castro, L. Salcedo-Estrada, 2004. Mathematical modelling and kinetic parameter estimation in batch crystallization, American Institute of Chemical Engineers, 50(7): 1407-1417.
Paengjuntuek, W., P. Kittisupakorn, A. Arpornwichanop, 2008. On-line dynamic optimization integrated with generic model control of a batch crystallizer, Journal of Industrial and Engineering Chemistry, 14: 442-448.
Samad, N.A.F.A., G. Sin, K.V. Gernaey, R. Gani, 2013. A systematic framework for design of process monitoring and control (PAT) systems for crystallization processes, Computers and Chemical Engineering, 54: 8-23.