INTRODUCTION
Although in recent years it has emerged that cytochrome c oxidase (Cox) plays a critical role in the pathogenesis of Alzheimer’s disease, diabetes and several other diseases (1, 2), interest in this enzyme extends back for more than fifty years. Indeed, early activity studies have established that Cox catalyses the reduction of oxygen to water in a reaction that is critical to the production of adenosine triphosphate (ATP) in cells (3, 4). Much is now known about the structure of Cox. Early predictions based on sodium dodecyl sulphate-polyacrylamide gel electrophoresis (SDS-PAGE), covalent modifications, electron paramagnetic resonance (EPR) and other studies (5–11) have been confirmed by X-ray analysis of crystals of the enzyme (12–14). It is therefore now established that the eukaryotic forms of the enzyme consist
of thirteen subunits [SUs] per monomer (12) and that each monomer of the enzyme contains eight metal ions, five of which are redox active (12, 15, 16).
The kinetics of Cox is understood with less certainty. In each cycle of activity, the enzyme accepts four electrons from four molecules of its substrate cytochrome c; it passes these electrons on to its second substrate, oxygen, which, as pre-viously stated, is reduced to water (3, 4). The precise route taken by the electrons as they move from cytochrome c to oxygen is not known with certainty. Kinetic evidence sug-gests that the pair of copper ions, referred to as CuA, is the first of the Cox redox active centres to receive electrons (17). There is rapid equilibration of these electrons with a second centre, haem a, after which the electrons are transferred to oxygen via a third copper and a second haem but the sequence of events has not been agreed on (18–21).
Several studies have demonstrated that quite apart from the uncertainty surrounding the route followed by electrons, the kinetics of oxygen reduction is complicated. On one hand, the steady state assay of Cox exhibits non-hyperbolic characteristics so that the resulting Eadie Hofstee plots generate two intersecting straight lines instead of a single line (22); there is, however, no consensus regarding the
signi-A Bio-computing signi-Analysis of the Resting-to-pulsed Conformational Changes in
Cytochrome c Oxidase
T Alleyne1, DN Ignacio1, D Ashe1, VB Sampson2ABSTRACT
Cytochrome c oxidase (Cox) accepts electrons from its substrate, cytochrome c and passes these to oxygen, which is reduced to water. Kinetic studies show that an active form of the enzyme (pulsed) and a slower form (resting) exists. More efficient internal electron transfer and the switching of the enzyme’s oxygen/ligand binding site between opened and closed positions are said to account for the different rates of reduction. We employed bio-computing to analyse the structure of the oxygen/ligand binding site of bovine Cox under different redox states; a comparison with Thermus thermophilus Cox was also conducted. The study detected that the ligand binding site of Cox is exposed to the contents of the intermembrane space, and that the side chain of haem a3, located at the enzyme’s oxygen/ligand
binding site, approached Pro-69 and Ile-34 in faraway subunit-II. However, no open-to-closed gating structures were detected at the ligand binding site. We concluded that the resting-to-pulse transition in Cox does not involve opening-up of the ligand binding site. We propose that the rates of ligand/oxygen/cyanide binding are partly controlled by “queuing” near the binding site and that the binding of oxygen to haem a3-CuB triggers the resting-to-pulsed transition via long-range
conformational changes.
Keywords:Conformational change, cytochrome c oxidase, electron transfer, oxygen binding, pulsed Cox, resting Cox
WIMJ Open 2015; 2 (3): 109
From:1Faculty of Medical Sciences, The University of the West Indies, St Augustine, Trinidad and Tobago and2Nemours Centre for Cancer and Blood Disorders, Alfred I duPont Hospital for Children, Wilmington, Delaware, USA.
Correspondence: Dr T Alleyne, Biochemistry Unit, Faculty of Medical Sciences, The University of the West Indies, St Augustine Campus, Eric Williams Medical Sciences Complex, Uriah Butler Highway, Champs Fleurs, Trinidad and Tobago. Fax: 1-868-662-1873; e-mail: [email protected]
DOI: 10.7727/wimjopen.2015.090
ficance of this behaviour (23, 24). Equally baffling is the pre-steady state kinetics.
A number of researchers have reported a five-fold increase in Cox activity once the enzyme had undergone a complete cycle of reduction and reoxidation (25–27). The slow form of the enzyme is referred to as the resting enzyme while the highly active form is referred to as the pulsed. Initially, Antoniniet al(25) suggested that different rates of internal electron transfer might be responsible for the ‘resting-to-pulsed’ transition. Subsequently, based on cyan-ide inhibition studies, Jones et al (28) suggested that a conformational change in the region of the ligand/oxygen binding site determined whether ligand binding was fast or slow. The group proposed that the binding site for cyanide and similar ligands was closed and inaccessible in the resting enzyme, but opened and readily accessible in the pulsed (28). To date, however, direct structural evidence of this resting to pulsed transition has not been detected. Also, in spite of recent studies pointing to the involvement of an oxygen channel (29), exactly how oxygen and such ligands reach the Cox binding site is not well understood. In our recent kinetic and EPR studies (18), we observed the different rates of cyanide binding reported by others (27, 28) and thought that a biocomputing approach might provide some answers.
In 1996, the first complete crystal structure of bovine Cox in its fully oxidized form was published (12). Since then, in addition to significant improvements in the resolu-tion, structures of the fully reduced and some ligand bound forms of the enzyme have been published (12–14). Because the production of a Cox crystal is a slow process, and because the pulsed enzyme in the absence of reducing substrate always relaxes back to the resting state (26), no structure of the fully oxidized pulsed enzyme has been reported to date. In this paper, we employed computer modelling to study and compare the structures of the fully oxidized resting, the fully reduced, and the carbon monoxide (CO)-bound form of bovine Cox. We also compared some features of the
Thermus thermophilus cytochrome ba3 oxidase to those in
the bovine. Our objective was to analyse these different forms of Cox in the hope of detecting those conformational changes thought to be associated with its resting to pulsed transitions. We also hoped to gain an insight into the process by which oxygen reaches its binding site. Although we studied the whole 13-SU bovine enzyme, we focussed particularly on SU-I, SU-II and SU-III,iethe region regarded as the core of the enzyme, looking at those regions in the vicinity of oxygen binding site.
MATERIALS AND METHOD
The structures of oxidized, reduced and CO-bound bovine Cox were obtained from the Brookhaven Protein Data Bank and analysed as described below, using the Swiss PDB Viewer programme. Both the oxidized and reduced structures were at 2.8 Å resolution, while for the CO, the closest available resolution was 2.35 Å. For part two of the study,
the structure of the fully oxidized Thermus thermophilus
cytochromeba3oxidase was downloaded from the bank.
Comparative studies on bovine Cox
First, one monomer of either the oxidized, reduced or CO Cox was displayed, showing haem a, haem a3, CuA and CuB.
This monomer was manipulated so that it could be viewed from different angles. Next, all of the SUs except those of interest (SUs I, II or III) were hidden (made to disappear). Starting with SU-II for all three forms of the enzyme, the proteins were viewed from all angles and relevant distances between residues recorded. Then SU-III was added to the display and the viewing from different angles was repeated, paying particular attention to residues in the vicinity of haem a, haem a3and CuB. Next, SUs II and III for all three forms
of Cox were superimposed on each other using the oxidized form as the reference molecule. When the analysis of SUs II and III was completed, SU-I of each of the three forms of Cox was manipulated and viewed. Finally, SU-I of the oxidized and the CO Cox and then the reduced and the CO Cox were superimposed and each pair studied for alignment.
Comparative studies on bovine and T thermophilus Cox
The structure of SU-I ofThermus thermophilusba3Cox was
first viewed from the top and side and then superimposed on that of the bovine (aa3) enzyme for comparison. The
objective here was to determine if the region of the ba3
oxidase, identified as the oxygen diffusion channel (29), exists in the bovine enzyme.
RESULTS
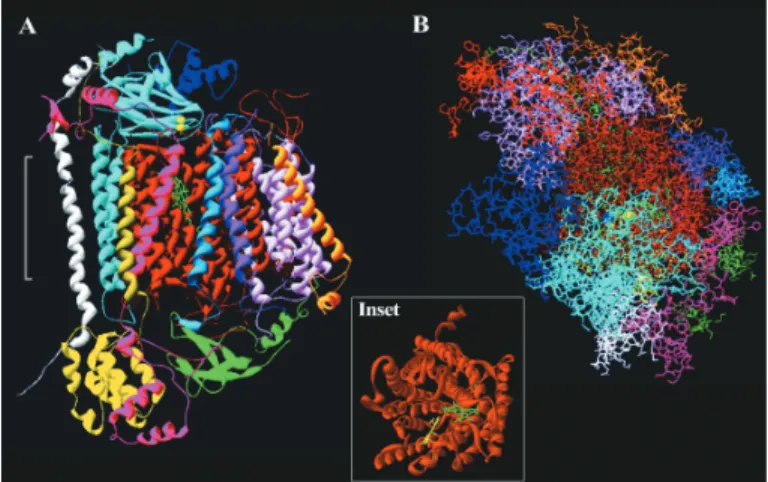
Bovine studies:In Fig. 1, which shows a monomer of bovine Cox, SUs I, II and III are seen to span the membrane with SU-I extending slightly above the surface of the surrounding membrane as previously reported (13). When viewed from the top (overhead), which corresponds to perpendicular to the intermembrane space, SU-I has the appearance of a propeller shaped funnel; wide open at the top and becoming more restricted toward the centre (Fig. 1 inset). When the com-plete monomer is viewed from the top (Fig. 1B), it becomes evident that except for a small region, about 25–30% covered by the extra-membrane portion of SU-II, the surface of SU-I is exposed to the contents of the intermembrane space. The exposed region includes that part which stretches from the surface and extends to the haem a3-CuB centre and
designated as ‘pore B’ by Iwataet al(13).
When all of the SUs, except first SU-II and then III, of oxidized Cox were rendered invisible, it became evident that neither SU-II nor SU-III made any direct or close contact with the body, iethe tetrapyrole component, of haem a or haem a3; also, neither SU came close to CuB (Fig. 2A).
Interestingly, the tail of the long hydrophobic side chain of haem a3came very close to the two transmembrane segments
closest residues, Ile-34 and Pro-69, which were 4.38 Å and 3.85 Å away, respectively (Fig. 2A–C). Also, the oxidation state did not appear to influence the conformation of SUs II or III, as the SUs of the reduced protein were perfectly overlaid on the SUs of the oxidized (Fig. 2D). Similarly, SUs II and III of the CO Cox were perfectly overlaid on the SUs of the oxidized (Fig. 2E).
Examination of SU-I of oxidized Cox showed that while haem a, haem a3 and CuB were totally buried within
the protein matrix, the end of the long hydrophobic side chain of haema3protrudes out of the SU (Fig. 3A). When the SU
was tilted and viewed from the top, suitable rotation showed that haem a and the haem a3-CuB centre were located in
totally unhindered regions of the protein backbone (Fig. 3B) corresponding to pores C and B, respectively (13). Similarly, the top view for the CO-bound Cox showed the haema3-CuB
ligand binding site to be well clear of the protein backbone (Fig. 3C).
The overlays of subunit-I (Fig. 4 A–D) helped to shed even more light on the picture. Superimposition of the fully reduced on the fully oxidized and of the CO-bound on the fully reduced detected no change in the organization of the protein backbone or the haems when either the oxidation state or ligand state was changed (Fig. 4A, B).
We observed that there were 31 residues (Table) that came within 5 Å of the oxygen/ligand binding site located between haem a3 and CuB centre. These could be divided
broadly into three sections: one to the right of CuB (Fig. 4C), which included Val-243 and Tyr-244, another to the left Fig. 1: Structure of bovine Cox.
A.Side[transmembrane]view ofamonomer[inribbon] offullyoxidized bovineCoxwitheachofthethirteensubunitsshowninadifferentcolour.The white bracket shows the approximate position of the membrane. B. Top [overhead]viewofA[showingallaminoacidresidues]followingan anti-clockwiserotationofabout90°.Thecoloursofthesubunitsare:I–brown;II – light blue; III – light pink; IV – pink; V – yellow; VI – green; VII – red; VIII – cobalt blue; IX – white; X – orange; XI – light green; XII– purple; XIII – blue. The haems are green; CuB – grey sphere; CuA – two yellow spheres and magnesium – deep blue sphere.Inset.Overhead view of subunit–I. Haem a3– yellow and haem a – green are clearly visible in this ribbon presentation.
Fig. 2: Backbone of bovine subunits.
A.Fully oxidized bovine subunits II, turquoise and III, rust brown. CuA, housed in subunit-II are pink spheres. Haem a3is yellow and haem a is green. CuB [next to haem a3] is an orange sphere.B.The tail of the haem a3 side chain [yellow] is sandwiched between the two transmembrane segments of subunit-II.C.The tail of the haem a3side chain [yellow] comes close, < 5 Å, to Ile-34 and Pro-69 of the two transmembrane segments of subunit-II.D.Fully reduced bovine subunit-II, orange and subunit-III, lilac overlaid on the fully oxidized subunits. Both haems of the oxidized are yellow and both of the reduced are green.E. Carbon monoxide (CO)-bound bovine subunit-II, green and subunit-III, white, overlaid on the fully oxidized subunits. Both haems of the oxidized are yellow and both of the CO are pink.
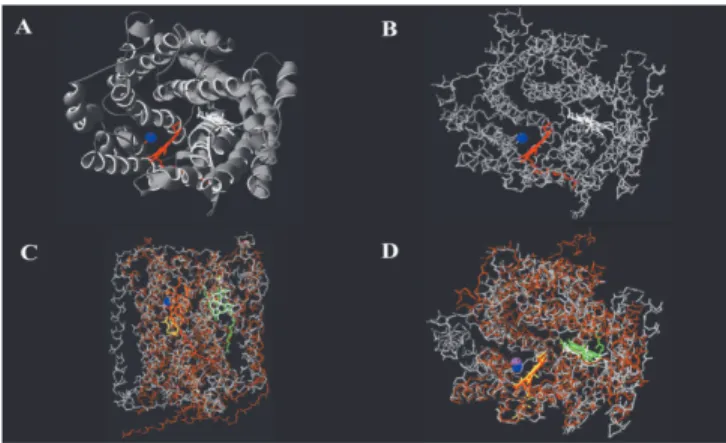
Fig. 3: Backbone of bovine subunit-I.
which included Val-373 and Gly-355 and the third group adjacent to CuB which included Met-292 and Thr-294. Close inspection of the haem a3-CuB ligand binding region using
expanded views (Fig. 4C, D) did not detect any structures that appear to restrict access to the site. In fact, even when all of the amino acid residues were displayed (Fig. 4D), or all
Fig. 5: Subunit-I of ba3and bovine Cox.
A, B.Overhead view of oxidized subunit-I of theThermus thermophiles ba3
Cox. Haem a3 is red, haem a is white and CuB is blue. A. Ribbon presentation.B.Stick presentation of backbone.C.Side [transmembrane] view of oxidized bovine subunit-I [brown] overlaid on oxidized subunit-I of ba3Cox.D.Overhead view of oxidized bovine subunit-I [brown] overlaid
on oxidized subunit-I ofba3Cox.
Fig. 4: Overlays of bovine subunit-I.
A.Overhead view of the backbone of fully reduced bovine subunit-I, yellow, overlaid on the backbone of fully oxidized subunit-I; both haems of the fully reduced are pink.B.Overhead view of the backbone of carbon monoxide (CO)-bound bovine subunit-I, green, overlaid on the backbone of fully reduced subunit-I; both haems of the CO-bound subunit are blueC.An expanded view of the haem a3-CuB binding site for the CO-bound overlaid on fully oxidized Cox. In this backbone presentation, the molecules were rotated about 315° clockwise relative to A/B.D.An expanded view, showing the amino acid residues, of the haem a3-CuB binding site for the CO-bound overlaid on fully oxidized Cox.
of the SUs were displayed (Fig. 1B), it was still possible to see the unhindered, ‘buried’ ligand binding centre from the top (overhead) view.
T thermophilus: Although SU-I of the Thermus
thermophilus ba3 Cox is known to be some 48 residues
bigger than that of the bovine enzyme, these two SUs were found to have the same basic organization (Fig. 5). Thus, when viewed from the top, the alpha helical sections of the ba3 Cox also gave the appearance of a propeller shaped
funnel, wide open at the top but becoming narrow in the vicinity of the haem a3-CuB centre (Fig. 1 inset, Fig. 5A, B).
Superimposition of the two SUs reinforced the idea that although they differ in size, they had the same overall structure (Figs. 5C, D). As observed for the bovine enzyme,
Table: Amino acid residues
Amino acid residues
Trp 126 Met 292 Thr 349 His 368
Trp 236 Thr 294 Gly 352 Val 373
His 240 Val 295 Leu 353 His 376
Val 243 Thr 309 Gly 355 Phe 377
Tyr 244 Ala 313 Ile 356 Val 380
Ile 247 Thr 316 Leu 358 Leu 381
His 290 Gly 317 Ala 359 Arg 438
His 291 Phe 348 Asp 364
DISCUSSION
The discovery in the 1970s that Cox catalyses the conversion of oxygen to water at two vastly different rates depending on how recently it had undergone total reduction (25) has thus far been explained only in conceptual terms. Antoniniet al
(25) described the slow form of the enzyme as ‘resting’ and the more active form as ‘pulsed’. The group proposed that the change in kinetic properties was modulated by a redox-induced conformational change that affected the rates of intramolecular electron transfer. Later, in the 1980s, Joneset al(28) proposed that the perplexingly slow binding of the deadly poison cyanide could be explained in terms of the ‘resting’ and ‘pulsed’ enzyme, if it was assumed that a con-formational change switched the enzyme’s binding site from an open and readily accessible position in the pulsed enzyme to a closed and inaccessible position in the resting state. When recently (18) we observed the different rates of cyanide binding reported previously by others (27, 28), we decided to turn to biocomputing for answers. Since the ‘pulsed’ enzyme always relaxes to the ‘resting’ form on standing (26), we hypothesized that analysis of the existing crystal structures of Cox would reveal the secrets of the ‘closed’ ligand binding site.
In our quest to unearth the conformational change that triggers the resting to pulsed transition of Cox, we compared structures in the vicinity of the oxygen/ligand binding site of three forms of the bovine enzyme, namely, the oxidized, the fully reduced and the CO Cox, which is a form of the fully reduced enzyme. To complete the study, we also compared the ligand binding site region of the bovine and Thermus thermophilusba3Cox.
haem a3in the ba3Cox was also seen to be in an unhindered
When the position of SUs II and III relative to haem a and the haem a3-CuB centre was examined, neither SU made
any direct contact with either haem but Pro-69 and Ile-34 of SU-II came close, within ~ 4 Å of the tail of the long hydrophobic side chain of haem a3 (Fig. 2A–C). Equally
important, overlays (Fig. 2D, E) showed that neither the positions of SUs II and III nor the redox centres of the oxygen/ligand binding site changed detectibly when the oxidation state of Cox was changed, or when the enzyme bound the CO ligand. These observations suggest that if the resting to pulsed transition of Cox involves a conformational change, the initial change does not involve SUs II or III directly.
When SU-I was added to the analysis, we observed that the haem a3-CuB ligand binding centre sat in a clear,
unhindered spot (Figs. 3, 4), forming the base of the channel previously designated ‘pore B’ (13). Although Yoshikawaet al (14) reported a very small difference in the distance separating haem a3from CuB in the oxidized compared to the
reduced enzyme, this very small change did not appear to have an impact on our overlays (Fig. 4A, B). In fact, our overlays of SU-I showed that when CO-bound Cox was compared to the fully oxidized and the fully reduced forms, neither the position nor orientation of haem a3or CuB was
affected by the presence of CO (Fig. 4 A–D). Consistent with the findings of Yoshikawa et al (14), who reported major redox linked conformational changes of subunit-I occurring in regions remote from the oxygen binding site, our analysis did not detect any movement of the protein backbone or the amino acid residues in regions close to the oxygen binding site (Fig. 4). In these circumstances, the proposed opening up of the ligand binding site as the enzyme switched from the ‘resting’ to the ‘pulsed’ state seems unlikely and unnecessary, as the binding site in all three forms of the bovine appeared totally unhindered (Figs. 3, 4). We therefore concluded that the slow binding of cyanide to oxidized Cox was not due to the existence of a ‘closed’ ligand binding site in that form of the enzyme.
While we continue to support the concept of the resting and pulsed forms of Cox, we think that the paradoxical kinetics of cyanide binding can be explained by consi-deration of the overall architecture of SU-I. We have already noted that this SU has an overall funnel shape, wide at the top but narrow toward the centre (Fig. 1 inset). Since our fitting showed that SU-I of bovine and theThermus thermophilius
ba3 Cox had the same general structure (Fig. 5A–D), we
conclude that the narrowing in the vicinity of the ligand binding site of the bovine enzyme corresponds to the oxygen channel of the ba3Cox identified by Lunaet al (29). We have
shown (Fig. 1) that only about 30% of SU-I is covered/ protected mainly by SU-II, exposing its internal regions to the contents of the intermembrane space. Under these conditions, it would be reasonable to conclude that pore B (13) is usually filled with oxygen-rich material. If another
ligand, eg cyanide, is presented to the enzyme, it cannot access the haem a3-CuB binding site until the ‘queued-up’
oxygen has been used up. If the enzyme is turning over, this would happen quickly, but if it is not turning over, binding of the alternative ligand will be slow. Hence, cyanide binds slowly to the fully oxidized Cox but rapidly if a suitable source of electrons is added.
So did this study take us any closer to understanding the resting to pulsed transition in Cox? It seems that the initial proposal (25, 26) which suggests that the enzyme must first become fully reduced holds the key. As in deoxy-haemoglobin (30), the iron ion at the centre of haem, in this case haem a3, is out of the haem plane (13). We are of the
view that, as is the case for haemoglobin (30), the initial trigger for the ‘resting to pulsed’ transition is the binding of oxygen to the ligand binding site, with pore B (13) serving as the oxygen reservoir. We are proposing that the binding of oxygen not only facilitates the full reduction of the enzyme, but also shifts the iron atom into the haem plane, initiating a range of conformational changes. We think that critical conformational changes are communicated from the ligand binding site in SU-I, to the enzyme’s substrate binding site on SU-II,viathe long chain hydrophobic tail of haem a3. Recall
this haem side chain comes very close to, probably forming hydrophobic bonds with, Pro-69 and Ile-34 of the transmembrane portion of this SU (Fig. 2). Finally, we propose that structural changes are induced in the vicinity of the cytochrome c binding site, leading to enhanced electron transfer rates as previously proposed (25, 26). In previous studies (31, 32), we proposed mechanisms for electron transfer within Cox; the challenge now will be to demonstrate those conformational changes that enhance electron transfer rates.
ACKNOWLEDGEMENT
We thank Professor Michael Wilson and the late Professor Peter Nicholls of Essex University for critical analysis and comments and for directing us to very important literature on this topic. We also thank Mr Michael Khan of The University of the West Indies, Centre for Medical Sciences Education, for his work on editing the figures.
REFERENCES
1. Ohta S, Ohsawa I. Dysfunction of mitochondria and oxidative stress in the pathogenesis of Alzheimer’s disease: on defects in the cytochrome c oxidase complex and aldehyde detoxification. J Alzheimers Dis 2006; 9:155–66.
2. Moreira PI, Santos MS, Seica R, Oliveira CR. Brain mitochondrial dysfunction as a link between Alzheimer’s disease and diabetes. J Neurol Science 2007;257:206–14.
3. Arnold S. The power of life – cytochrome c oxidase takes center stage in metabolic control, cell signalling and survival. Mitochondrion 2012; 12:46–56.
5. Van Gelder BF, Beinert H. Studies of the heme components of cytochrome c oxidase by EPR spectroscopy. Biochim Biophys Acta 1969;189:1–24.
6. Bisson R, Gutweniger H, Montecucco C, Colonna R, Zanotti A, Azzi A. Covalent binding of arylazido derivatives of cytochrome c to cytochrome oxidase. FEBS Lett 1977;81:147–50.
7. Briggs MM, Capaldi RA. Cross-linking studies on a cytochrome c-cytochrome c oxidase complex. Biochem Biophys Res Commun 1978; 80:553–9.
8. Capaldi RA, Prochaska L, Bisson R. Structure of cytochrome c oxidase. Adv Exp Med Biol 1980;132:197–210.
9. Kadenbach B, Jarausch J, Hartmann R, Merle P. Separation of mammalian cytochrome c oxidase into 13 polypeptides by a sodium dodecyl sulfate-gel electrophoretic procedure. Anal Biochem 1983; 129:517–21.
10. Steffens GC, Biewald R, Buse G. Cytochrome c oxidase is a three-copper, two-heme-A protein. Eur J Biochem 1987;164:295–300. 11. Scott RA, Li PM, Chan SI. The binuclear site of cytochrome c oxidase.
Structural evidence from iron X-ray absorption spectroscopy. Ann N Y Acad Sci 1988;550:53–8.
12. Tsukihara T, Aoyama H, Yamashita E, Tomizaki T, Yamaguchi H, Shinzawa-Itoh KN et al. The whole structure of the 13-subunit oxidized cytochrome c oxidase at 2.8 A. Science 1996;272:1136–44. 13. Iwata S, Ostermeier C, Ludwig B, Michel H. Structure at 2.8 A
resolution of cytochrome c oxidase from Paracoccus denitrificans. Nature 1995;376:660–9.
14. Yoshikawa S, Shinzawa-Itoh K, Nakashima R, Yaono R, Yamashita E, Inoue N et al. Redox-coupled crystal structural changes in bovine heart cytochrome c oxidase. Science 1998;280:1723–9.
15. Hill BC. Modeling the sequence of electron transfer reactions in the single turnover of reduced, mammalian cytochrome c oxidase with oxygen. J Biol Chem 1994;269:2419–25.
16. Paula S, Sucheta A, Szundi I, Einarsdottir O. Proton and electron transfer during the reduction of molecular oxygen by fully reduced cytochrome c oxidase: a flow-flash investigation using optical multichannel detection. Biochemistry 1999;38:3025–33.
17. Witt H, Malatesta F, Nicoletti F, Brunori M, Ludwig B. Tryptophan 121 of subunit II is the electron entry site to cytochrome-c oxidase in Paracoccus denitrificans. Involvement of a hydrophobic patch in the docking reaction. J Biol Chem 1998;273:5132–6.
18. Ashe D, Alleyne T, Wilson M, Syistunenko D, Nicholls P. Redox equilibration after one-electron reduction of cytochrome c oxidase: radical formation and a possible hydrogen relay mechanism. Arch Biochem Biophys 2014;554:36–43.
19. Oliveberg M, Malmstrom BG. Internal electron transfer in cytochrome c oxidase: evidence for a rapid equilibrium between cytochrome a and the bimetallic site. Biochemistry 1991;30:7053–7.
20. Brzezinski, P. Internal electron-transfer reactions in cytochrome c oxidase. Biochemistry 1995;35:5611–5.
21. Nicholls P. Control of cytochrome c oxidase: kinetic, thermodynamic or allosteric? In: Schuster S, Rigoulet M, Ouhabi R, Mazat JP, eds. Modern Trends in Biothermokinetics; Proceedings of the Fifth International Meeting; Bordeaux-Bombannes, France; 1992: 11–16. 22. Ferguson-Miller S, Brautigan DL, Margoliash E. Correlation of the
kinetics of electron transfer activity of various eukaryotic cytochromes c with binding to mitochondrial cytochrome c oxidase. J Biol Chem 1976;251:1104–15.
23. Errede B, Haight GP Jr, Kamen MD. Oxidation of ferrocytochrome c by mitochondrial cytochrome c oxidase. Proc Natl Acad Sci U S A 1976;73:113–7.
24. Speck SH, Dye D, Margoliash E. Single catalytic site model for the oxidation of ferrocytochrome c by mitochondrial cytochrome c oxidase. Proc Natl Acad Sci U S A 1984;81:347–51.
25. Antonini E, Brunori M, Colosimo A, Greenwood C, Wilson MT. Oxygen “pulsed” cytochrome c oxidase: functional properties and catalytic relevance. Proc Natl Acad Sci U S A 1977;74:3128–32. 26. Wilson MT, Peterson J, Antonini E, Brunori M, Colosimo A, Wyman J.
A plausible two-state model for cytochrome c oxidase. Proc Natl Acad Sci U S A 1981;78:7115–8.
27. Brittain T, Greenwood C. Kinetic studies on the binding of cyanide to oxygenated cytochrome c oxidase. Biochem J 1976;155:453–5. 28. Jones MG, Bickar D, Wilson MT, Brunori M, Colosimo A, Sarti P. A
re-examination of the reactions of cyanide with cytochrome c oxidase. Biochem J 1984;220:57–66.
29. Luna VM, Fee JA, Deniz AA, Stout CD. Mobility of Xe atoms within the oxygen diffusion channel of cytochrome ba3oxidase. Biochemistry 2012;51:4669–76.
30. Perutz MF. Stereochemistry of cooperative effects in haemoglobin. Nature 1970;228:726–34.
31. Alleyne T, Sampson VB. Early electron transfer in cytochrome c oxidase occurs by a chymotrypsin type relay. West Indian Med J 2009; 58:499–505.
32. Alleyne T, Ashe D. Hydrogen/hydride ion relay – a mechanism for early electron transfer in cytochrome c oxidases. West Indian Med J 2013;62:3–11.
Received23Feb2015 Accepted26Mar2015 Published 30 Sep 2015
Online:http://www.mona.uwi.edu/wimjopen/article/1648 ©Alleyneetal2015.