by Gary Venter and Rajesh Sahasrabuddhe
ABSTRACT
Consideration of parameter risk is particularly important when
building actuarial models of uncertainty. That is because—unlike
process risk—parameter risk does not diversify when modeling
a large volume of independent exposures. Without consideration
of parameter risk, decision makers may be tempted to underwrite
higher volumes as a result of the apparent high degree of pre
dictability in the mean outcome. However, the financial impact
of parameter error is magnified by volume and doing so could
have significant consequences for the firm. In this paper, we pre
sent an inventory of uncertainty models associated with various
approaches that actuaries use in estimating model parameters.
are estimated from observations from an
experi-ence period. We often adjust these observations in an attempt to correct for differences between the experience and exposure periods. The most com mon such adjustment is the trending of claims amounts. This adjustment is intended to remove this bias created by costlevel differences. How ever, if the data are not adjusted correctly then a bias may persist or possibly even be exacerbated. Furthermore, if the amount of the adjustment itself is uncertain, then it should be treated as an addi tional parameter in the model.
The purpose of this note is to demonstrate that, for common approaches for determining mean estimates of actuarial model parameters, there exist associated parameter uncertainty models. These uncertainty mod els are intended to address sampling risk, assuming that data bias can be addressed through adjustment. If that is not the case, sampling risk would include data bias. However, this note does not include details regarding the theory and derivation of those uncer tainty models. Readers should consult appropriate sources for that information.
There are (at least) four additional sources of uncer tainty that should be recognized.
Process risk refers to the inherent uncertainty of the insurance claims process. Process risk can diversify away, as discussed in Section 1.2.
While process risk is well understood, there is an additional class of risks that may broadly be catego rized as “specification error.” The uncertainty resulting from specification error is significant and potentially greater than all other sources of risk. Although that risk is outside the scope of this paper, it is important to understand that it exists and results from the following factors.
Model misspecification is the risk that the wrong model is being estimated and applied. For exam ple, this is the risk that we use an exponential model when the phenomenon follows a Pareto distribution. Insufficient parameter identification is also a type of model misspecification.
1. Introduction
For most actuarial modeling applications, model parameters are unknown and must be estimated. If the associated parameter estimation error is not rec ognized in the modeling, there is a good chance that a substantial portion of the adverse (and favorable) loss potential will appear to be diversified away in the aggregation process.
There is an old fable about buying eggs at 10¢ each and selling them for $1.00 per dozen, making up the difference by doing high volume. The misestimation of the required price is not diversified by volume. Rather, it is a systematic risk that has to be analyzed separately.
Similarly, parameter risk is a form of systematic risk that does not diversify with volume, although it may diversify across portfolios to some degree. In insurance, of course, we do not know the price of the product for any particular customer at the time of sale. We assume that, if the price is correct for the class, randomness associated with the outcome for any particular risk will diversify. However, if we have an error in the price of the class, that error will persist regardless of volume. The insurer needs to recognize that in selecting the appropriate price. (Adding vol ume can provide more data for future estimation, but it does not diversify current parameter risk the way it diversifies process risk.) This paper presents method ologies for estimating parameter risk that is present in actuarial models.
1.1. Sources of uncertainty
Parameter risk is the uncertainty as to whether the parameters are appropriate for the phenomenon that we are attempting to model. This uncertainty results from the following factors:
Sampling risk. Parameters are estimated from an observed sample. Parameter uncertainty results from differences between that sample and the population.
CVs [CV(L)2] which is the ratio of the variance divided
by the mean squared = Var (L)/E(L)2:
CV L Var L E L
E N Var X E X Var N E N E X
Var X E N E X
Var N E N
( ) ( )
( )
( ) ( ) ( ) ( )
( ) ( )
( ) ( ) ( )
( ) ( )
=
= + ×
=
× +
(1.4)
(1.5)
2
2
2
2 2
2 2
Actuaries often assume that the CV is constant for severity distributions.
Likewise, for frequency distributions the ratio of variance to mean is often assumed to be constant. We denote that ratio as VM and offer the following examples:
b For a Poisson distribution, VM is equal to 1. b For the negative binomial distribution with param
eters r and b, with mean r and variance r (1 + b),
VM is 1 + b, which is often taken as a constant as volume changes.
In any case, VM is constant under the addition of IID exposure units.
By substitution, we have
CV L CV X E N
VM E N
( ) ( )
( ) ( )
= + (1.6)
2
2
The numerators of (1.6) are constant under increase in exposure units and inflation, so CV(L)2 decreases
proportionally to the inverse of the expected number of claims, and thus can get quite small as volume increases. This is the problem with the collective risk model without parameter uncertainty. The volatility can get unrealistically low, leading the actuary to believe that there is no risk in large insurance port folios. This is a dangerous conclusion, as it would lead the insurer to write more business. If we also consider the risk that models for X and N may be incorrectly specified (see the example of the eggs), we understand that potential financial loss actually
increases with volume.
Actuarial model risk is a broad form of misspecifi cation risk that results from the possibility that the entire actuarial modeling framework may not be appropriate for the phenomenon being modeled. For example, we may model ultimate losses using a loss development model when ultimate claim amounts are not proportional to claim amounts as of the valuation date. Discussion of this risk, which may be significant, is beyond the scope of this paper.
Insufficient parameter identification results when we fail to recognize relationships in our models or fail to recognize that certain elements of our model are subject to uncertainty. Examples include: b Our model may not recognize correlations
between development factors in adjacent intervals. b We may not recognize that relativity between the
frequency for a class and the frequency for a base class is an estimated parameter.
1.2. Principles of diversification
One adhoc adjustment sometimes applied in order to capture parameter risk in risk modeling is to add further spread to the frequency and severity distribu tions. However, this approach only adds process risk which will wash out with diversification.
To illustrate the problem, consider applying uncer tain trend to the collective risk model. Let N be the random variable for the number of claims, and denote amount of the jth claim as X
j, where the claims amounts are all independent and identically distributed (IID) and independent of N. We then have:
∑
== L Xj
j N
(1.1)
1
E L( )=E N E X( ) ( ) (1.2)
Var L( )=E N Var X( ) ( )+E X Var N( )2 ( ). (1.3)
2. Parameter estimation methods
We address three common approaches of parameter estimation in this note. For the first two approaches there is a formal methodology for modeling the dis tribution of parameter fitting errors. This provides quantification of estimation risk.
b Regression analysis is used to estimate the param
eters of a dependency relationship. Although the category of regression analysis includes nonlinear approaches, this note focuses on linear approaches.
b Maximum likelihood estimation is most com
monly used in estimating frequency and severity distributions. The resulting parameters are referred to as maximum likelihood estimators (MLEs).
Although the last approach is less formal, it is no less subject to parameter risk and, in fact, it may be sub ject to greater parameter risk.
Model free methods are commonly used by actu aries in certain applications, such as estimation of claim development factors.
3. Parameter uncertainty models
3.1. Uncertainty in regression
parameters
When the data displays dependencies and is (approx imately) normally distributed after accounting for those dependencies, actuaries will often use regression to esti mate parameters. A common example exists with the modeling of the relationship between claim amounts (X ) and time (t), which is often modeled using the following relationship:
Yi=lnXi= β + β + ε0 1ti i (3.1)
where b0 is often referred to as the intercept and b1 is often referred to as the slope or regression coefficient.
We observe the following about this relationship:
b Using the logtransform of claim amounts implies
that claim values are lognormally distributed. This may be appropriate if the Xis are individual claim observations but possibly not if they are averages.
1.2.1. Uncertain trend example
We provide the following example to demonstrate how the aggregate claims random variable is affected by uncertain trend. Including the risk of uncertain trend or other systematic risk will put a minimum on
CV(L) that cannot be reduced by diversification (i.e., it is not inversely proportional to E(N)).
Let J denote a random trend factor with mean 1.00. We then have the following relationships:
( )=
E J 1 (1.7)
( ) ( )
( )
( ) =
=
CV J Var J
E J
Var J (1.8)
2
2
Our claims model and its characteristic functions for the trended claim amount K may be expressed as follows:
K JL= (1.9)
( ) ( )
( ) ( )
( ) = = =
E K E JL
E J E L
E L (1.10)
( ) ( )
( ) ( ) ( )
( ) ( ) ( )
( ) ( ) ( )
( ) ( )
=
= +
× + ×
= + ×
+ ×
Var K Var JL
E J Var L E L
Var J Var J Var L
Var L E L CV J
CV J Var L (1.11)
2 2
2 2
2
CV K
Var L E L CV J CV J Var L
E L
CV L CV J CV L CV J
)
) ) ) ) )
)
) ) ) )
(
( ( ( ( (
(
( ( ( (
= + +
= + + × (1.12)
2
2 2 2
2
2 2 2 2
We can now observe that CV(K) has a minimum of
b The standard error of mi, the estimator of µi obtained by substituting bs for bs, is calculated as follows:
N
t t N
y
i
t
i
(
)
( )
σ = σ + + −
− σ
µ 1
1
1 . (3.5)
2
2
Similar to equation (3.3), the scaled residuals of µi also follow Student’s tdistribution with N - 2 degrees of freedom.
c We can observe that, as N becomes large, i
σµ
approaches σy.
c The standard error increases as t
i is further from t
_ . c The (1 - a)% prediction interval is equal to
Yi±tN−2,1− ασµi. (3.6) 2
Particularly when fitting regression models to aver age values, N (and, by extension, (N - 2)) may be “small,” which leads to a Student’s tdistribution with considerable dispersion. This may result in “unreason able” parameter values for the regression parameters at higher or lower percentile levels. Excessive dis persion of estimators of parameters is consistent with lack of statistical significance of regression param eters. Issues related to the significance of regression parameters are outside the scope of this note. Readers should consult textbooks on regression analysis for the derivation of the formulae above or for a more complete understanding of the development of the uncertainty model.
3.2. Uncertainty in parameters
estimated by maximum likelihood
MLE has a builtin methodology for computing parameter uncertainty. We review the standard meth odology, which identifies an estimation variance for each parameter as well as the correlation of the estima tion errors among the parameters. This theory says that for large samples the distribution of parameters can be simulated as a multivariate normal. Then in a simula tion model each simulation could begin by simulating It also implies that the growth in claim amounts is
exponential rather than linear. This is a generally accepted assumption.
b Exponentiation of the regression coefficient b1 less
unity (i.e., eb1 - 1) represents an estimate of the
annual rate of severity trend.
b E(Yi | ti) = b0 + b1ti, often written as µi, is the mean of the distribution of the logs of the claim amounts at time ti.
We should recognize that regression techniques not only provide estimates of parameters such as b1
and quantities such as µi but also the uncertainty of those estimates. More specifically, for a regression on N data points, the estimated standard deviation of the regression error term ei of the regression may be expressed as:
σ = −
SSE N
y
2 (3.2)
where SSE refers to the sum of squared errors.1
We denote the sample standard deviation2 of the
observed times (tis) as st. The estimators then have the following properties, which are discussed in text books on regression.
b The standard error of b1 (the estimator of b1) may
be estimated as
σ = σ
σ N−
b
y
t
1. (3.3)
1
The residuals of b1, after subtracting b1 and scal
ing by the standard error of b1, follow a Student’s
tdistribution with N - 2 degrees of freedom.
b The (1 - a)% confidence interval is equal to
± − − ασ
b t
N b. (3.4)
1 2,1 2 1 N1
N2
1SSE is also sometimes referred to as the “error sums of squares” or
“residual sum of squares.”
this case the NLL. The Hessian of the NLL function is also referred to as the information matrix.4
3.2.2. Pareto example
In this section, we demonstrate the calculation for the Pareto distribution5 with the following properties:
F x( )= −1 x−α (3.9)
f x( )= αx−α−1 (3.10)
f x x
(
( ))
= ( )α + −α −( ) ( )ln ln 1 ln (3.11)
We then calculate the NLL as follows:
∑
∑
∑
∑
∑
( ) ( ) ( ) ( ) ( ) ( ) ( ) ( ) ( ) ( ) ( ) = −= − α + −α −
= − α + α +
= − α + α +
=
=
= =
=
NLL f x
x x n x i i n i i n i n i i n i i n ln
ln 1 ln
ln 1 ln
ln 1 ln . (3.12)
1
1
1 1
1
To solve for the MLE of a, we take the derivative of the NLL with respect to a and solve:
∑
∑
( )
( )
α = −α + =
α = = = dNLL d n x n x i i n i i n ln 0 ˆ
ln . (3.13)
1
1
To determine the variance of the MLE, we take second partial derivatives of the NLL as follows:
∂
∂α = α
NLL n . (3.14) 2 2 2 N4 N5
the parameters, and then those parameters would be used in simulating the process. The normal distribution is questionable for smaller samples, however. We show through Bayesian arguments that the gamma provides a good alternative. The gamma converges to the nor mal for large samples, so this approach is consistent with the usual largesample method. The parameters can be simulated using a normal copula with gamma marginals. Simulation by copulas is outside the scope of this note, so we leave it at that point.
The likelihood function (L) represents the prob ability that a sample is observed given a model and parameters. It is calculated as the product of probabil ity functions in the discrete case or density functions in the continuous case. As it is computationally more efficient, we generally work with the negative of the loglikelihood (NLL) which is the negative value of the sum of the logarithms of the probability (density) functions. Specifically, for a continuous model with density function f, we have:
L x
(
;θ =)
∏
f x( )i (3.7)NLL x
(
;θ = −)
∑
lnf x( )i . (3.8)The maximum of L occurs at the minimum of NLL. The minimum of NLL can often be calculated by set ting its derivatives with respect to the parameters of the probability (density) function to zero and solving for the parameters. However, in more complicated models the minimization must be done numerically.
3.2.1. Large samples
Part of the estimation theory for MLE finds that
for large N, the distribution of the parameter esti mates is asymptotically normal and the inverse of the
Hessian matrix (also referred to as the Hessian and denoted H) provides the variances and covariances of the parameters.3 The Hessian is comprised of the second partial derivatives of a function of interest, in
N3
3This is described in Loss Models by Panjer, Klugman, and Willmot (2005)
and other texts and papers on parameter estimation.
4Most optimization software will numerically calculate the information
matrix.
5In this paper, the “Pareto distribution” refers to the “single parameter
sample sizes get larger, the gamma approaches the normal, so using it is consistent with the asymptotic theory.
3.2.4. The Pareto example
Returning to our Pareto example, we recall that the log of a Pareto variate is exponentially distributed and the sum of exponentials is gamma. From (3.13), we recognize that the Pareto variates are in the denomi nator of the MLE of a. As a result, we understand that aˆ is inverse gamma distributed with mean and vari ance of estimators being aˆ and aˆ2/n, respectively. This
agrees with what was calculated is Section 3.2.2. The associated inverse gamma shape and scale parameters would be n + 2 and aˆ (n + 1), respectively.
It would be tempting to use this inverse gamma as the distribution of the true parameter given the fit. However, it is just the opposite—that inverse gamma is the distribution of the estimator given the true parameter. Especially with skewed distributions like the inverse gamma, these two distributions are not the same.
This is a natural setup for Bayesian analysis. We know the distribution of the estimator given the param eters but want the distribution of the parameters given the estimator. If the MLE were also the Bayes estimate from some prior distribution of the parameters, then Bayes’ theorem would provide the posterior distribu tion of the parameters given the estimate. This happens in one setting, and the resulting posterior distribution of the parameters turns out to be gamma in that case.
3.2.5. Bayes’ theorem
Bayes’ theorem provides a formula for the poste rior distribution for Y given X, using the distributions of X, Y and X given Y. That is:
(
)
(
)
( )( )
=
f Y X f X Y f Y
f X . (3.17)
We can think of Y as the true parameter, which is con sidered a random variable since it is not known, and
X as the data. Then, the prior distribution of Y is f (Y ) and f (X | Y) is the conditional distribution of the data With only one parameter, the H is a 1 × 1 matrix.
H= n α
2. (3.15)
H n
= α
−1 . (3.16)
2
So for large n, the maximum likelihood estimator of the Pareto parameter is normally distributed with mean = aˆ and estimation variance = aˆ2/n. N
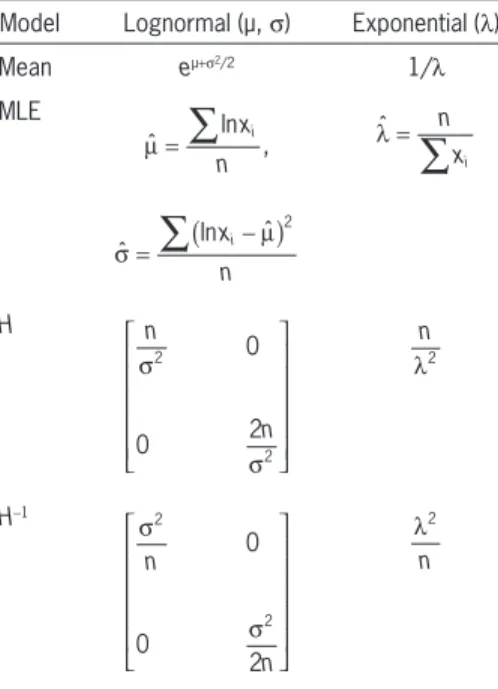
We leave it to the reader to verify the uncertainty mod els for the exponential and lognormal distributions in Table 1.
3.2.3. Limited samples sizes
For insurance samples the sample size is usually not asymptotic to infinity and the normal distribution often is inappropriate. For instance, a normal distri bution might imply too high a probability of negative values for parameters and functions of parameters that have to be positive. A reasonable alternative in that case is to use the gamma distribution for each parame ter, with the correlation structure of the multivariate normal. This can be implemented using the normal copula with gamma marginal distributions. As the
T1
Table 1. Examples
Model Lognormal (µ, s) Exponential (l)
Mean eµ+s2/2 1/
l MLE
ˆ
∑
ln ,µ = n xi λ =ˆ
∑
nxiˆ ln ˆ
2
∑
( )σ = xni− µ
H
0
0 2
2
2
σ
σ
n
n
2
λ n
H-1
0
0
2
2
2
σ
σ
n
n
2
Comparing this to the gamma density shows that the distribution of the parameter given the data is a gamma distribution with shape parameter n and mean = 1/average[lnxj]. This mean is the MLE for
a, which supports the use of this particular non informative prior. This gamma distribution is thus the posterior distribution for the true a, with mean equal to the MLE estimate.
A similar exercise for the Poisson with mean l and
n samples which have sum of observations S gives a gamma posterior distribution for l with mean S/n and shape parameter S. This again agrees with the MLE and has a gamma distribution for the true parameter. Both examples support the idea of using gamma dis tributions for the parameter uncertainty.
3.3. Uncertainty in model-free
estimators via bootstrapping methods
Development factors can be calculated within a parametric or modelfree framework. The factors them selves are parameters, but the distinction is whether or not a distribution is assumed for the deviation of the losses from what would be estimated by applying the factors, that is, for the distribution of the residu als of the development factor approach.
One method for quantifying the estimation errors of the factors is bootstrapping. This method resam ples the residuals and uses them to create new, arti ficial triangles. The factors are repeatedly estimated from these artificial triangles, and an empirical dis tribution of the factors is thus built up. Bootstrapping is a straightforward approach but has potential pit falls that require some care.
b For example, it should be recognized that there
are a different number of observations used in the estimation of successive incremental development factors, so each “parameter” has its own number of degrees of freedom. The degrees of freedom is an input to the resampling process. In nonlinear mod els, the degrees of freedom can be estimated by Ye’s method of generalized degrees of freedom (gdf) (Ye 1998). The gdf for an observed point, for an esti mation procedure, is the derivative of the fitted point with respect to the observed point. If that derivative given the parameter. We want to find the conditional
distribution of Y given X, and in that context f (X ) in equation (3.17) can be considered as a normalizing constant (not a function of Y) needed to make the dis tribution integrate to unity. As such, Bayes’ theorem can also be expressed as:
(
)
∝(
)
( )f Y X f X Y f Y (3.18)
where ∝ indicates proportionality—meaning equal up to factors not containing Y. This formulation allows the use of socalled noninformative priors—such as, in this case, f (Y ). The prior f (Y ) is thus expressed by suppressing factors not containing Y. This allows the prior f (Y ) itself to be expressed up to a constant fac tor, and in fact does not even have to integrate to a finite number as long as f (Y | X) does. This gives the possibility of prior distributions that are very spread out on the real line and so have little or no impact on the estimated parameters.
Common examples are f (Y ) ∝ 1 on the whole real line, or f (Y ) ∝ 1/Y on the positive reals. These can be expressed as limits of the same distributions on (-M, M) or (1/M, M ) as M grows without limit. Thus they are very diffuse. Such noninformative priors can give insights into the estimation uncertainty.
For the Pareto, the prior is for the parameter a, and for a positive parameter a useful noninformative prior is f (a) ∝ 1/a. The antiderivative of this prior is 1n(a), which slowly diverges at both ends of the posi tive real line. Thus it has infinite weight at both ends of the range, and as a result does not bias the param eter either up or down. In comparison, for a positive parameter, the prior f (a) ∝ 1 only diverges at the right end of the range, and tends to pull parameters up.
In this example, f (X | a) is the distribution of the observations given a. If P is the product of the obser vations, it is easy to show that
(
α ∝ α)
α+f X n P 1. (3.19)
If we substitute b=-ln1/P, we have
(
)
(
α ∝ α)
−βαnumber of reported claims). If the model uses just a factor, there might be some very high observed factors that would not apply in general but might when the first report is very low. Resampling can generate obviously inappropriate development in this case—such as a large residual combined with a large initial value—basically because the wrong model is being used to estimate claims at second report.
c Also, if there are calendaryear effects in the data
but not in the model, bootstrapping can again be distorted because it is resampling residuals of a model that does not apply.
If the development factors are estimated by MLE from a parametric model, the inverse of the Hessian (information matrix) can be used to quantify the param eter uncertainty in the factors, just as in any other MLE case. Clark (2003) gives an example of this. Comparison studies have found the results of this method to be comparable to bootstrapping the parameter uncertainty, and using the information matrix in this way avoids many of the pitfalls of bootstrapping. Most GLM software, even if based on quasilikelihood rather than MLE, will provide the parametererror covariance matrix. Thus there is little need to use bootstrapping, with all of its potential issues, in loss reserving.
4. Incorporating parameter risk
in simulation models
Actuaries typically use simulation to model risk and uncertainty. Parameter estimation is easily incorpo rated in a simulation through a twostage process: in each scenario, we first simulate the parameters from the parameterrisk distributions, and then simulate the process from the simulated parameters. If the param eters or the variables are correlated, simulation using copulas would be a convenient part of this process. Examples of this approach are as follows:
b In our example of uncertain trend from Section 2, we would first simulate aggregate claims from the col lective risk model, and then simulate J, which is then multiplied by the aggregate claims. This approach is one, the observed point has the power to pull the
model to it with an exact match. This would show up, for instance, in fitting a quintic polynomial to 6 points, which it can fit exactly, using up all the degrees of freedom. The gdf agrees with the usual notion of degrees of freedom in linear models, and is more appropriate in nonlinear models.
Even when using the gdf degrees of freedom for each point’s residual, however, bootstrapping is regarded as unreliable in small samples (e.g., less than 40 observations per fitted parameter). There are too few residuals to get a representative resample. This leads to the method of parametric bootstrapping, which draws from fitted distributions instead of the observed residuals. This would only be applicable in the case where there is a parametric model for the residuals. For instance, if residuals are assumed to be overdispersed Poisson, resampling can be done from this distribution.
b The approach outlined in England and Verrall (2002) uses Pearson residuals, rp, which are calculated using the following approach:
rp=
−
observation estimatedparameter
estimatedparameter1 2 . (3.21)
b A technical problem is that bootstrapping gives the distribution of the estimated parameters given the true parameters, but what is needed is the dis tribution of the true parameters given the estimated parameters. This difference will be important espe cially with asymmetric distributions. This is the same problem that was encountered in the Pareto example, and which there led to replacing the inverse gamma distribution by the gamma. This is a known problem with bootstrapping which is addressed in textbooks on the subject, but is beyond the scope of this note. b In development triangles, another pitfall of resam
pling is that the model might not hold for the data.
c For instance, in slowly developing lines, the first
on the manner in which the parameters are estimated. Interested readers should consult textbooks and other papers for details related to the theory on the param eter uncertainty models.
Acknowledgments
The authors wish to thank John A. Major, ASA, for his thoughtful and thorough review. Any errors that remain are the responsibility of the authors.
References
Clark, D. R., “LDF CurveFitting and Stochastic Reserving: A Maximum Likelihood Approach,” Casualty Actuarial Society Forum, Fall 2003, pp. 41–92.
England, P.D., and R.J. Verrall, “Stochastic Claims Reserving in General Insurance,” Presented to the Institute of Actuaries, January 2002.
Panjer, H.H., S.A. Klugman, and G.E. Willmot, Loss Models: From Data to Decisions, (3rd ed.), New York: Wiley, 3rd ed., 2008.
Ye, J., “On Measuring and Correcting the Effects of Data Min ing and Model Selection,” Journal of the American Statistical Association, March 1998, pp. 120–131.
results in a similar floor imposed on the simulated claims CV(K ).
b In our Pareto example, we first simulate the param eter value and then simulate claims based on that parameter.
Even if the process risk diversifies away, the param eter risk will not.
5. Conclusion
Parameter risk is one of the principal elements that have to be quantified to obtain reasonable represen tations of risky processes. In a loss simulation envi ronment, simulating from the collective risk model
without recognizing parameter risk will understate the actual risk. This is particularly true for highvolume lines where process risk will diversify away. Including parameter risk in models for these exposures is partic ularly important, as the financial impact of parameter errors is magnified by volume.