Copyright © 2015 Vilnius Gediminas Technical University (VGTU) Press Technika http://www.bjrbe.vgtu.lt
doi:10.3846/bjrbe.2015.21 OF ROAD AND BRIDGE ENGINEERING ISSN 1822-427X / eISSN 1822-4288
2015 Volume 10(2): 166–173
1. Introduction
A system of road transport should operate safely, it should not contaminate environment, use small amounts of fuel and have an ability to quickly and reliably carry passen-gers and cargo. For this purpose adapted infrastructure of Transport System (TS) must be constantly improved by reconstructing the existing intersections. Preparation of intersection reconstruction projects involves the use of various principles, criteria and evaluation methods.
A system of road transport involves vehicles, roads, road users and freight which closely interact. The inte-raction between these material elements takes place in an external environment. The process of transportation is aimed at achieving some positive results which could in-crease the efficiency of the TS. However, negative effects such as high accident rate cannot be avoided (Podvezko, Sivilevičius 2013). The main elements of urban transport infrastructure include: street network with intersections, bridges, viaducts, flyovers, vehicular traffic tunnels. En-gineering improvement of roads is in many cases inse-parable from the improvement of at-grade intersections, as one of the most hazardous engineering structures.
At-grade intersections in Lithuania are currently subjec-ted to intensive installation of different traffic engineering and safety measures (Abukauskas et al. 2013).
The driving speed, traffic lane width, and traffic safety (Lee, Park 2012; Mishra, Khasnabis 2012; Sarker et al. 2012; Zhou et al. 2011), fuel consumption and gas emissions (Song et al. 2012) as well as road user charges (Watts et al. 2012) depend on the geometrical parameters, amount and type of roads, city streets and intersections of the country.
Design and operation of the junction of road transport aims to provide maximum security and the lowest environ-mental pollution. Motor vehicle collisions with pedestrians (Kopczynski et al. 2011; Ptak et al. 2012; Sokolovskij, Prent-kovskis 2013) and bicycles (Loscorn et al. 2013) at inter-sections has an impact on the increase in the number of road accidents. Pedestrians, crossing intersections in small interval, reduce their capacity (Scott et al. 2013).
Caliendo and Guida (2012) are modeling and as-sessing conflicts at deregulated intersections. Bug et al. (2013), Li and Elefteriadou (2013) have analyzed traffic flows at the signalized intersections. Operational perfor-mance of their right-turn-one-red have been analyzed by
RESEARCH ON THE OPERATION OF ROUNDABOUTS BASED
ON THE SUSTAINABLE DEVELOPMENT PRINCIPLES
Henrikas Sivilevičius1, Gražvydas Paliulis2, Antanas Klibavičius†3, Vytautas Palevičius4 1Dept of Transport Technological Equipment, Vilnius Gediminas Technical University, Plytinės g. 27,
10105 Vilnius, Lithuania
2, 3, 4Dept of Urban Engineering, Vilnius Gediminas Technical University, Saulėtekio al. 11, 10223 Vilnius, Lithuania E-mails: 1[email protected]; 2[email protected]; 4[email protected] Abstract. The main elements of urban transport infrastructure include: the street network with intersections, bridges,
viaducts, flyovers, vehicular traffic tunnels. Unsignalized four-leg intersections and roundabouts is the largest “satu-rated transport flow” of the street network. Roundabouts which were designed as far back as 1970–1980 were well-functioning when the car ownership level was 180–200 veh/1000 inhabitants. Currently, when the level of car owner-ship comes to 520–560 veh/1000 inhabitants, unsignalized roundabouts operate in the “oversaturated flows” regime. The research results of the Vilnius Gediminas Technical University and other universities showed that when designing new or reconstructing existing intersections the indicators of territorial planning, transport planning, environmental protection, traffic safety should be considered. As a common indicator for assessing all other indicators a monetization (estimation in monetary terms) should be used. When preparing projects for intersection reconstruction it is recom-mended to apply a new method of intersection analysis and evaluation based on the principles of sustainable develop-ment of urban transport infrastructure.
Chen et al. (2013), and the results of capacity analysis of short left-turn lane have been delivered by Yao (2013), Yao and Zhang (2013). McGee et al. (2012) have proved that the red and yellow traffic light actuation time is very important. In order to increase the urban roundabout capacity and to improve traffic safety new roundabouts are installed or four-leg intersections, the effectiveness of which is not sufficient, are reconstructed.
Today, several different types of roundabouts are well-known („mini“, „double mini“, „dumb-bell“, „with tran-sition central island“, „with joint splitter islands“, „traffic signal controlled“, „assembled roundabouts“…) and it is possible to stipulate that they will be further developed in the future (Tollazzi, Renčelj 2014). In the literature, many analytical techniques allow the study of the performance (capacity, queues, delays, etc.) of roundabouts which are divided into two groups: analytical models and microsco-pic simulation models. Each method, when formulated, has to consider some aspects of roundabout circulation in comparison to others (geometric elements, vehicular flow, and user behavior) (Vaiana et al. 2013). Zirkel et al. (2013) explores the relationship between sight distance pa-rameters, crash rates, and operating speeds at low-volume single-lane roundabouts in the United States. The unders-tanding of the interaction of design, operations, and crash performance is a step forward in the development and ap-plication of performance-based standards for roundabouts. The specific objective of this paper (Zirkel et al. 2013) is to quantify the relationship between crash rates, sight distan-ce parameters, and operating speeds to present an approach to establishing performance-based standards that highway practitioners could adopt in roundabout design.
Capacity models based on the gap acceptance theory are widely used in unsignalized intersections and rounda-bout capacity analysis. These models are based on the statis-tical distribution of major vehicle headways (Vasconcelos et al. 2012). Traffic flows around roundabouts have been found to be dependent on origin-destination flows, but the true nature of this relationship has not been properly understo-od (Dixit 2012). The present analysis is based on either gap acceptance models or empirical models. These models do not properly account for the impact of origin-destination flows on roundabout operations. Obsu et al. (2014) focused on instantaneous traffic flow optimization in a roundabout using a macroscopic approach. The roundabout is modelled as a concatenation of 2×2 junctions with one main lane and secondary incoming and outgoing roads.
In the study (Wong et al. 2012), observational and questionnaire surveys were conducted to assess how the proposed roundabout marking system affected the driver behavior, level of service, and safety performance. The ve-hicle travel time, number of conflicts, crash incidence, and weaving movements were assessed before and after the im-plementation of the observation surveys, and the percei-ved safety, congestion level, and lane-changing difficulties were assessed through questionnaire surveys, respectively. According to Md Diah et al. (2011), a weaving section flow at a conventional roundabout traffic flow situation is being
modeled using Parallel Microscopic Simulation software. The results of the simulations indicate that slight chan-ges made to roundabout geometric design and weaving section flow parameters can affect the performance level of service (LOS) of the roundabout.
Single-lane modern roundabouts are one of the most important intersection types in the suburbs of Australia. Therefore, it is important to estimate their entry capacities (Qu et al. 2014). In the case study (Qu et al. 2014), an ana-lytical model based on the gap acceptance theory by incor-porating the effects on the existing vehicles is proposed.
Unsignalized intersections is the largest “bottle-neck” of urban transport infrastructure. When designing or reconstructing roundabouts and four-leg intersections the formerly literature sources especially emphasize the roundabout safety (FGSV… 2001): small number of conf-lict points between flows of different directions, lower driving speed, and, thus, less severe accident consequen-ces. However, research on roundabout functioning in Li-thuanian cities showed that in roundabouts with „over-saturated” traffic flows (degree of oversaturation above 0.85) and when the crossing pedestrian flows are higher than 200 pedestrians/h in both directions, the rounda-bout capacity decreases by 1.4–1.6 times, time losses for the vehicles entering the intersection increase, long queues of vehicles are formed (above 20 veh) and the roundabout ensures only D and E LOS according to the HBS/HCM recommendations (FGSV… 2001; Highway… 2010; Rogers 2009). Besides, compared to typical traffic-light controlled intersections, in roundabouts the work of traffic and pedestrian flows increases, as well as the time of vehicle movement in the roundabout, large land areas are required (4000–7200 m2) for the construction of roun-dabouts and this under high prices of land in the central part of the city (the price of 1 are of land is ~ 60 000 EUR) increases the total cost of roundabout construction. 2. Problem formulation and objectives
The majority of urban roundabouts in Lithuania were de-signed and built in the period 1970–1984, however, there are no normative documents (STR 2.06.01. 1999 Commu-nication System for Cities, Towns and Villages) or method-ology recommended for designing reconstruction of this type of intersections. The paper suggests methodology for calculating capacity and efficiency of roundabouts as of important component of transport infrastructure based on modern principles of sustainable urban development and taking into consideration the impact of pedestrian flows, time spent by vehicle in the intersection, number of accidents and conflict points depending on roundabout diameter and “weaving” of flows when moving in a circle.
The subject of research – capacity of roundabouts un-der oversaturated traffic flows when traffic delays are addi-tionally influenced by pedestrian flows.
The objective of research:
– to develop methodology for calculating the capaci-ty of roundabout entries and exits taking into account the priority pedestrian flows P21 and P22 which are in conflict with traffic flows;
– to assess indiscipline of the drivers entering and lea-ving the roundabout and to determine the impact of traffic rules violations on roundabout capacity.
Research methods
In the research of traffic and pedestrian flows a televi-sion camera was used where the amount of different traffic flows and their movement trajectories are filmed and later information about the flows are processed by the compu-ter. This allows in a slow-motion regime to analyze the tra-jectories if different entering vehicles in a circle, also dis-tribution in a circle between different exit directions (exit to the right, straight or to the left). The use of television camera makes it possible to make research both in small (roundabout inner diameter Dr < 25 m) as well as large (Dr = 300 m) roundabouts. During research and in proces-sing the flow data an assumption was made that the arrival of different vehicles to the roundabout is close to Poisson distribution (Klibavičius, Paliulis 2012).
3. Analysis of the operation of roundabouts and four-leg intersections using sustainable development principles Roundabouts in the cities of Lithuania were designed in the period 1970–1974 based on the standards recom-mending two traffic lanes for entries and three traffic lanes in a circle. Those intersections were well-function-ing when the car ownership level was 180–200 veh/1000 inhabitants. Currently, when the level of car ownership comes to 520–560 veh/1000 inhabitants it is necessary to determine if the existing intersections are able to sat-isfy the C LOS desired by the drivers (Road… 2006) or it is necessary to move to the new traffic control methods based on the sustainable urban development principles. In order to determine operational indices of roundabouts and to compare them with the similar (according to the size of traffic flows) four-leg intersections the long-term (2006–2013) research of traffic flows were carried out in 26 roundabouts and 22 four-leg intersections of the cen-tral part of Lithuanian cities and suburban area. Analysis of roundabout capacity depending on roundabout diam-eter was carried out in the University of Bochum (FGSV… 2001), Urban Engineering Department of Vilnius Gedimi-nas Technical University and Dresden Technical Univer-sity (Schnabel, Lohse 2011) and the research results have been summarized in design standards and capacity calcu-lation programs (Empfehlungen… 2011; FGSV… 2001). Diameter of the studied intersections Dr varied from 12 m to 99 m in the city centre up to 300 m in suburban area.
Design of transport infrastructure objects shall be carried out using sustainable development principles of transport systems the scheme of which is given in Fig. 1. Design of transport infrastructure objects taking into con-sideration the territorial planning indicators is carried out according to the total area of the territory required for the construction of intersection. Design of transport infrastructure objects taking into consideration the trans-portation indicators is carried out according to the work of traffic flows and intersection capacity (Table 1). When defining the work of traffic flows it is necessary to separa-tely determine the size of traffic flows in a circle formed
Fig. 1. Design of transport infrastructure objects using
sustainable development principles
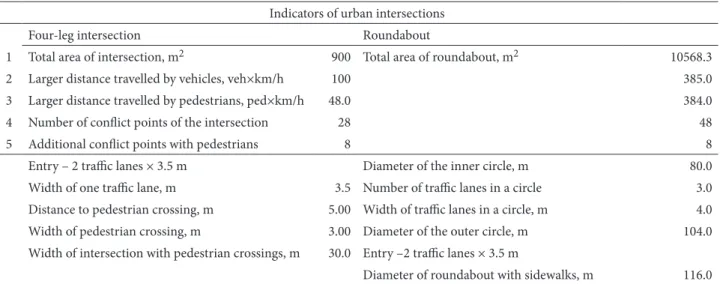
Table 1. Comparison of the parameters of roundabout and four-leg intersection
Indicators of urban intersections
Four-leg intersection Roundabout
1 Total area of intersection, m2 900 Total area of roundabout, m2 10568.3
2 Larger distance travelled by vehicles, veh×km/h 100 385.0
3 Larger distance travelled by pedestrians, ped×km/h 48.0 384.0
4 Number of conflict points of the intersection 28 48
5 Additional conflict points with pedestrians 8 8
Entry – 2 traffic lanes × 3.5 m Diameter of the inner circle, m 80.0
Width of one traffic lane, m 3.5 Number of traffic lanes in a circle 3.0
Distance to pedestrian crossing, m 5.00 Width of traffic lanes in a circle, m 4.0
Width of pedestrian crossing, m 3.00 Diameter of the outer circle, m 104.0
Width of intersection with pedestrian crossings, m 30.0 Entry –2 traffic lanes × 3.5 m
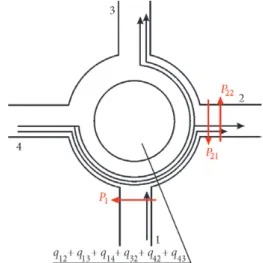
between separate entries. If in four-leg intersections this is easily determined with the help of digital television came-ras, in the roundabouts due to their large area and weaving of flows in a circle this stage of research requires much computer-time costs since it is not possible to use metho-dology for automatic vehicle image recognition, grouping and calculation. The scheme for calculating the size of traf-fic and pedestrian flows is given in Fig. 2.
A theoretical capacity of separate entry can be deter-mined by the formula (1) (Astarita, Guido 2014; Wu 2006):
, (1)
qe– basic capacity of one entry (maximum entry flow), veh/h; qc – traffic volume on the circle (flow on circulating lanes at the subject entry), veh/h; nc – number of circulat-ing lanes; ne – number of entry lanes (number of lanes in the subject entry); tg – critical gap, s; tf – follow-up time, s; (move-up time); tmin – minimum gap between succeeding vehicles on the circle (minimum headway between vehi-cles in the circulating lanes), s.
In order to avoid traffic jams within the roundabout in case of an accident the majority of earlier (1970–1988) designed roundabouts were designed according to the principle – the number of traffic lanes in a circle nc is higher than the number of traffic lanes on the entries ne and is determined by the formula (2):
nc = ne + 1. (2)
Vehicle movement parameters depend on flow com-position (Klibavičius 2007), circle diameter Dr (Rogers 2009; Schnabel, Lohse 2011), pavement condition in a cir-cle (especially in winter). Under the urban conditions of Lithuania the following time values were determined du-ring the research:
Minimum time between vehicles in a circle tmin = 1.2 s (in winter), 1.0 s (in summer).
Average time between vehicles in a circle (critical gap) tg = 4.1 s.
Average time between vehicles on the entry (move-up time) tf = 2.9 s.
Vehicle flow moving in a circle qc, which obstructs the entering flow qe, depends on the flow distribution of entering vehicles between different exits and flow mano-euvres when moving in a circle (Fig. 2) and is determined by the formula (3):
qc = q12 + q13 + q14 + q32 + q42 + q43. (3) Formula (1) was derived without taking into account pedestrian flows P1 and P2 conflicting with the entering and leaving vehicle flows. Actual flows shall be determi-ned by the formula (4) using the flow capacity reduction
coefficient kr which determines the impact of pedestrian flows. Based on the long-term research of traffic flows car-ried out by the authors under urban conditions of Lithuania the values of reduction coefficient kr are given in Table 2.
qpe = qe·kr , (4)
qpe – practical capacity of entries and exits, veh/h; qe – theo-retical capacity of entries and exits, veh/h; kr – flow capac-ity reduction coefficient (Table 2).
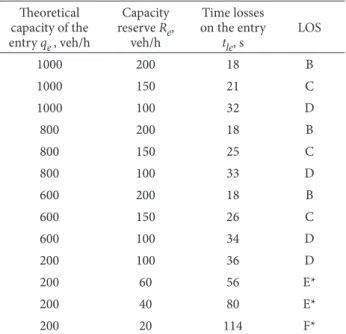
The quality of the movement of vehicles in the inter-section is described by the time losses of traffic flows (in seconds per one vehicle) on the entry to the intersection – tle (LOS – Level of Service) which in Lithuania is close to the values of other countries and is assumed by the Table 3.
Vehicles moving in the roundabouts when crossing the roundabout “to the right/ straight/ to the left” get an additional delay of 9/18/27 seconds. Pedestrians in the roundabouts get an additional delay (depending on roun-dabout diameter) of 54/96 seconds. Comparative trans-port indicators of intersections are given in Table 4. Table 4
Fig. 2. The scheme for calculating the size of traffic and pedestrian
flows P21, P22
Table 2. Reduction coefficient kr of entering and leaving flows taking into account the pedestrian flow P
The size of pedestrian flow P, ped/h
(in both directions)
Reduction coefficient krwhen traffic flow veh/h
on the entry on the exit
600 1000 600 1000
100 0.95 0.92 0.94 0.90
200 0.92 0.88 0.91 0.86
300 0.88 0.85 0.87 0.84
400 0.84 0.81 0.82 0.80
500 0.80 0.77 0.78 0.76
600 0.77 0.74 0.75 0.73
800 0.73 0.70 0.71 0.69
1000 0.66 0.62 0.63 0.61
shows that in roundabouts additional fuel consumption amounts to 638 400 liters of fuel.
Design and assessment of transport infrastructure objects taking into consideration the ecological indicators is carried out based on additional fuel consumption and additional pollutant emissions into environment. Amount of pollutant emissions is given in Table 5.
Design and operation of transport infrastructure objects taking into consideration the traffic safety indica-tors is carried out based on the number of accidents in the intersections and the number of conflict points in the in-tersection of different types.
The number of conflict points in four-leg inter-sections, depending on the number of traffic lanes, is
given in literature sources as 28–32 points (Schnabel, Loh-se 2011). The number of conflict points in roundabouts which in literature is given without taking into account the weaving of traffic flow trajectories in a circle depends on the following factors:
– traffic organization in a circle and the number of exits from the circle nout;
– inner diameter of roundabout circle Dr, m; – the size of the whole entering flows Σqe;
– the size of flow of a separate entry to the rounda-bout qe, veh/h;
– the size of flow moving in a circle qc, veh/h;
– part of flow distribution into separate exits of every entry to the roundabout qr (right), qd (directly), ql (left);
– the number of traffic lanes in a circle nc;
– the number of traffic lanes on the entry to the roun-dabout ne.
Based on the research of roundabout traffic flow tra-jectories in Lithuanian cities, carried out by the authors, a regression equation was obtained which allows calculating the number of conflict points ncs in the roundabout betwe-en separate betwe-entries and exits (Fig. 3):
. (5)
When the roundabout circle is provided with 3 traf-fic lanes and the entries – with 2 traftraf-fic lanes the values of regression coefficients are: al = 2.12, ad = 1.68, ar = 1.42, br = 0.27, bi = 0.18.
The number of conflict points in this roundabout is calculation according to the regression Eq (6):
. (6)
The number of conflict points in the roundabouts of the central part of the city on the circle traffic lanes is loca-ted every 12–14 meters and under Lithuanian urban con-ditions when the circle has three traffic lanes amounts to 68–72 conflict points.
According to the statistical data, in the roundabouts of the central part of the city the number of traffic acci-dents is 1.47 times higher compared to four-leg inter-sections and traffic-light controlled interinter-sections (Table 6). Similar indices were obtained also in the intersections of German cities (Schnabel, Lohse 2011).
For the design and evaluation of transport infras-tructure objects taking into consideration the recreational indicators (recommended for recreational areas) the fol-lowing criteria are suggested: the difference in a market price of 1 m2 of immovable property objects (economic evaluation), EUR/m2 for the objects situated close or furt-her from transport infrastructure objects.
Table 3. Time losses of traffic flows and the level of service on
the entry to the intersection Theoretical
capacity of the entry qe, veh/h
Capacity reserve Re,
veh/h
Time losses on the entry
tle, s LOS
1000 200 18 B
1000 150 21 C
1000 100 32 D
800 200 18 B
800 150 25 C
800 100 33 D
600 200 18 B
600 150 26 C
600 100 34 D
200 100 36 D
200 60 56 E*
200 40 80 E*
200 20 114 F*
* reconstruction is necessary (Highway… 2010).
Table 4. The work of traffic flows in roundabouts and four-leg
intersections
Indicator intersectionFour-leg Round-about
Work of traffic flows veh×km/h 100 385.0
Work of pedestrian flows ped.×km/h 48.0 384.0 Work of traffic flows veh×km/year 224 000 862 400
Fuel consumption l/year 22 400 86 240
Table 5. Amount of air pollutants in roundabouts and four-leg
intersections
Pollutants intersectionFour-leg Roundabout
1. СО, kg/year 1747 6726
2. CH, kg/year 332 1276
3. NO2, kg/year 235 905
4. SO2, kg/year 11.2 43
Design of transport infrastructure objects based on sustainable development principles is carried out by mo-netizing (estimating in monetary value) all the indicators (Table 7, Fig. 4), assuming the prices of various factors and applying both the Lithuanian (Road… 2006) and foreign methodologies (Empfehlungen… 2011).
4. Conclusions
1. When preparing new projects of urban transport infra-structure objects – street segments, intersections, traffic control, traffic-light control and management it is neces-sary by applying the sustainable urban development princi-ples to assess not only the intersection capacity but also the territorial planning, ecological and traffic safety indicators. 2. When assessing territorial planning indicators the following criteria are used: the total area of the territory necessary for building roundabout or four-leg intersection of appropriate capacity; economic evaluation of the total area – the price of land plot.
3. When assessing transportation indicators the follo-wing criteria are recommended: the work of traffic flows, the work of pedestrian flows, economic evaluation of the work of traffic and pedestrian flows. When calculating a capacity of the whole roundabout or separate entry to the roundabout qe and the reserve of existing capacity Re for urban intersections it is necessary to assess the size of pe-destrian flows conflicting with traffic flows on the entries and exists P1 and P2. When designing new or reconstruc-ting exisreconstruc-ting roundabouts in the city it is recommended that the number of traffic lanes in a circle nc is higher than the number of traffic lanes on the entry ne.
4. The average vehicle waiting time losses twunder oversaturated flows in roundabouts meet only the E and F level of service. The average length of vehicle queue nwe on the entry to the intersection under oversaturated flows amounts to 88–92 vehicles per peak hour blocking adja-cent intersections. When calculating the capacity of sepa-rate traffic lanes on the entries and exists it is necessary to take into consideration not only the size of traffic flows, the length of vehicle queues but also pedestrian flows which reduce capacity.
5. When assessing ecological indicators the following criteria are used: traffic-generated noise level and amount of exhaust gases in the intersection by different pollutant components taking into account the work of traffic flows; economic evaluation of ecological indicators – losses for the national economy due to environmental pollution.
6. When assessing traffic safety indicators the follo-wing criteria are used: the number of fatal and injury acci-dents per year and the number of damage-only acciacci-dents per year; economic evaluation of traffic safety indicators – losses for the national economy due to traffic accidents, Euro/year. The number of conflict spots in roundabouts, influencing traffic safety of the roundabout, depends on the size of flow, flow distribution between separate exits, roundabout diameter and in 99.0 m diameter rounda-bout the number of conflict points is 72. Analysis of 2004– 2013 statistical data of roundabout accidents in Vilnius and
Klaipėda cities showed that when the capacity of rounda-bout entries has been already used (oversaturation degree of the flows gsat > 0.85) the number of fatal, injury and da-mage-only accidents is ~ 1.47 times higher compared to
Fig. 3. The scheme of conflict points in roundabouts: – when
manoeuvring in a circle; – on the entries in a circle
Table 6. Accidents in four-leg intersections and roundabouts in
Vilnius, 2006–2010 (Klibavičius, Paliulis 2012)
Traffic accidents intersectionFour-leg Roundabout
1. Fatal accidents 1 1
2. Injury accidents 11 14
3. Damage-only accidents 38 53
Table 7. Economic indicators for the operation of roundabouts
and four-leg intersections
Indicator Objective
1. The price of land plot, EUR/year min
2. Fuel price, EUR/year min
3. Vehicle operating costs, EUR/year min
4. Environmental losses caused by pollution
with exhaust gases, EUR/year min
5. Accident losses, EUR/year min
Fig. 4. Economic comparison of intersection and roundabout
that in the intersections similar by their flow size (2+2 traf-fic lanes) where traftraf-fic flows are controlled by traftraf-fic-lights. 7. When assessing recreation indicators (recommen-ded for recreational areas) the following criteria are sug-gested: the difference in a market price of 1 m2 of immova-ble property objects (economic evaluation), EUR /m2 for the objects situated close or further from transport infras-tructure objects.
8. When assessing a payback of the whole project the methods of monetization (estimation in monetary value) should be used giving a possibility to make an accurate evaluation of not only the existing situation but also of the long-term effects of project impact.
References
Abukauskas, N; Sivilevičius, H.; Puodžiukas, V.; Lingytė, I. 2013. Road Safety Improvement on at-Grade Intersections, The
Baltic Journal of Road and Bridge Engineering 8(3): 212–219.
http://dx.doi.org/10.3846/bjrbe.2013.27
Astarita, V.; Guido, G. 2014. Analysis of Non-Conventional Roundabouts Performances through Microscopic Traffic Sim-ulation, Applied Mechanics and Materials 505–506: 481–488. http://dx.doi.org/10.4028/www.scientific.net/AMM.505-506.481 Bugg, Z.; Rouphail, N. M.; Schroeder, B. 2013. Lane Choice
Model for Signalized Intersections with an Auxiliary through Lane, Journal of Transportation Engineering 139(4): 371–378. http://dx.doi.org/10.1061/(ASCE)TE.1943-5436.0000513 Caliendo, C.; Guida, M. 2012. Microsimulation Approach for
Predicting Crashes at Unsignalized Using Traffic Conflicts,
Journal of Transportation Engineering 138(12): 1453–1467.
http://dx.doi.org/10.1061/(ASCE)TE.1943-5436.0000473 Chen, X.; Qi, Y.; Liu, G. 2013. Empirical Study of Gap-Acceptance
Behavior of Right-Turn-on-Red Drivers on Dual Right-Turn Lanes, Journal of Transportation Engineering 139(2): 173–180. http://dx.doi.org/10.1061/(ASCE) TE.1943-5436.0000489 Dixit, V. V. 2012. Modeling Origin-Destination Effects on
Round-about Operations and Infloixi Control, Journal of
Transporta-tion Engineering 138(8): 1016–1022.
http://dx.doi.org/10.1061/(ASCE)TE.1943-5436.0000394 Empfehlungen für Wirtschaftlichkeitsuntersuchungen an
Straßen. (Aktuelle Redaktion). 2011, 55S.
FGSV. 2001. Handbuch für die Bemessung von Straβenverkehrsanlagen (HBS, 2001 Germany Highway Capacity Manuel). Forschungsgesellschaft für Straβen-and Verkehrswesen (Hrsg.), No 299, FGSV Verlag GmbH, Köln.
Highway Capacity Manual (HCM) 2010. Transportation
Re-search Board. Washington DC. 2010. 1024 p.
Kopczyński, A.; Ptak, M.; Harnatkiewicz, P. 2012. The Influence of Frontal Protection System Design on Pedestrian Passive Safety, Archives of Civil and Mechanical Engineering 11(2): 345–364.
Klibavičius, A.; Paliulis, G. M. 2012. Increasing the Capacity of Intersections by Short Traffic Lanes, Transport 27(1): 67–72. http://dx.doi.org/10.3846/16484142.2012.666764
Klibavičius, А. 2007. Issledovanie propusknoy sposobnosti kol’tsevykh perekrestkov. Social and Economic Problems of Town Transport Systems and Areas of Their Influence De-velopment. Proceeding Materials. Ekaterinburg, p. 130–136.
Lee, J.; Park, B. B. 2012. Determining Lane Use Distribution Using Basic Freeway Segment Density Measures, Journal of
Transportation Engineering 138(2): 210–217.
http://dx.doi.org/10.1061/(ASCE)TE.1943-5436.0000313 Li, Z.; Elefteriadou, L. 2013. Minimizing the Traffic Throughput
of Turn Bays at a Signalized Intersection Approach, Journal of
Transportation Engineering 139(5): 425–432.
http://dx.doi.org/10.1061/(ASCE)TE.1943-5436.0000514 Loscorn, J.; Mills, A. F.; Brady, J. F.; Duthic, J. C.; Machemehl,
R. B. 2013. Effects of Bicycle Boxes on Bicyclist and Motorist Behavior at Intersections in Austin, Texas, Journal of
Trans-portation Engineering 139(10): 1039–1046.
http://dx.doi.org/10.1061/(ASCE)TE.1943-5436.0000584 McGee, H.; Mariarty, K.; Gates, T. J. 2012. Guidelines for Timing
Yellow and Red Intervals at Signalized Intersections,
Trans-portation Research Record 2298: 1–8.
http://dx.doi.org/10.3141/2298-01
Md Diah, J.; Abdul Rahman, M. Y.; Adnan, M. A.; Hooi Ling, K. 2011. Modelling the Relationship Between Geometric Design and Weaving Section Flow Process of Conventional Rounda-bouts, Journal of Transportation Engineering 137(12): 980–986. http://dx.doi.org/10.1061/(ASCE)TE.1943-5436.0000290 Mishra, S.; Khasnabis, S. 2012. Optimization Model for Allocating
Resources for Highway Safety Improvement at Urban Intersec-tions, Journal of Transportation Engineering 138(5): 535–547. http://dx.doi.org/10.1061/(ASCE)TE.1943-5436.0000364 Obsu, L. L.; Goatin, P.; Kassa, S. M. 2014. Gradient-Base
Instan-taneous Traffic Flow Optimization on a Roundabout, HAL
Archives-Outverters: 1–12. Available from Internet: https://
hal.inria.fr./hal-00935351
Podvezko, V.; Sivilevičius, H. 2013. The Use of AHP and Rank Cor-relation Methods for Determining the Significance of the In-teraction between the Elements of a Transport System Having a Strong Influence on Traffic Safety, Transport 28(4): 389–403. http://dx.doi.org/10.3846/16484142.2013.866980
Ptak, M.; Rusinski, E.; Kazlinski, J.; Dragan, S. 2012. Evaluation of Kinematics of SUV to Pedestrian Impact-Lower Leg Im-pactor and Dummy Approach, Archives of Civil and
Mechani-cal Engineering 12(1): 68–73.
http://dx.doi.org/10.1016/j.acme.2012.03.016
Qu, X.; Ren, L.; Wang, S.; Oh, E. 2014. Estimation of Entry Ca-pacity for Single-Lane Modern Roundabouts: Case Study in Queensland, Australia, Journal of Transportation Engineering
140(7): CID: 05014002.
http://dx.doi.org/10.1061/(ASCE)TE.1943-5436.0000675
Road Investment Manual. 2006. Road and Transport Research
In-stitute, Kaunas, 2006, 88 p.
Rogers, M. 2009. Highway Engineering. 2nd edition. Dublin: Blackwel Publishing. 336 p.
Sarker, B. R.; Baylot, E. A.; Green, J. G.; Biswas, P. 2012. Con-voy Movement: Consideration of Burning Geometrics for Se-lected Vehicle Shapes, Journal of Transportation Engineering
138(5): 502–511.
http://dx.doi.org/10.1061/(ASCE)TE.1943-5436.0000359 Schnabel, W.; Lohse, D. 2011. Grundlagen der
Scott, A. C.; Swenson, L. J.; Bentzen, B. L.; Barlow, J. M. 2013. Countdown-only Pedestrian Change Interval Displays. Effect on Signal Recognition by Pedestrians with Reduced Visual Acuity, Transportation Research Record 2384: 10–17. http://dx.doi.org/10.3141/2384-02
Sokolovskij, E.; Prentkovskis, O. 2013. Investigating Traffic Ac-cidents: the Interaction Between a Motor Vehicle and Pedes-trian, Transport 28(3): 302–312.
http://dx.doi.org/10.3846/16484142.2013.831771
Song, G.; Yu, L.; Tu, Z. 2012. Distribution Characteristics of Ve-hicle-Specific Power on Urban Restricted-Access Roadways,
Journal of Transportation Engineering 138(2): 202–209.
http://dx.doi.org/10.1061/(ASCE)TE.1943-5436.0000318
STR 2.06.01:1999. Miestų, miestelių ir kaimų susisiekimo sistemos
[Communication System for Cities, Towns and Villages]. Vil-nius, 2012. 48 p.
Tollazzi, T.; Renčelj, M. 2014. Comparative Analyse of the Two New Alternative Types of Roundabouts-Turbo and Flower Roundabout, TheBaltic Journal of Road and Bridge Engineer-ing 9(3): 164–170. http://dx.doi.org/10.3846/bjrbe.2014.21 Vaiana, R.; Galleli, V.; Iuele, T. 2013. Sensitivity Analysis Traffic
Microscopic Simulation Model for Roundabouts, TheBaltic
Journal of Road and Bridge Engineering 8(3): 174–183.
http://dx.doi.org/10.3846/bjrbe.2013.22
Vasconcelos, L.; Silva, A. B.; Seco, A.; Silva, J. 2012. Estimating the Parameters of Cowan’ M3 Headway Distribution for Rounda-bout Capacity Analyses, The Baltic Journal of Road and Bridge
Engineering 7(4): 261–268.
http://dx.doi.org/10.3846/bjrbe.2012.35
Watts, M. V.; Zech, W. C.; Turochy, R. E.; Holman, D. B.; LaMon-dia, J. J. 2012. Effects of Vehicle Volume and Lane Closure Length on Construction Road User Costs in Rural Areas,
Transportation Research Record 2268: 3–11.
http://dx.doi.org/10.3141/2268-01
Wong, S. C.; Sze, N. N.; Loo, B. P. Y.; Chow, A. S. Y.; Lo, H. K.; Hung, W. T. 2012. Performance Evaluations of the Spiral-Marking Roundabouts in Hong Kong, Journal of
Transporta-tion Engineering 138(11): 1377–1387.
http://dx.doi.org/10.1061/(ASCE)TE.1943-5436.0000433 Wu, N. 2006. Capacity Enhancement and Limitation at
Round-abouts with Double-Lane or Flared Entries, in Proc. of the
5th International Symposium on Highway Capacity and
Quality of Service: vol 2.25–29 July, 2006, Yokohama, Japan:
459–468.
Yao, R. 2013. Sensitivity Analysis of Optimization Models for Two Adjacent Intersections with Correlated Short Left-Turn Lanes, Transport 28(3): 256–269.
http://dx.doi.org/10.3846/16484142.2013.829781
Yao, R.; Zhang, M. 2013. Optimal Allocation of Lane Space and Green Splits of Isolated Signalized Intersections with Short Left-Turn Lanes, Journal of Transportation Engineering
139(7): 667–677.
http://dx.doi.org/10.1061/(ASCE)TE.1943-5436.0000551 Zhou, S.; Sun, J.; An, X.; Li, K. 2011. The Development of a
Con-flict Hazardous Assessment Model for Evaluating Urban In-tersection Safety, Transport 26(2): 216–223.
http://dx.doi.org/10.3846/16484142.589494
Zirkel, B.; Park, S; McFadden, J.; Angelastro, M.; McCarthy, L. 2013. Analysis of Sight Distance, Crash Rate, and Operating Speed Relationships for Low-Volume Single-Lane Rounda-bouts in the United States, Journal of Transportation
Engi-neering 139(6): 565–573.
http://dx.doi.org/10.1061/(ASCE)TE.1943-5436.0000532