THE BALTIC JOURNAL OF ROAD
AND BRIDGE ENGINEERING 20 1 8/13 (3) ISSN 1822-427X/eISSN 1822-4288
2018 Volume 13 Issue 3: 331–343 https://doi.org/10.7250/bjrbe.2018-13.420
* Corresponding author. E-mail: dimoskif@civil.auth.gr
Copyright © 2018 The Author(s). Published by RTU Press
This is an Open Access article distributed under the terms of the Creative Commons Attribution
BRIDGE QUALITY APPRAISAL METHODOLOGY:
APPLICATION IN THE STRIMONAS BRIDGE.
CASE STUDY
DIMOSTHENIS KIFOKERIS1*, YIANNIS XENIDIS2, PANAGIOTIS PANETSOS3,
JOSÉ ANTÓNIO CAMPOS E MATOS4, LUÍS BRAGANÇA5
1,2School of Civil Engineering, Aristotle University of Thessaloniki,
Thessaloniki, Greece
3Dept of Maintenance, Egnatia Odos S.A., Thermi, Greece
4,5Dept of Civil Engineering, University of Minho, Guimarães, Portugal
Received 24 November 2017, accepted 23 August 2108
Abstract. In the current utilization of Performance Indicators for bridge Quality Control, there is no correlation between observed and benchmarked Performance Indicator values, and an ambiguity of deliverables due to the diverse nature of Performance Indicators. For the alleviation of those above, this paper presents a methodology that appraises the quality of bridges. This methodology builds on the adaptation of the Sustainable Building Method and its combination with expert input solicitation methods and the research findings of COST Action TU1406. In addition, it features an adaptation of the Analytical Hierarchy Process. The methodology is presented regarding its general procedural steps and calculating requirements, and then it is tailored to the case study of Strimonas Bridge in Greece.
THE BALTIC JOURNAL OF ROAD AND BRIDGE ENGINEERING 20 1 8/13 (3)
Introduction
The use of Performance Indicators (PIs) for bridge Quality Control (QC) offers the following advantages:
• the to-the-point expression and measurement of crucial bridge quality aspects, such as sustainability (Padgett & Tapia, 2013), serviceability (Liang, Wu, Huston, Liu, Li, Gao, & Ma, 2018), and safety (Zhang & Wang, 2017);
• their measurement diversity, since it is possible to obtain the application data in various ways (e.g., field measurements, laboratory experiments, or expert input) (Ghosn, Dueñas-Osorio, Frangopol, McAllister, Bocchini, Manuel, ... & Akiyama, 2016);
• aiding in decision-making for lifecycle provision, along with the current quality assessment (Frangopol, Dong, & Sabatino, 2017) and
• the existence of lessons-learned from the implementation of PIs in project management (Barone & Frangopol, 2014).
Each framework of analysis utilizes distinct procedures to extract and process PIs (Frangopol, Strauss, & Kim, 2008). However, in bridge QC, frameworks where measured PI values are correlated with their benchmark values of expected and best achievable performance, are so far missing from the current relative implementation. It is possible for such a correlation to allow for a deeper understanding of the nature of the PIs, their context within certain quality performance aspects (Key Performance Indicators (KPIs), as defined by TU1406), and the way to improve such aspects. In addition, due to the diversity of the PIs, the deliverables of existing frameworks are often ambiguous.
In this paper, a general methodology to appraise the quality of bridges is presented, and then it is tailored for the case study of the Strimonas Bridge in Greece. The presented methodology aims to alleviate the drawbacks above in PI-oriented bridge QC, by:
• incorporating benchmark PI values,
• producing concise quality performance values for the components and the whole bridge, and
• monitoring the intermediate procedural levels through a clear and systematic structure of the methodology.
1. Methodology
Strauss, Ivankovic, Matos, & Casas (2016) have so far identified 55 PIs, clustered under the following broader categories:
Dimosthenis Kifokeris, Yiannis Xenidis, Panagiotis Panetsos, José António Campos e Matos, Luís Bragança
Bridge Quality Appraisal Methodology: Application in the Strimonas Bridge. Case Study
• material properties,
• the condition of auxiliary and protective equipment,
• structural geometry changes,
• bearing capacity,
• structural integrity and joints defects,
• attributes of the original design and construction sequence,
• dynamic behavior,
• auxiliary characteristics, and
• component cost and importance.
The PI values are obtained, depending on the case, during the inspection, monitoring, and maintenance processes, through common ways such as measurements and observations using the particular equipment.
The PIs are discretized between the following eleven identified KPIs, thus providing the respective quality: availability, costs, durability, environment, health, maintainability, politics, rating/inspection, reliability, safety, and security. It is possible to assign specific PIs to multiple KPIs (Strauss, Ivankovic, Matos, & Casas, 2016). In addition, depending on the case study, some PIs are potentially omitted or restated (Strauss, Ivankovic, Matos, & Casas, 2016). However, all eleven
KPIs are present in all cases (Strauss, Ivankovic, Matos, & Casas, 2016). These PIs and KPIs are presently used as input for the adaptation of the Sustainable Building (SB) Method – a generic framework for building sustainability performance assessment (Mateus & Bragança, 2011) – into a methodological framework for bridge QC. Mainly, the SB method initially features the following steps (Mateus & Bragança, 2011):
• identification of the dimensions of the sustainability performance observed in a building;
• discretization of these dimensions into specified subdimensions called Indicator Group Categories (IGCs);
• discretization of IGCs into PI notations, namely the various basic elements constituting the IGCs;
• discretization of the PI notations into Indicator Parameters (IPA). The IPAs are quantified and benchmarked through:
• the actual (real practice) values obtained during the inspection, monitoring, and maintenance processes,
• the conventional (standard practice) values, namely the base thresholds derived from regulatory frameworks and practical experience, and
• the best practice values, namely the optimal thresholds, derived from regulatory frameworks and state-of-the-art.
THE BALTIC JOURNAL OF ROAD AND BRIDGE ENGINEERING 20 1 8/13 (3)
• relative weights assignment for:
• the IPAs related to the respective PI notation,
• the PI notations related to the respective IGC,
• the IGCs related to the respective sustainability dimension, and
• the sustainability dimensions related to the overall sustainability performance of the building; this is required, since the importance of the respective elements is potentially unequal to the group in which they belong.
• calculation of the sustainability score of the building, by systematically using weighted sum utility functions: from the IPAs to the PI notations, from the PI notations to the IGCs, from the IGCs to the sustainability dimensions, and from the latter to the overall building sustainability score. The final score is within the interval [0, 1].
While adapting the SB Method for bridge QC several adjustments utilizing the PIs and KPIs of TU1406 are made, such as the replacements:
• of the IPAs with the TU1406 PIs,
• of the IGCs with the TU1406 KPIs,
• of the sustainability dimensions with the bridge components. The method applied to compute the relative weights of the PIs, KPIs and bridge components is the same for all three cases, so it is at this moment presented only for the PIs. The implemented methodological steps are the following:
1. importance rating of the g PIs (g = {1, 2, …, l}) connected to each of the h KPIs (h = {1, 2, …, m}) using a 5-point Likert scale, ranging from 1 (not important) to 5 (very important); for such rating, the input is solicited from k (k = {1, 2, …, n}) experts appropriately, such as with a questionnaire survey (Shao, Yuan, & Li, 2017); 2. processing of the input of each of the k experts via the Row
Geometric Mean Method (RGMM) variation of the Analytical Hierarchy Process (AHP) (Ishizaka & Labib, 2011), to calculate each of wPI kgh, , which is the relative weight of the gth PI corresponding to the hthKPI according to the kth expert;
3. consolidation of all wPI kgh, for all n experts to calculate WPIgh, namely the relative weight of the gth PI corresponding to the hthKPI according to all experts, via an AHP results consolidation methodology developed by Goepel (2013) that incorporates the Eigenvector Method (EVM) variation of the AHP (Alonso & Lamata, 2006), and the Weighted Geometric Mean Method (WGMM) (Xu, 2000).
As mentioned above, the same procedure is implemented to calculate
Dimosthenis Kifokeris, Yiannis Xenidis, Panagiotis Panetsos, José António Campos e Matos, Luís Bragança
Bridge Quality Appraisal Methodology: Application in the Strimonas Bridge. Case Study
After the assignment of all relative weights and following the steps of the SB Method, the values of actual measurement Pgh, standard practice
Pgh*, and best practice Pgh* for each of the PIs are obtained; finally, the normalized value Pghnorm of the gth PI affecting the hth KPI is computed (Mateus & Bragança, 2011).
Finally, the following boundary conditions are applied to produce
Pghnorm* the calibrated normalized values and their weighted aggregation
into the KPIs, and to avoid distortions in the calculation of the Pghnorm values:
• ifPghnorm > 1.2, then 1 2. P
ghnorm* = 1.2 (International Initiative..., 2009);
• if Pghnorm –0.2, then 0 2. P
ghnorm* = –0.2 (International Initiative..., 2009);
• if Pgh =Pgh*=Pgh*, then Pghnorm*= 1; • if PPghghPPgh*gh*=PPghgh**, then Pghnorm*= 0; • in any other case Pghnorm* = Pghnorm.>1 2.
Having all Pghnorm* values, the next steps presented in the sequence of implementation are:
• the calculation of the quality performance of the hth KPI corresponding to the uth component,
• the computation of the quality performance of the uth component, and
• the calculation of the quality performance of the whole bridge as a system.
Qbridge is the final deliverable of the showcased methodology. It is the qualitative normalized score depicting the quality performance of the bridge, regarding the relative KPIs and PIs.
2. Application of the methodology in the Strimonas
Bridge case study and results
The Strimonas Bridge, which is depicted in Figure 1, is located at coordinates 40°48’4”N, 23°51’20”E. It intersects the Greek part of the Strimonas river, and is part of the 670-km-long Egnatia Motorway (from Igoumenitsa to Kipoi-Evros) that was designed, constructed and is operated by Egnatia Odos S.A. (Panetsos, 2017).
THE BALTIC JOURNAL OF ROAD AND BRIDGE ENGINEERING 20 1 8/13 (3)
upon the piers, the deck of the bridge is simply supported through NB1 elastomeric bearings. Its expansion joints are elastomeric and of the T50 type. Finally, its identified components are the following: abutments, piers, superstructure, safety railings, sidewalks, pavement, and drainage system (Panetsos, 2017).
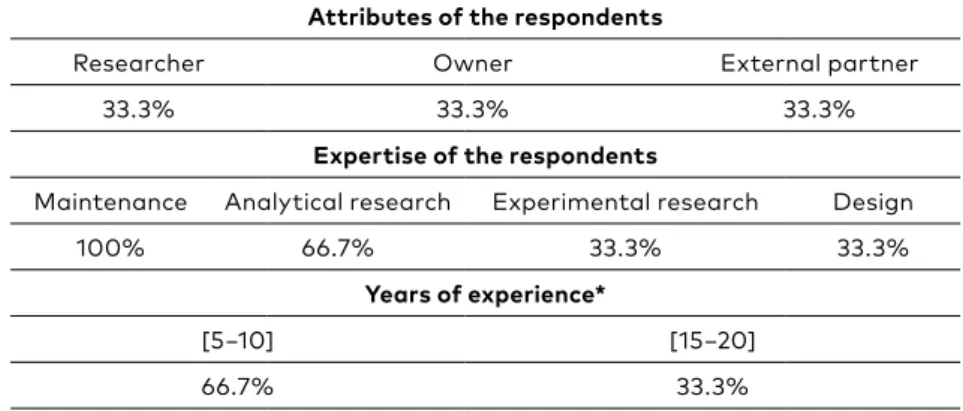
For the importance rating of the KPIs and components, a questionnaire survey was conducted between the three Egnatia Odos S.A. experts directly responsible for the inspection and rating of the Strimonas Bridge. The survey consisted of three sections, with the first one being the identity as shown in Table 1, and the rest featuring:
• seven questions regarding the Likert importance of all KPIs for the quality rating of each component, and
Figure 1. The Strimonas Bridge (Panetsos, 2017)
Table 1. The identity of the questionnaire survey
Attributes of the respondents
Researcher Owner External partner
33.3% 33.3% 33.3%
Expertise of the respondents
Maintenance Analytical research Experimental research Design
100% 66.7% 33.3% 33.3%
Years of experience*
[5−10] [15−20]
66.7% 33.3%
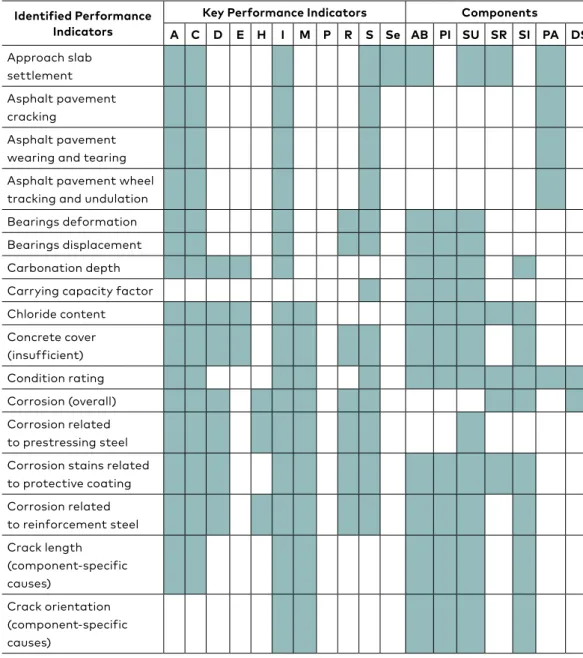
Table 2. Identified and discretized Performance Indicators for the Strimonas Bridge
Identified Performance Indicators
Key Performance Indicators Components
A C D E H I M P R S Se AB PI SU SR SI PA DS
Approach slab settlement Asphalt pavement cracking
Asphalt pavement wearing and tearing Asphalt pavement wheel tracking and undulation Bearings deformation Bearings displacement Carbonation depth Carrying capacity factor Chloride content Concrete cover (insufficient) Condition rating Corrosion (overall) Corrosion related to prestressing steel Corrosion stains related to protective coating Corrosion related to reinforcement steel Crack length
(component-specific causes)
Crack orientation (component-specific causes)
Identified Performance Indicators
Key Performance Indicators Components
A C D E H I M P R S Se AB PI SU SR SI PA DS
Crack spacing (component-specific causes)
Crack width (component-specific causes)
Cracks related to the origin (e.g., due to settlement) Damping Deterioration of protective coatings Ductility
Frequency
Grouting deficiency Inadequate clearance and accessibility The insufficient height of the railing (safety barrier)
Joint deterioration Loss of section Misalignment Pitted corrosion Priority repair ranking Probability of failure Remaining service life Sag and deformation and denivelation Settlement
Sum of costs for repair of individual damages Water penetrability Waterproofing deterioration and loss
With all importance ratings obtained as above, the relative weights of all applicable PIs, KPIs, and components were calculated and then assigned with the process delineated in the Methodology section above.
After the assignment of all relative weights, the three values Pgh,Pgh*,
Pgh* of each PI were derived from the visual inspection conducted in 2017, catastrophic and non-catastrophic (e.g., magnetic) laboratory tests, and structural health monitoring ambient vibration procedures performed on the bridge (Panetsos, 2017). With all the triplets of the values of the
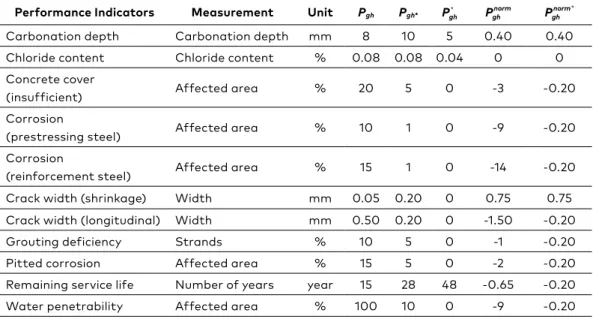
PIs obtained, Pghnorm* was calculated. As an example, the values for all the PIs expressing the KPI “Durability” about the superstructure of the bridge are shown in Table 3.
After the calculation of Pghnorm*, the quality performance of all KPIs corresponding to all components, of all components about the bridge in the system level, and of the whole bridge itself, were respectively computed. The results are summarily shown in Table 4.
For better comprehension of the deliverables of the methodology, Figure 2 is shown. In it, the individual quality scores of the components, their weighted significance, their total scores (namely, the products of the individual quality scores and the weighted significances), and their percentile participation in the quality score of the system level (Qbridge), are depicted.
Table 3. All values of the Performance Indicators expressing Key Performance Indicators “Durability” about the superstructure of the Strimonas Bridge
Performance Indicators Measurement Unit Pgh Pgh* Pgh* Pghnorm Pghnorm
*
Carbonation depth Carbonation depth mm 8 10 5 0.40 0.40 Chloride content Chloride content % 0.08 0.08 0.04 0 0 Concrete cover
(insufficient) Affected area % 20 5 0 -3 -0.20 Corrosion
(prestressing steel) Affected area % 10 1 0 -9 -0.20 Corrosion
THE BALTIC JOURNAL OF ROAD AND BRIDGE ENGINEERING 20 1 8/13 (3)
Table 4. Quality performance of the components and system of the Strimonas Bridge
C om pone nt A bu tmen t Pi er Su pe rs tr uc tu re S af et y r ai l S id ew alk P av emen t D rai na ge sy st em
Notation Qabut Qpier Qsuper Qsrail Qside Qpave Qdrng
Qcompu 0.112 0.071 0.120 0.650 0.627 0.897 0.189
Wcompu 0.171 0.218 0.218 0.101 0.087 0.087 0.119
Qbridge 0.281
Figure 2. Spider graph depicting the scores, weighted significance, total scores, and total participation of the components in Qbridge
0 0.1 0.2 0.3 0.4 0.5 0.6 0.7 0.8 0.9 Abutment Pier Superstructure Safety rail Sidewalk Pavement Drainage system
Component quality score
Component weighted significance
Component total score
Component total participation in Qbridge
0 0.1 0.2 0.3 0.4 0.5 0.6 0.7 0.8 0.9 Abutment Pier Superstructure Pavement Drainage system
Component quality score
Component weighted significance
Component total score
Dimosthenis Kifokeris, Yiannis Xenidis, Panagiotis Panetsos, José António Campos e Matos, Luís Bragança
Bridge Quality Appraisal Methodology: Application in the Strimonas Bridge. Case Study
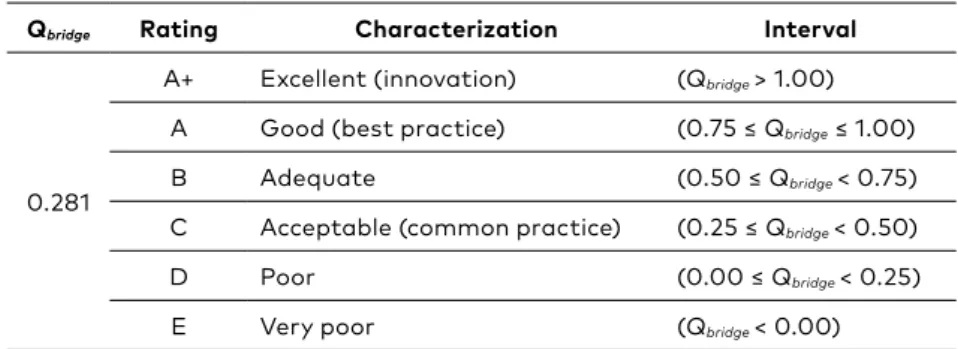
The quality rating scale of the methodology, which is suggested for the interpretation of the final bridge quality score, is an adapted combination of the SB Method quality rating scale (Mateus & Bragança, 2011), and the transposed scale used by Infraestruturas de Portugal for the quality rating and prioritization of existing Portuguese bridges (Amado, 2015). The final quality result is shown, along with the suggested rating scale, in Table 5.
As shown in Table 5, Qbridge = 0.281 translates into a “C” rating and
marginally “Acceptable” quality performance. Critical to this generally poor score was, as shown in Table 4, the very low score and very high significance of the piers.
The official Sufficiency Rating (SR) of the Strimonas Bridge, as provided by Egnatia Odos S.A., is SR = 0.49, with the worst component Condition Rating (CR) belonging to the piers (CRpier = 0.333). When
qualitatively comparing Qbridge to SR, and Qpier = 0.071 with CRpier, it is clear
that the presented methodology is much more conservative in its quality appraisal than the one implemented by Egnatia Odos S.A. However, it is possible that direct comparison is unsuitable, as the criteria, the scales, and the composition rules of the rating methods are generally dissimilar.
Conclusions
1. The presented methodology, which appraises the quality of a bridge, offers a clear and systematic computational framework, having as deliverables the final bridge quality score at the system level, as well as the intermediate Performance Indicators, Key Performance Indicators, and component quality scores. Thus, the monitoring of the whole process is allowed.
2. It is highly customizable, allowing for the specific weight assignment and Performance Indicators identification and discretization.
Table 5. Qbridge and proposed quality bridge performance-rating scale
Qbridge Rating Characterization Interval
0.281
A+ Excellent (innovation) (Qbridge > 1.00)
A Good (best practice) (0.75 ≤ Qbridge ≤ 1.00)
B Adequate (0.50 ≤ Qbridge < 0.75)
C Acceptable (common practice) (0.25 ≤ Qbridge < 0.50)
D Poor (0.00 ≤ Qbridge < 0.25)
THE BALTIC JOURNAL OF ROAD AND BRIDGE ENGINEERING 20 1 8/13 (3)
3. It is, thus far, the only methodology appraising the quality of bridges, in which the measured values of the Performance Indicatorsare correlated with their benchmark values of expected and best achievable performance.
4. Its solicited subjective expert input is limited to the initial weighting procedures of the methodology and is only needed once per case study (except special or severe cases).
5. In the present case study of the Strimonas Bridge, the final bridge quality score of the methodology indicates a marginally acceptable, almost poor bridge condition. This indication is in accordance to the official Sufficiency Rating provided by Egnatia Odos S.A., which also indicates a marginally deficient bridge (0.49 < 0.50). Nonetheless, the score of the present methodology is more conservative than Sufficiency Rating, and even the structural condition rating applied by Egnatia Odos S.A. that is equal to the worst component Condition Rating (Condition Rating of thepier in the present case).
6. It is advised that more case studies, even featuring radically different bridge typologies, are carried out, for the further calibration of the presented methodology.
REFERENCES
Alonso, J. A., & Lamata, M. T. (2006). Consistency in the analytic hierarchy process: a new approach. International journal of uncertainty, fuzziness and knowledge-based systems, 14(04), 445-459.
https://doi.org/10.1142/S0218488506004114
Amado, J. (2015). Road Asset Management System. Infraestruturas de Portugal IP.MOD.033.V01 report. 3 p.
Barone, G., & Frangopol, D. M. (2014). Reliability, risk and lifetime distributions as performance indicators for life-cycle maintenance of deteriorating structures. Reliability Engineering & System Safety, 123, 21-37.
https://doi.org/10.1016/j.ress.2013.09.013
Frangopol, D. M., Dong, Y., & Sabatino, S. (2017). Bridge life-cycle performance and cost: analysis, prediction, optimisation and decision-making. Structure and Infrastructure Engineering, 13(10), 1239-1257.
https://doi.org/10.1080/15732479.2016.1267772
Frangopol, D. M., Strauss, A., & Kim, S. (2008). Bridge reliability assessment based on monitoring. Journal of Bridge Engineering, 13(3), 258-270.
https://doi.org/10.1061/(ASCE)1084-0702(2008)13:3(258)
Ghosn, M., Dueñas-Osorio, L., Frangopol, D. M., McAllister, T. P., Bocchini, P., Manuel, L., ... & Akiyama, M. (2016). Performance indicators for structural systems and infrastructure networks. Journal of Structural Engineering,
Dimosthenis Kifokeris, Yiannis Xenidis, Panagiotis Panetsos, José António Campos e Matos, Luís Bragança
Bridge Quality Appraisal Methodology: Application in the Strimonas Bridge. Case Study
Goepel, K. D. (2013, June). Implementing the analytic hierarchy process as a standard method for multi-criteria decision making in corporate enterprises–a new AHP excel template with multiple inputs. In Proceedings of the international symposium on the analytic hierarchy process (Vol. 2013, pp. 1-10). Creative Decisions Foundation Kuala Lumpur.
International Initiative for a Sustainable Built Environment (iiSBE) Portugal (2009). Evaluation Guide SBToolPT – H V2009/2. Editions iiSBE Portugal, Guimarães, Portugal.
Ishizaka, A., & Labib, A. (2011). Review of the main developments in the analytic hierarchy process. Expert systems with applications, 38(11), 14336-14345. https://doi.org/10.1016/j.eswa.2011.04.143
Liang, Y., Wu, D., Huston, D., Liu, G., Li, Y., Gao, C., & Ma, Z. J. (2018). Civil Infrastructure Serviceability Evaluation Based on Big Data. In Guide to Big Data Applications (pp. 295-325). Springer, Cham.
https://doi.org/10.1007/978-3-319-53817-4_12
Mateus, R., & Bragança, L. (2011). Sustainability assessment and rating of buildings: Developing the methodology SBToolPT–H. Building and environment, 46(10), 1962-1971.
https://doi.org/10.1016/j.buildenv.2011.04.023
Padgett, J. E., & Tapia, C. (2013). Sustainability of natural hazard risk mitigation: Life cycle analysis of environmental indicators for bridge infrastructure.
Journal of Infrastructure Systems, 19(4), 395-408. https://doi.org/10.1061/(ASCE)IS.1943-555X.0000138
Panetsos, P. (2017). Work Group 4 – Sub Group B1: Detailed description of the existing data of the “Strimonas River Bridge”, Greece and the suggested PI and KPI to be used and their values. Research report for the COST Action TU1406 WG4 meeting, Institut Français des Sciences et Technologies des Transports, de l’Aménagement et des Réseaux (IFSTTAR) 2017, Marne-la-Vallée, France, 12 May, 2017. 104 p.
Shao, Y., Yuan, J., & Li, Q. (2017). Identification of the residual value risk factors for road PPP projects in China: Questionnaire survey and analysis. In Proceedings of the 20th International Symposium on Advancement of Construction Management and Real Estate (pp. 379-389). Springer, Singapore. https://doi.org/10.1007/978-981-10-0855-9_33
Strauss, A., Ivankovic, A. M., Matos, J. C., & Casas, J. R. (2016). WG1 technical report: Performance indicators for roadway bridges of COST Action 1406. Xu, Z. (2000). On consistency of the weighted geometric mean complex
judgement matrix in AHP1. European Journal of Operational Research, 126(3), 683-687. https://doi.org/10.1016/S0377-2217(99)00082-X
Zhang, W., & Wang, N. (2017). Bridge network maintenance prioritization under budget constraint. Structural safety, 67, 96-104.