* Corresponding author. E-mail: [email protected] Copyright © 2019 The Author(s). Published by RTU Press
This is an Open Access article distributed under the terms of the Creative Commons Attribution
TIME-DEPENDENT BEHAVIOUR ANALYSIS
OF LONG-SPAN CONCRETE ARCH BRIDGE
YONGBAO WANG1,2, RENDA ZHAO2*,
YI JIA2, PING LIAO2
1College of Civil Engineering, Taiyuan University of Technology,
Taiyuan, P.R. China
2School of Civil Engineering, Southwest Jiaotong University,
Chengdu P.R. China
Received 21 September 2017; accepted 28 July 2018
Abstract. This paper continues the previous study on clarifying the time-dependent behaviour of Beipanjiang Bridge ‒ a reinforced concrete arch bridge with concrete-filled steel tubular stiffened skeleton. The obtained prediction models and the Finite Element Models were used to simulate the long-term behaviour and stress redistribution of the concrete arch bridge. Three-dimensional beam elements simulated the stiffened skeleton and surrounding concrete. Then, a parameters study was carried out to analyse the time-dependent behaviour of the arch bridge influenced by different concrete creep and shrinkage models. The simulation results demonstrate that concrete creep and shrinkage have a significant influence on the time-dependent behaviour of the concrete arch bridge. After the bridge completion, the Comite
Euro-International du Beton mean deviation of displacements obtained by 1990
20 19/14 (2 )
effect. The steel will yield if the fib Model Code for Concrete Structures 2010
model is used in the analysis. The stresses in a different part of the surrounding concrete are non-uniformly distributed.
Keywords: analysis, concrete arch bridge, creep, deformation, finite element, time-dependent behaviour, stress.
Introduction
After the pre-stressed concrete bridge collapsed in Palau (Bažant,
Hubler, & Yu, 2011; Zhang, 2015), the time-dependent behaviour of long-span concrete box girder arch bridge with Concrete-Filled Steel Tubular (CFST) stiffened skeleton has attracted much attention of scholars (Ma, Xiang, & Xu, 2013; Ma, Xiang, Zhao, Xu, & Xie, 2012; Xie, 2012). The concrete creep and shrinkage are the main reasons causing the long-term deformation of the arch bridge (Geng, Wang, Ranzi, & Wu, 2013; Yang, Cai, & Chen, 2015) which affect the safety of the train operation in high-speed railway. In addition, the stress redistribution and long-term deformation are also complex for this type of bridge in the calculation.
Bažant, Yu, & Li (2012) studied the Koror-Babeldaob bridge (a
pre-stressed concrete bridge) based on the B3 (Bazant & Murphy, 1995) and the modified B3 model. The results demonstrated that the B3 model with suitable parameters is more realistic than other models and matches well with the experimental results. In addition, Yu & Li
(2012) numerically investigated the long-term behaviour of
Koror-Babeldaob Bridge. Hedegaard, French, & Shield (2016), Wendner, Tong, Strauss, & Yu (2015) and Zhang (2015) predicted the pre-stress loss and stress distribution of long span pre-stress concrete bridge using the
method obtained by Bažant, Yu, & Li (2012). For CFST bridge, the creep
behaviour (Wang, Ma, Han, & Deng, 2013; Yang, Cai, & Chen, 2015) was studied based on the Finite Element Model (FEM) or experimental study. However, the stress redistribution and construction process of the CFST stiffened skeleton bridge studied in this paper is more complex than that of the pre-stressed bridge or CFST bridge. The construction stages also affect the time-dependent behaviour of the bridge (Yang, Cai, & Chen, 2015). The surrounding concrete needs to be poured in consequence. However, the pouring consequence will affect the stress redistribution of different parts of the box girder. At present, there are few reports about the long-term behaviour of this type of bridge based on a finite element program. In the design phase of Beipanjiang Bridge, Xie (2012) took
Behaviour Analysis of Long-Span Concrete Arch Bridge
Moreover, after finished construction about ten years, the deformation of the arch crown is 0.596 m. Ma, Xiang, Zhao, Xu, & Xie (2012) and Ma, Xiang, & Xu (2013) studied the arch bridge by a stochastic method. However, all the calculated results are based on the creep models suitable for standard strength concrete.
The time-dependent behaviour analysis of a concrete arch bridge is few reported in the literature from an experimental aspect. This task is pursued in computational programs for long-time creep behaviour analysis of Beipanjiang Bridge. The steel tube and core concrete are simplified as beam element with the same nodes. Moreover, the surrounding concrete section is divided into six parts to simulate the construction process. The concrete creep and shrinkage models developed by the experimental study in the previous analysis (Wang, Zhao, Jia, & Liao, 2019) are used in this bridge. The time-dependent behaviour of Beipanjiang Bridge was simulated throughout the construction phase and 100 years after construction by the FEM. At last, the calculated results were compared with different predictions by various prediction models.
1.
Long-term behaviour of the arch bridge
1.1. General description of the bridge
Beipanjiang Bridge, which comes across Beipanjiang River, is located in Qinglong County in Guizhou Province of China. It is in a typical deep mountain canyon terrain of V shape with hard rocks, as shown in Figure 1. An arch bridge is more appropriate for this deep valley. However, the full supporting method is unsuitable for this location. Therefore, a CFST stiffened skeleton construction method was explored to pour the surrounding concrete of the box girder (Xie, 2012).
It is one of the most important bridges in the high-speed railway
from Shanghai to Kunming. Long-term deformation of which is the
main factor controlling the design of this bridge. As the authors know, in the construction stage, it seems that the bridge deformation was affected by shrinkage and creep effect, but this deflection was traced by adjusting the elevation of the pier on the arch. However, when the bridge is finished, the long-term deformation is unrecoverable, which affects the safety of the train operation (Geng, Wang, Ranzi, & Wu, 2013). So, the time-dependent behaviour of the arch is needed to be further investigated by FEM in this paper.
20 19/14 (2 )
and the surrounding concrete was poured based on the platform (Wang, Zhan, & Zhao, 2016). The core and surrounding concrete whose properties used in this bridge was C80 and C60 concrete, respectively (Wang, Zhan, & Zhao, 2016). The main span of the arch is 445 m, and the rise is 100 m, so that rise to span ratio is 1/4.45. The bridge shape is a catenary line, and arch axis coefficient is 1.6. The arch section width is various ranging from 28 m to 20 m at 65 m in the distance of the arch springing; the section width is 20 m in the remaining 315 m of the arch. In addition, the height of the cross section is 9 m.
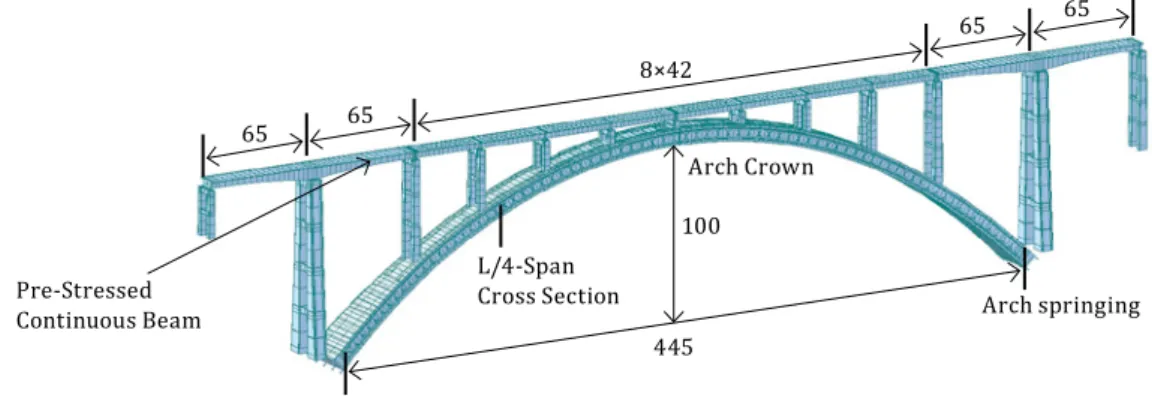
A profile view of the Beipanjiang Bridge, indicating span labels are shown in Figure 1. It is noted that two-span 65 m rigid frame pre-stressed beam + eight-span 42 m pre-stressed continuous beam + two-span 65 m rigid frame pre-stressed beam was located on the arch rib. Figures 2a and
Note: units in m.
Figure 1. Elevation view of Beipanjiang Bridge
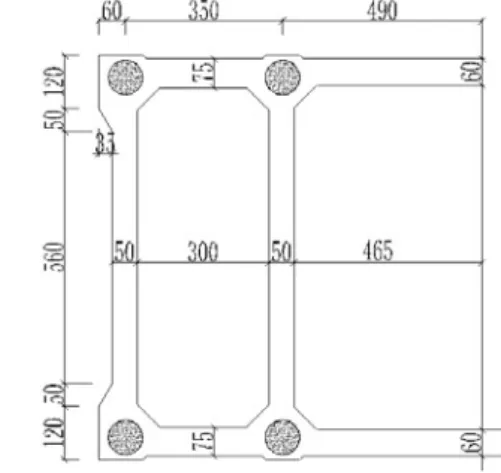
a) arch springing b) arch crown
Note: units in cm.
Behaviour Analysis of Long-Span Concrete Arch Bridge
2b are the cross sections in arch springing and crown, respectively. The diameter of the steel tube is 75 cm. The arch is a single box girder with three cells. The top and bottom plate in the middle cell is 60 cm. At arch crown, the thickness of the middle and side box web is 50 cm, and the top and bottom plate in the side cell is 75 cm. At arch springing, the thickness of the middle and side box web is 50 cm and 60 cm, and the top and bottom plate in the side cell is 90 cm and 110 cm, respectively.
1.2. Finite Element Model
1.2.1. Element type and mesh
A suitable commercial finite element program MADIS/Civil developed the FEM of Beipanjiang Bridge. BEAM element simulated the steel tube, pier, core concrete and surrounding concrete. In
addition, the inhaul cable was simulated by LINK element. The
three-dimensional (3D) FEM of the Beipanjiang Bridge is shown in Figure 3. The authors simulated the concrete filled steel tube as two beam elements with same nodes because the core concrete and steel tube have the same deformation. In addition, the surrounding concrete was coupled with the CFST as an affiliated part. The rigid constraints were used to combine the stiffened skeleton and the surrounding concrete. The skewbacks, including the foundations of this bridge, were quite stiff. Thus, the skewbacks were ignored in the FEM. Moreover, the degrees of freedom associated with those nodes were fully restrained. An overview of the core concrete, stiffened skeleton, concrete cross-section and box girder are shown in Figure 4. The pouring sequences of core concrete and surrounding concrete are also plotted in
Note: units in m.
Figure 3. 3D view of the Finite Element Model of Beipanjiang Bridge 65
100
445 L/4-Span
Cross Section Arch springing
Arch Crown
Pre-Stressed Continuous Beam
65
8×42
20 19/14 (2 )
Middle Box Web
Side Box
Figures 4a and 4c. Unprestressed steel reinforcement was ignored in calculations.
1.2.2. Boundary conditions and construction process
The bridge is a fixed arch bridge, and the specific boundary conditions are fixed on both arch springings. In addition, there are also fixed constraints between the stay cable and mountain.
There are eight steel tubes in the stiffened skeleton, as shown in Figure 4b. At the beginning of pouring the core or surrounding concrete, the concrete was regarded as uniform loads acting on the stiffened skeleton, because the concrete has lower compressive
a) core concrete b) stiffened skeleton
c) cross-section of the surrounding concrete d) details of the surrounding concrete
Note: the 1, 2, ..., 6 denotes the construction sequence; and No.1, No.2, No.3, No.4 denotes the number of the arch rib.
Figure 4. Finite element components of the arch bridge
1 1
2 2
3 3
4 4
6
5
No.1
No.3
No.2
No.4
4 4
1 1
2 3
2 3
2 3
2 3
Top Plate
Middle Box
Bottom Plate
Behaviour Analysis of Long-Span Concrete Arch Bridge
strength. Three days after the concrete had been poured, the strength of concrete reached to the design strength. So, those concrete elements were activated and combined with working with the stiffened skeleton. Different parts of steel tube, core concrete and surrounding concrete were classified into several structure groups. In different construction stages, the structure groups were activated or deactivated to simulate the construction stages. By defining the creep coefficient and shrinkage strain, the shrinkage and creep effect is calculated automatically by the software. The systematic method (Yang, Cai, & Chen, 2015) was used for the creep analysis. The shrinkage starting age is assumed for 3 days. The thermal load was ignored in this analysis.
In the FEM, the bridge construction procedure was divided into 253 steps. The main construction steps of the arch bridge are as follows:
1. Established the arch stiffed skeleton, as shown in Figure 4b; 2. Filled steel tube with C80 concrete, the pouring sequence is shown
in Figure 4a;
3. Pouring the lower half part section of the side box, as shown part
1 and 2 in Figure 4c;
4. Pouring the upper half part section of the side box, as shown part
3 and 4 in Figure 4c;
5. Pouring bottom plate part of the middle box girder, as shown part
5 in Figure 4c;
6. Pouring top plate of the middle box girder, as shown part 6 in
Figure 4c;
7. Build the pre-stressed continuous beam above the arch in Figure 3;
8. The whole bridge was formed;
9. Calculating the long-term behaviour of the bridge in 100 years.
1.2.3. Material properties
20 19/14 (2 )
of steel tube and concrete was assumed to 0.3 and 0.2. Besides, the
modified shrinkage and creep models (Eqs. (3)−(6) developed by Wang,
Zhao, Jia, & Liao (2019)) are the long-term deformation models used in this calculation.
1.3. Long-term deformation
Because of the space limitations, only the following representative results are included:
a) vertical deflections at the arch crown and L/4-span section of the arch (negative value represents downward);
b) stresses of the steel tube and core concrete in No. 1 and No. 4 as shown in Figure 4b at the arch crown and L/4-span section of the arch (negative value represents compression);
c) the stress of the surrounding concrete in the bottom plate of the side box, the web of side box, the top plate of the middlebox in L/4-span section.
The first stage of this analysis is the closure of the CFST stiffened skeleton. The arch crown and L/4-span section have larger vertical deformation than other sections, so the creep deformation curves of these two sections are shown in Figure 5. It is seen from Figure 5 that the shrinkage and creep effect during the construction and the finished stage has a large effect on the deformation of the bridge. The deformation of the arch crown is greater than L/4-span section. In addition, it increases with time due to the concrete creep and shrinkage, although they have the same deformation patterns. The non-recoverable deformation causes a serious impact on the safety of high-speed railway operation (Ma, Xiang, Zhao, Xu, & Xie, 2012). It is seen that after bridge completion, the deformations of the arch crown and
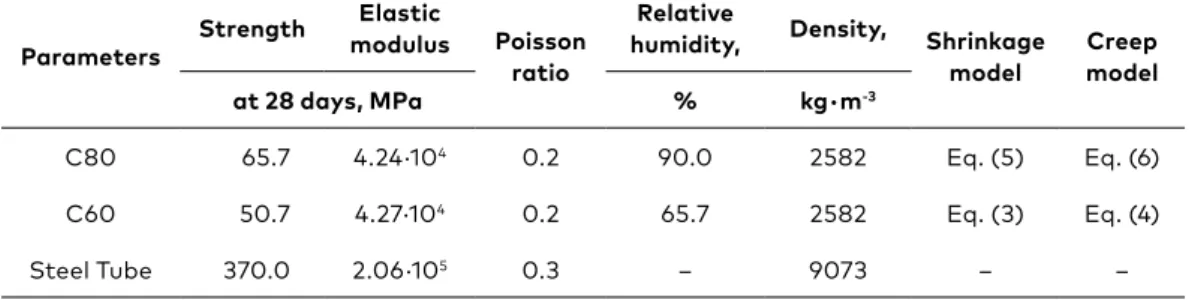
Table 1. Summaries of material properties used in Finite Element Model
Parameters Strength
Elastic
modulus Poisson ratio
Relative
humidity, Density, Shrinkage model
Creep model
at 28 days, MPa % kg⋅m-3
C80 65.7 4.24·104 0.2 90.0 2582 Eq. (5) Eq. (6)
C60 50.7 4.27·104 0.2 65.7 2582 Eq. (3) Eq. (4)
Steel Tube 370.0 2.06·105 0.3 – 9073 – –
Behaviour Analysis of Long-Span Concrete Arch Bridge
L/4-span section are –616 mm and –359 mm, respectively. Ten years
after bridge completion, the deformation of the arch crown is −69 mm
compared with the deformation of the arch rib. This deformation is larger than –59.6 mm calculated by Xie (2012) and smaller than – 80 mm developed by Ma, Xiang, Zhao, Xu, & Xie (2012) compared by using absolute values. The ratios of the long-term deflections of the arch crown and L/4-span section after construction about 100 years to the cumulative elastic deflections are about 19.0% and 19.8%, respectively.
1.4. Stress distribution
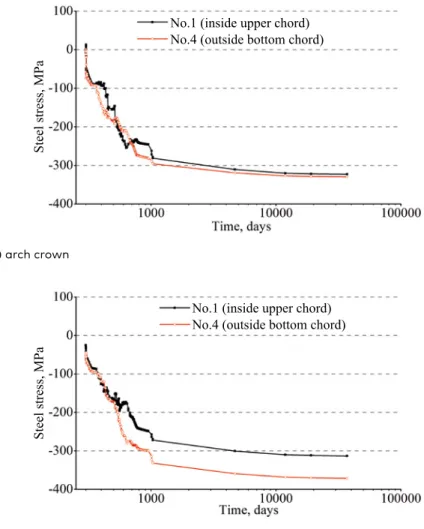
1.4.1. Stress in steel tube
Figure 6 gives the stress curves of steel tube at the arch crown and L/4-span section. It is seen from Figure 6 that the stresses of steel tube in the arch crown and L/4-span section increase with the development of construction stages, and reach to –296.0 MPa and –332.0 MPa, respectively after the bridge was finished. Due to the shrinkage and creep effect, the stresses between the steel tube and core concrete are redistributed. The stress in the upper and bottom chords of the steel tubes increases with time, while, the stress of core concrete has the opposite trend. The stress of steel tubes in bottom chords is larger than upper chords. The stress increments in the arch crown and L/4-span section is –34.0 MPa and –39.0 MPa after the bridge was finished 100 years, respectively.
Figure 5. Deflections of concrete arch
Arch crown
L/4-span cross section
20 19/14 (2 )
1.4.2. Stress in core concrete
Figure 7 lists the stresses of core concrete in the arch crown and
L/4- span section. The location of the core concrete is shown in Figure 4b.
Because of the structure symmetry, only the analysis curves for chords of No. 1 and No. 4 are shown. All the results showed that the stress of core concrete decreases gradually over time after the bridge was finished. The stress in the two chords of the arch crown has nearly the same value. Moreover, the stress of the bottom chord is greater than the upper chord in L/4-span section. The maximum stress in core concrete is –27.38 MPa,
Figure 6. Stresses of steel tube a) arch crown
b) L/4-span cross section
No.1 (inside upper chord) No.4 (outside bottom chord)
Steel stress, MPa
Steel stress, MPa
Behaviour Analysis of Long-Span Concrete Arch Bridge
which is much less than the strength of C80 concrete. The stress of core concrete in No. 4 of L/4-span section decreased from –27.38 MPa to –25.48 MPa after the bridge was finished 100 years. It has the maximum stress increment 1.90 MPa, about 7.0% of the maximum stress. In outside bottom chord (No. 4 as shown in Figure 4b), the stress increment in the arch crown is the same as the stress increment (1.39 MPa) in L/4-span section. The concrete creep and shrinkage have little effect on the stress of core concrete. It means that the core concrete stress is the uncontrolled factor in the bridge design stage.
a) arch crown
b) L/4-span cross section
Figure 7. Stresses of core concrete
Core concrete stress, MPa
No.1 (inside upper chord) No.4 (outside bottom chord)
No.1 (inside upper chord) No.4 (outside bottom chord)
20 19/14 (2 )
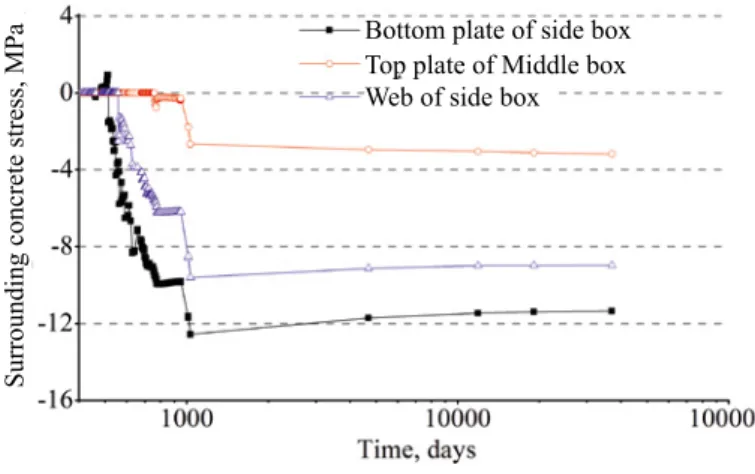
1.4.3. Stress in the surrounding concrete
In Figure 8, the stresses of surrounding concrete at L/4-span section are illustrated. Because the L/4-span section has larger stresses compared with other sections, so the results of concrete stress in the bottom plate of side box, the web of middle box, and top plate of the middlebox in L/4-span section (the location of different plates are shown in Figure 4d) are presented. From Figure 8, the following conclusions are drawn:
1. The concrete stresses in a different part of the box-girder are affected by the bridge construction sequence. Moreover, the distribution of concrete stress is non-uniformly distributed in a different part of the box-girder. The concrete of the bottom plate located in the middle box was first poured and was also the first part to resist external load, so they have the maximum stress in a finished state. Because the top plate of middlebox girder is the last poured part, hence they have the minimum stress;
2. In the construction stage, by the influence of external load, the stresses of the surrounding concrete increase;
3. The stress in the bottom plate of the side box decreases from –12.6 MPa to – 11.7 MPa after ten years of bridge finished construction. The reduction is 0.9 MPa. Concrete stress in a web of side box also decreases with time; The maximum compressive stress increases about 0.66 MPa 100 years of the bridge are finished construction. However, the stress in the top plate of middle box increases gradually with time. Moreover, the increment is –0.52 MPa after 100 years.
Figure 8. Stresses of surrounding concrete in L/4-span cross section
Bottom plate of side box Top plate of Middle box Web of side box
Behaviour Analysis of Long-Span Concrete Arch Bridge
2. Influence of concrete creep and shrinkage models
There are many concrete creep and shrinkage models at present, such
as ACI209 (ACI209 R-92,1992), CEB90 (CEB, 1993), CEB10 model (CEB,
2012). However, each model has its limitations. The results predicted by the models, either overestimate or underestimate the experimental data
in some cases (Al-Manaseer & Prado, 2015; Goel, Kumar, & Paul, 2007).
Although the comparisons between the predicted results obtained by different shrinkage and creep prediction models and experimental results are explored by Wang, Zhao, Jia, & Liao, (2019). The deflection differences in arch crown calculated by difference shrinkage and creep models are clear if the finite element analysis of concrete arch bridge will be carried out (Yang, Cai, & Chen, 2015). Therefore, this study used the CEB mean deviation method (Al-Manaseer & Prado, 2015) to evaluate the validity of the Modified CEB10 (Wang, Zhao, Jia, & Liao, 2019), ACI209 (ACI209 R-92,1992), CEB90 (CEB, 1993) and CEB10(CEB, 2012) models in predicting the time-dependent behaviour of the concrete arch bridge. The CEB mean deviation MCEB (as shown in Eq.) is calculated for the following ranges:
0 days to 1031 days (construction bridge stage), 1032 days to 37 081 days (completed bridge stages). For simplification, Stage A means after the bridge is finished in 0 years. Stage B means after the bridge is finished 100 years in the following sections.
M n Y y CEB j j j n
1 1 ,where yj − the calculated displacement or stress by elastic method
at time j; Yj − the predicted displacement or stress by modified CEB10(Wang, Zhao, Jia, & & Liao, 2019), ACI209(ACI209 R-92,1992),
CEB90 (CEB, 1993) or CEB10 model (CEB, 2012); MCEB − the mean
deviation; n − total number of datasets considered.
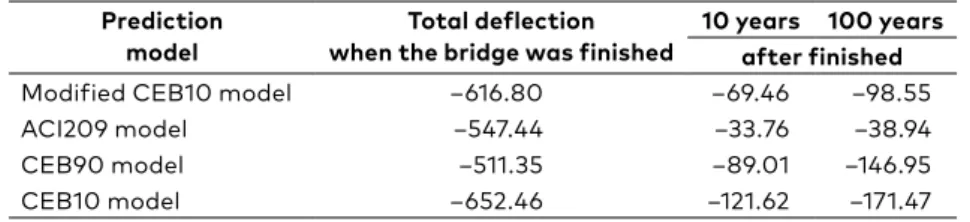
Based on the above models, Table 2 presents a comparison of arch crown deflection calculated by different prediction models. It is observed that the range of vertical deformation of the arch crown is –69.46 mm and –98.55 mm after the bridge is finished ten years and 100 years when the modified CEB10 model (Wang, Zhao, Jia, & Liao, 2019) is considered. Each prediction model has different deflection. Ten years after the bridge was finished, the ACI209 model (ACI209 R-92,1992) provides the minimum deformation increment of –38.94 mm. The CEB10 model (CEB,
2012) appears to provide the largest deformation increment, which is
20 19/14 (2 )
for high-speed railway. If the results calculated by the modified CEB10 model (Wang, Zhao, Jia, & Liao, 2019) were considered as the best values, the traditional prediction models expect ACI209 model (ACI209 R-92, 1992) overestimates the vertical deflection of the arch. The 100-year deflections considering the shrinkage and creep effect are 79–151% larger than elastic deflection in the arch crown.
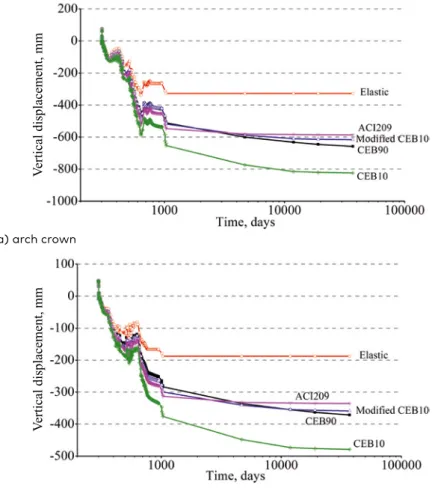
Figure 9 is plotted to describe the total vertical deflections of arch rib calculated by different prediction models. Moreover, the
MCEB results are shown in Table 3. If the concrete shrinkage and creep
effect is considered, the vertical displacements of the arch crown and L/4-span cross section are –617 mm and –300 mm (Modified CEB10 model). Moreover, its average value is 1.3787 and 1.3876 times than the deflection of linear elastic analysis in Stage A. On the other hand, the deflections calculated by CEB10 model (CEB, 2012), CEB90 model (CEB, 1993) is –171 mm and –147 mm in Stage B, which are significantly higher than the value –99 mm calculated by modified CEB10 model (Wang, Zhao, Jia, & Liao, 2019). Results indicate that in Stage B, the ACI209 model (ACI209 R-92,1992) has the minimum values, followed by modified CEB10 model (Wang, Zhao, Jia, & Liao, 2019), CEB90 model (CEB, 1993). The CEB10 model (CEB, 2012) ranked fourth. The maximum
MCEB error between ACI209 (ACI209 R-92, 1992) and CEB10 model (CEB,
2012) is 34.7%. A suitable prediction model is critical to estimate the time-dependent behaviour of the arch bridge.
Table 2. Deflections of concrete arch crown for different creep models
Prediction
model when the bridge was finishedTotal deflection 10 years 100 years after finished
Modified CEB10 model –616.80 –69.46 –98.55
ACI209 model –547.44 –33.76 –38.94
CEB90 model –511.35 –89.01 –146.95
CEB10 model –652.46 –121.62 –171.47
Note: units in mm.
Table 3. Comparison of MCEB results of the vertical deflection
Location Arch crown L/4-span cross section
Models Modified CEB10 ACI209 CEB90 CEB10 Modified CEB10 ACI209 CEB90 CEB10
MCEB in 0 days
to 1031 days 1.3787 1.4813 1.3909 1.6737 1.3876 1.4696 1.3355 1.6648 MCEB in 1032 days
Behaviour Analysis of Long-Span Concrete Arch Bridge
a) arch crown
b) L/4-span cross section
Figure 9. Vertical deflection
The steel stresses predicted by different models in No. 4 of the arch crown and L/4-span section during construction stages and 100 years after the finished state are illustrated in Figure 10. In Stage A, the steel stress without considering shrinkage and creep effect of arch crown and L/4-span section is –221 MPa and –243 MPa, which is less than the results –296 MPa and –332 MPa calculated by modified CEB10 model (Wang, Zhao, Jia, & Liao, 2019), respectively. The steel stress predicted by CEB10 model (CEB, 2012) is –400 MPa and –452 MPa for arch crown and L/4-span section in Stage B. However, the stress simulates by modified CEB10 model (Wang, Zhao, Jia, & Liao, 2019) is –330 MPa and –371 MPa, respectively. All these indicate that the steel will yield because of concrete creep and shrinkage, which affect the safety of the arch. These models also predict the 100-year
Vertical displacement, mm
20 19/14 (2 )
a) arch crown
b) L/4-span cross section
Figure 10. Stresses of steel tube
Table 4. Comparison of MCEB results of stresses in steel tube
Location Arch crown L/4-span cross section
Models Modified CEB10 ACI209 CEB90 CEB10 Modified CEB10 ACI209 CEB90 CEB10
MCEB in 0 days
to 1031 days 1.1836 1.2192 1.1613 1.2952 1.2012 1.2523 1.1915 1.3240
MCEB in 1032 days
to 37 081 days 1.4464 1.4336 1.4551 1.7328 1.4804 1.4841 1.5004 1.7827
Steel stress, MPa
Behaviour Analysis of Long-Span Concrete Arch Bridge
steel stress to be 2–22% larger than the results calculated by the modified CEB10 model (Wang, Zhao, Jia, & Liao, 2019). After the bridge is finished, the concrete box girder suffers almost all the external loads even though the steel tube is in yielding, which indicates the bridge is still in a safe state. Table 4 summarises the statistical values of MCEB for different models.
Table 4 shows that the MCEB calculated by CEB90 model (CEB, 1993) and
ACI209 model (ACI209 R-92,1992) is the minimum in 0 days to 1031 days and 1032 days to 37 081 days, respectively. It means that not only the extremal shrinkage or creep strains but also the intermediate values in time t are significant for evaluating the time-dependent behaviour of the concrete arch bridge (Al-Manaseer & Prado, 2015).
Figure 11 is plotted to describe the core concrete stresses in No. 4 calculated by different creep models. The MCEB, as shown in Table 5, are
a) arch crown
b) L/4-span cross section
Figure 11. Stresses of core concrete
Core concrete stress, MPa
20 19/14 (2 )
Table 5. Comparison of MCEB results of stresses in core concrete
Location Arch crown L/4-span cross section
Models Modified CEB10 ACI209 CEB90 CEB10 Modified CEB10 ACI209 CEB90 CEB10
MCEB in 0 days
to 1031 days 0.7888 0.7654 0.8008 0.7162 0.7891 0.7631 0.8237 0.7350 MCEB in 1032 days
to 37 081 days 0.7943 0.8028 0.8553 0.8200 0.7925 0.8067 0.8858 0.8283
a) bottom plate
b) middle web
Figure 12. Stresses of surrounding concrete in L/4-span cross section
Concrete stress, MPa
Behaviour Analysis of Long-Span Concrete Arch Bridge
less than 1.0 in all prediction models. The MCEB values are significantly
different from the database shown in Tables 3 and 4. From Figure 11 and Table 5, it is noted that the shrinkage and creep effect reduces the stress of core concrete in certain extents. The calculation results considering shrinkage and creep effect of concrete are higher than that without considering time-dependent effect. All the time-dependent models overestimated the core concrete stress except the modified CEB10 model (Wang, Zhao, Jia, & Liao, 2019). Among all the prediction models, CEB90 model (CEB, 1993) underestimates the 100-year deflection by 18% compared with modified CEB10 model (Wang, Zhao, Jia, & Liao, 2019), when the default parameter values are used. The 100-year stresses of core concrete estimated by other models are 3–18% larger than the results calculated by the modified CEB10 model (Wang, Zhao, Jia, & Liao, 2019).
Figure 12 displays the stresses of surrounding concrete influenced by different concrete creep models. The stresses of the bottom plate in the side box and web in the middle box of L/4-span section are shown in these graphs. Table 6 summarises the MCEB results of stresses in the
surrounding concrete. The MCEB continues to decrease from Stage A to
Stage B. It is different from the stress trend in core concrete, as shown in Table 5. The results calculated by considering the prediction models are much less than those without shrinkage and creep effects. Different creep models have a different effect on the stress in various part of the box-girder. In Stage B, the CEB10 model (CEB, 2012) has the minimum stress in the bottom plate. However, the ACI209 model (ACI209 R-92, 1992) has the minimum stress in the middle web. Compared with modified CEB10 model (Wang, Zhao, Jia, & Liao, 2019), CEB10 model (CEB, 2012) and CEB90 model (CEB, 1993) overestimated the stress in 0 days to 1031 days. However, they underestimated the stress in 1032 days to 37 081 days.
Table 6. Comparison of MCEB results of stresses in the surrounding concrete
Location Bottom plate Middle web
Models Modified CEB10 ACI209 CEB90 CEB10 Modified CEB10 ACI209 CEB90 CEB10
MCEB in 0 days
to 1031 days 0.9036 0.8846 0.8669 0.8089 0.9161 0.8003 0.8587 0.8543 MCEB in 1032 days
20 19/14 (2 )
Conclusions
Based on the modified fib Model Code for Concrete Structures 2010
model and the Finite Element Model established on the computational program, the long-term behaviour of Beipanjiang Bridge was studied. The following conclusions were drawn from this study.
1. The long-term changed deformation of the arch crown after 100 years was –98.5 mm, which affect the safety of train operation. Compared with the modified fib Model Code for Concrete Structures 2010 model, the deformations calculated by ACI209 R-92 Prediction of Creep, Shrinkage and Temperature Effects in Concrete Structures model, 1990 CEB-FIP Model Code: Design Code
model and fib Model Code for Concrete Structures 2010 model
are –38.94 mm, –146.95 mm, and –171.47 mm, respectively. A suitable prediction model for shrinkage and creep of concrete is the key to obtain the long-term deformation of the bridge. The modified fib Model Code for Concrete Structures 2010 model is more suitable to estimate the deformation in the present stage.
2. The shrinkage and creep causes stress redistribution between the steel tube and core concrete. The steel stress gradually increases, and the core concrete stress gradually decreases with time. The steel stress reaches its yield strength to some extent. If the yield of steel pipe is ignored, the stress of the steel tube in
L/4-span section reach –451 MPa, when the fib Model Code for
Concrete Structures 2010 model was used. Because of the stress redistribution, the core concrete stress in L/4-span section is –25.5 MPa. All the traditional models overestimate the core concrete stress in 100 years after bridge construction.
3. The distribution of concrete stress is non-uniformly distributed in different parts of the box-girder. Stresses reach maximum after the completion of the bridge. Then, the stress of surrounding concrete continuous to decrease with time. Thus, the stress of the surrounding concrete is unimportant in controlling the design
of this structure. The fib Model Code for Concrete Structures
2010 model, 1990 CEB-FIP Model Code: Design Code model overestimated the stress in the construction stage. However, they underestimated the stress in the finished stage.
Behaviour Analysis of Long-Span Concrete Arch Bridge
Acknowledgements
The China Railway Eryuan Engineering Group Co. Ltd. sponsors the experiment test in this work. The National Natural Science Foundation of China (51778531) and Shanxi Applied Basic Research Project (201801D221223) financially supports it.
REFERENCES
ACI209 R-92Prediction of Creep, Shrinkage and Temperature Effects in Concrete Structures.
Al-Manaseer, A., & Prado, A. (2015). Statistical comparisons of creep and
shrinkage prediction models using RILEM and NU-ITI databases. ACI
Materials Journal, 112(1), 125. https://doi.org/10.14359/51686982
Bažant, Z.P. & Murphy, W. P. (1995). Creep and Shrinkage Prediction Model for Analysis and Design of Concrete Structures-Model B3. Materials and Structures 28:357‒365. https://doi.org/10.1007/BF02473152.
Bažant, Z. P., Hubler, M. H., & Yu, Q. (2011). Excessive creep deflections: An
awakening. Concrete international, 33(8), 44-46.
Bažant, Z. P., Yu, Q., & Li, G. H. (2012). Excessive long-time deflections of prestressed box girders. I: Record-span bridge in Palau and other paradigms. Journal of Structural Engineering, 138(6), 676-686.
https://doi.org/10.1061/(ASCE)ST.1943-541X.0000487
Comite Euro-International du Beton (CEB) (1993). 1990 CEB-FIP Model Code
1990: Design Code
Comite Euro-International du Beton (CEB) (2012). fibModel Code for Concrete
Structures 2010
Geng, Y., Wang, Y., Ranzi, G., & Wu, X. (2013). Time-dependent analysis of
long-span, concrete-filled steel tubular arch bridges. Journal of Bridge
Engineering, 19(4), 04013019.
https://doi.org/10.1061/(ASCE)BE.1943-5592.0000549
Goel, R., Kumar, R., & Paul, D. K. (2007). Comparative study of various creep
and shrinkage prediction models for concrete. Journal of materials in civil
engineering, 19(3), 249-260.
https://doi.org/10.1061/(ASCE)0899-1561(2007)19:3(249)
Hedegaard, B. D., French, C. E., & Shield, C. K. (2016). Effects of cyclic temperature on the time-dependent behavior of posttensioned concrete
bridges. Journal of Structural Engineering, 142(10), 04016062.
https://doi.org/10.1061/(asce)st.1943-541x.0001538
Ma, K., Xiang, T., & Xu, T. (2013). Probabilistic Analysis on Influence of Creep and Shrinkage on Time-Variant Stresses of High-Speed Railway Reinforced
Concrete Arch Bridge, Journal of China Railway Society 35(9): 94‒99. (in
20 19/14 (2 )
Ma, K., Xiang, T. Y., Zhao, R. D., Xu, Y., & Xie, H. 2012. Stochastic Analysis of Long-Term Deformation of Reinforced Concrete Arch Bridge for High-Speed
Railways. China Civil Engineering Journal 45(11): 141‒146.
Wang, Y. B., Zhao, R. D. Jia, Y., & Liao P. (2019). Creep Characteristics of Concrete
Used in Long-span Arch Bridge, The Baltic Journal of Road and Bridge
Engineering 14(1): 18−36. https://doi.org/10.7250/bjrbe.2019-14.431
Wang, Y. F., Ma, Y. S., Han, B., & Deng, S. Y. (2013). Temperature effect on creep
behavior of CFST arch bridges. Journal of Bridge Engineering, 18(12),
1397-1405. https://doi.org/10.1061/(ASCE)BE.1943-5592.0000484
Wang, Y., Zhan, Y., & Zhao, R. (2016). Analysis of thermal behavior on concrete
box-girder arch bridges under convection and solar radiation. Advances in
Structural Engineering, 19(7), 1043-1059. https://doi.org/10.1177/1369433216630829
Wendner, R., Tong, T., Strauss, A., & Yu, Q. (2015). A case study on correlations of axial shortening and deflection with concrete creep asymptote in
segmentally-erected prestressed box girders. Structure and Infrastructure
Engineering, 11(12), 1672-1687.
https://doi.org/10.1080/15732479.2014.992442
Xie, H.Q. (2012). Study on Structural Type Selection and Mechanical Behaviors of Long-Span Railway Concrete Arch Bridge with Rigid Skeleton (Doctoral Dissertation, Southwest Jiaotong University) (In Chinese)
Yang, M. G., Cai, C. S., & Chen, Y. (2015). Creep performance of concrete-filled
steel tubular (CFST) columns and applications to a CFST arch bridge. Steel
and Composite Structures, 19(1), 111-129. https://doi.org/10.12989/scs.2015.19.1.111
Yu, Q., & Li, G. H. (2012). Excessive long-time deflections of prestressed box
girders. II: Numerical analysis and lessons learned. Journal of Structural
Engineering, 138(6), 687-696.
https://doi.org/10.1061/(ASCE)ST.1943-541X.0000375