Original Research Article
Which is a better marker for overweight: waist height
ratio or waist circumference?
Sanam Anwar*, Bushra Aleem, Hajir H. Rashid, Ghadeer J. Moslhey
INTRODUCTION
The global prevalence of obesity has been increasing.1
Overweight and obesity among adults in Oman are present in 30% and 20% population respectively. Data from health survey 2008 showed that both overweight and obesity were more common among the age groups 25-74. The percentage of the Omani population classified to have central obesity was high; overall more than one third of the Omani population were centrally obese; out of which 19.7% were males and 53.5% were females.2
Various methods for nutritional assessment have been described in the literature.3 Body mass index, waist
circumference and waist hip ratio have been widely used.4 A good screening test should be not only highly
predictive but also easy to perform and interpret.5 BMI
and waist circumference are simple and inexpensive screening measurements for predicting obesity and they are commonly used in adults and children.6 BMI is
associated with body fat content but not always with abdominal obesity.7 Waist circumference may reflect the
extent of visceral fat accurately, but it can overestimate or Department of Public Health, College of Medicine & Health Sciences, National University of Science & Technology, Sohar, Oman
Received: 06 December 2018
Accepted: 03 January 2019
*Correspondence:
Dr. Sanam Anwar,
E-mail: sanam@omc.edu.om
Copyright: © the author(s), publisher and licensee Medip Academy. This is an open-access article distributed under the terms of the Creative Commons Attribution Non-Commercial License, which permits unrestricted non-commercial use, distribution, and reproduction in any medium, provided the original work is properly cited.
ABSTRACT
Background: The global prevalence of obesity has been increasing. Body mass index, waist circumference and waist height ratio have been widely used for nutritional assessment. Waist height ratio has the advantage of taking into account abdominal obesity as well as height associated with body fat accumulation or distribution. The objective of this study was to suggest cut off points for waist circumference and waist height ratio to identify overweight in Omani adults.
Methods: Weight, height, waist circumference and waist height ratio were measured for all participants. Pearson’s correlation was used to determine correlation of BMI with waist circumference and waist height ratio. ROC curve was used to identify AUC and specific cut off point for anthropometric indicators.
Results: The largest proportion of overweight was picked up by waist height ratio across both the genders. Correlation of BMI with waist height ratio was stronger (r=0.699) than correlation with waist circumference (r=0.589) for both the genders. Maximum AUC was for waist height ratio in males (AUC=0.833, 95% CI=0.791-0.875). The specific cut off point for waist circumference in males and females was 89.5cm and 87.6cm respectively. The specific cut off point for waist height ratio in males and females was 0.53 and 0.57 respectively.
Conclusions: Maximum participants were found overweight by waist height ratio followed by waist circumference and the least by BMI. The higher cut off points should be used in this population for identifying overweight people.
Keywords: Area under curve, Cutoff values, Overweight, Waist circumference, Waist height ratio
underestimate the risk of cardiovascular disease, as individuals with similar waist circumference may vary in height.8
Recently, waist height ratio has been proposed as an anthropometric measure to assess central adiposity, since it is closely associated with cardiometabolic risk factors and mortality, independently of body weight.9 Waist
height ratio has the advantage of taking into account abdominal obesity as well as height associated with body fat accumulation or distribution.10 Ashwell et al,
suggested that waist height ratio is more sensitive than BMI for early prediction of obesity-related complications, is easy to measure by the general public, and is commonly used for all ages, sexes, and races.11
Consequently, it has been proposed as a population-based screening tool for cardiometabolic risk prediction in large-scale epidemiological studies and during medical examinations.12
World Health Organization (WHO) guidelines state that alternative measures that reflect abdominal obesity such as waist circumference and waist height ratio have been found to be superior to BMI.13 A study among Chinese
population demonstrated that while BMI and waist circumference were found to be the important indices of obesity, waist circumference was found to be the best measurement of obesity.14Ashewell suggested an optimal
waist height ratio cutoff value of 0.5 for the prediction of obesity and metabolic abnormalities in children and adults and proposed that individuals with values ≥0.5 should be followed up, while immediate action should be taken in individuals with values ≥0.6.15
The objective of the study was to find out which is a better marker to identify overweight; waist circumference or waist height ratio, and to suggest cut off points for waist circumference and waist height ratio in Omani adults.
METHODS
A cross sectional study was carried out among 500 Omani adults more than 18 years of age attending a polyclinic in Rustaq. The study was conducted from April 2014 to March 2015. Data was collected after taking informed consent. Weight was measured to the nearest 0.1kg and height was measured to the nearest 0.1cm using Detecto scale. BMI was calculated by using the formula, BMI = weight (kg)/height (m²). WHO BMI cutoffs points used were: underweight (BMI<18.5), normal (18.5-24.9), overweight (25-29.9), and obese class (BMI ≥30).13 Waist circumference was measured to
the nearest cm at the level parallel to the floor, midpoint between the top of the iliac crest and the lower margin of the last palpable rib in mid-axillary line. Data was analyzed using cutoffs points for 94cm in men and 80cm in women.13 Waist height ratio was calculated by dividing
waist circumference in cm by height in cm with the result
varying from 0 to 1.16 Cut off of 0.50 was taken for both
males and females.17
Data was analyzed by SPSS. Receiver operating characteristic (ROC) curve was used to identify AUC and specific cut off point for anthropometric indicators and to see whether these points are similar or different than the generic cut off values. Point with maximum Youden index was used for specific cut off point. An AUC ≥0.5 is less accurate but remains useful for screening tests, an AUC>0.7 indicates an accurate value for screening, and an AUC>0.9 indicates a very accurate value.18 Moreover,
ROC analysis can be applied to measure differences in AUC values, thereby enabling identification of the most powerful variables.19 Pearson’s correlation coefficient
was used to determine correlation of BMI with waist circumference and waist height ratio. Statistical significance was set at p<0.05.
RESULTS
The mean BMI of the study population was 27.1 and was more in females. The mean waist circumference was 90.9 but was higher in males. Also, the mean waist height ratio was more in males (0.58) compared to females (0.55). According to WHO BMI classification, 40% individuals were overweight and 24.8% were obese. Percentage for females who were overweight and obese was higher than males (Table 1).
Table 1: Prevalence of overweight by BMI classification.
BMI Total (%) Males (%) Females (%)
<18.5 25 (5.0) 16 (4.5) 9 (6.1) 18.5-24.5 151 (30.2) 111 (31.4) 40 (27.2) 25-29.9 200 (40.0) 139 (39.4) 61 (41.5) ≥30 124 (24.8) 87 (24.6) 37 (25.2)
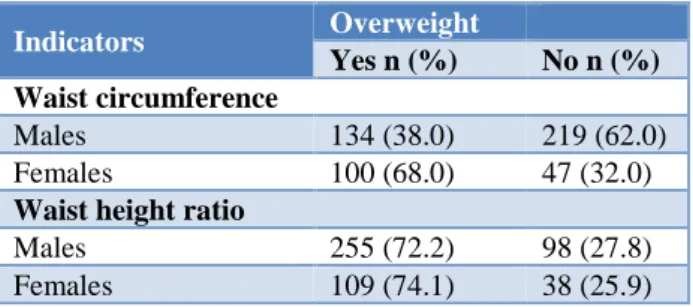
Table 2: Gender-wise distribution of overweight according to waist circumference/waist height ratio by
WHO BMI classification.
Indicators Overweight
Yes n (%) No n (%)
Waist circumference
Males 134 (38.0) 219 (62.0) Females 100 (68.0) 47 (32.0)
Waist height ratio
Males 255 (72.2) 98 (27.8) Females 109 (74.1) 38 (25.9)
46.8% participants, out of which less males (38%) and more females (68%) were overweight (Table 2). More females were overweight than men by all the three anthropometric measurements. The largest proportion of overweight was picked up by waist height ratio across both the genders. It was followed by waist circumference and then least by BMI in females. While in men the least percentage of overweight was by waist circumference.
BMI had positive and strong correlation both with waist circumference and waist height ratio (p<0.001). However, the correlation of BMI with waist height ratio was stronger (r=0.699) than correlation with waist circumference (r=0.589) and this was also true for both the genders. When the measurements were compared across gender, it was found that females had stronger correlation (r=0.610) with waist circumference than males (r=0.582). On the other hand, males had higher coefficient value for waist height ratio (r=0.720) than females (r=0.672). Strongest correlation as evident by Pearson’s correlation coefficient was of BMI with waist height ratio in males (r=0.720) (Table 3).
Table 3: Gender-wise correlation between BMI and waist circumference/waist height ratio.
Variable n
Waist circumference
Waist height ratio
r p value r p value
Overall 500 0.589 0.000 0.699 0.000 Males 353 0.582 0.000 0.720 0.000 Females 147 0.610 0.000 0.672 0.000
(r= Pearson’s correlation coefficient)
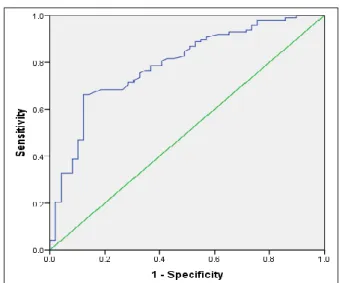
Figure 1: ROC curve for waist circumference in males.
ROC curves were constructed for both waist circumference and waist height ratio separately for males and females by plotting the values of sensitivity and 1minus specificity as depicted in Figures 1 to 4. Interpretations from ROC analysis were in line with the correlation findings. Area under the curve from ROC analysis depicts higher AUC in females (0.802) than
males (0.794) for waist circumference (Figure 1-2). In contrast for waist height ratio, males had higher AUC than females (Figure 3-4).
Figure 2: ROC curve for waist circumference in females.
Figure 3: ROC curve for waist height ratio in males.
Thus, AUC for waist height ratio as an indicator of overweight was more than that for waist circumference in males. In contrast, AUC for waist circumference was higher than waist height ratio in females (Table 4). Maximum AUC was for waist height ratio in males (AUC=0.833, 95% CI=0.791-0.875).
Table 4: AUC for waist circumference/waist height ratio as an indicator of overweight according to who
BMI classification.
Variable AUC SE 95% CI p value
Waist circumference
Males 0.794 0.024 (0.746-0.842) 0.000 Females 0.802 0.039 (0.725-0.879) 0.000
Waist height ratio
Males 0.833 0.022 (0.791-0.875) 0.000 Females 0.791 0.039 (0.713-0.868) 0.000
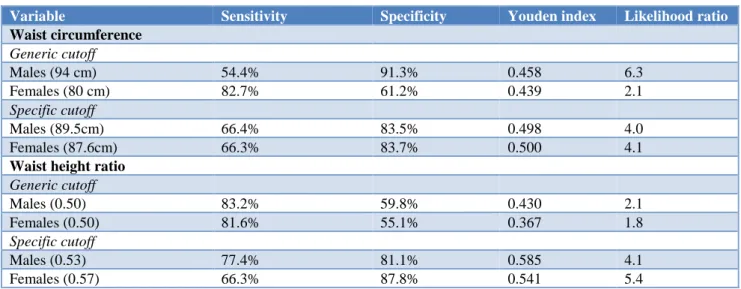
ROC curve analysis was used to get the specific cut off points to identify overweight people with waist circumference and waist height ratio. The point with maximum sum of sensitivity and specificity was used to get the cutoff point. The specific cut off point for waist circumference in males and females was 89.5cm and 87.6cm respectively. The specific cut off point for waist height ratio in males and females was 0.53 and 0.57 respectively. The specific cut off points obtained from ROC curve were higher than generic cutoff points for both waist circumference and waist height ratio in females and males; except that males had lower specific cut off point for waist circumference. Similarly, the likelihood ratio of being overweight was more with specific cut off point than generic cut off point for both the anthropometric indicators across both genders; except for waist circumference in males which had higher likelihood ratio with generic cut off point.
Table 5: Validity of generic and specific cutoff for waist circumference/waist height ratio as an indicator of overweight according to WHO BMI classification.
Variable Sensitivity Specificity Youden index Likelihood ratio
Waist circumference
Generic cutoff
Males (94 cm) 54.4% 91.3% 0.458 6.3
Females (80 cm) 82.7% 61.2% 0.439 2.1
Specific cutoff
Males (89.5cm) 66.4% 83.5% 0.498 4.0
Females (87.6cm) 66.3% 83.7% 0.500 4.1
Waist height ratio
Generic cutoff
Males (0.50) 83.2% 59.8% 0.430 2.1
Females (0.50) 81.6% 55.1% 0.367 1.8
Specific cutoff
Males (0.53) 77.4% 81.1% 0.585 4.1
Females (0.57) 66.3% 87.8% 0.541 5.4
Table 5 shows the values of sensitivity, specificity, Youden index and likelihood ratio for gender specific generic and specific cut off points for waist circumference and waist height ratio to identify overweight population in males and females. Waist height ratio had better Youden index compared to waist circumference
.
DISCUSSION
In the present study, the population who was identified as overweight was 40% by BMI, 46.8% by waist circumference and 72.8% by waist height ratio cutoff value. This finding is worrisome as overweight is an important risk factor for many health problems having a direct implication on quality of life. The mean waist
circumference in this study was 91cm in males and 90.8cm in females which is in agreement with the findings in the Oman world health survey where the mean waist circumference of Omani males and females were 89.7 cm and 88.7cm, respectively.2 A study among
Indians found that the prevalence of abdominal obesity using waist circumference was 46% in men and 64% in women.20 Correa et al, reported mean waist height ratio
was 0.6 in Brazilian adults; it was higher in females compared to the current study.21 Result of this study
circumference was also found to correlate positively and significantly with BMI compared in diabetic females and males.23
In the present study, waist height ratio had better Youden index compared to waist circumference. The optimal cutoff point was for waist circumference in males and females was 89.5cm and 87.6cm and for waist height ratio in males and females was 0.53 and 0.57; AUC was 0.833 for waist height ratio in males and 0.791 in females. Correa et al, found 0.55 as the best cutoff point for waist height ratio in the identification of overweight; AUC exceeded 0.8.21 Ashwell proposed waist height ratio
values below 0.50 as low-risk to health, 0.5 to 0.6 as suggestive of risk, and greater than 0.60 as high-risk, and that disease prevention and health recovery measures should be recommended for values above 0.50.24 The
current study found that mean waist height ratio of 0.53 -0.57 was indicative of risk to health. A study among Chinese population stated that waist circumference is the best predictor of hyperglycemia with optimal cutoffs as 85 for men 82 for women.25 This is consistent with a
study among Malaysian population which found waist circumference is the better indicator for predicting CVD risk factors than BMI and the optimal cutoffs for waist circumference were 83-92cm in men and 83-88cm in women.26 Advantage to use waist height ratio is that BMI
does not correlate completely with body fat distribution (especially that of abdominal fat), thus making waist height ratio more advantageous due to the use of waist circumference in its calculation. Although BMI does not measure body composition, it does have good diagnostic potential for nutritional status in epidemiological studies, with a weak correlation with height and strong correlation with absolute fat mass.27,28
In the current study, a good percent of the population classified as normal weight according to the WHO criteria, showed waist height ratio and waist circumference values higher than the cutoff value which was also found in other studies.29 Health professionals
should thus look beyond BMI, which is not sufficient by itself to assess early risk, failing to classify a considerable portion of the population at imminent risk.30 However,
for better diagnosis of overweight, studies recommend that BMI values be combined with other measures of adiposity such as waist circumference or waist height ratio, in individual and collective assessments, aimed at better prediction of health problems by these adiposity indicators.31 Large sample size in this study make our
results useful as a baseline data for future research, especially focusing on waist height ratio and waist circumference as a screening tool for abdominal obesity.
CONCLUSION
Maximum participants were found overweight by waist height ratio followed by waist circumference and the least by BMI. Percentage for females who were overweight was higher than males by all the three anthropometric
measurements. Correlation of BMI with waist height ratio was stronger than correlation with waist circumference across both the genders. The specific cut off points for waist height ratio were higher than generic cut off points across both gender. The higher cut off points should be used in this population for identifying overweight people. Measures to deal with overweight are thus needed to back appropriate health policies, programs, and services for health promotion, disease prevention.
Funding: Funded by Research Council as FURAP grant Conflict of interest: None declared
Ethical approval: Ethics and Research Committee, Ministry of Health, Oman
REFERENCES
1. Ogden CL, Flegal KM, Carroll M, Johnson, C.L. Prevalence and trends in overweight among US children and adolescents, 1999-2000. JAMA. 2002;288:1728-32.
2. Al Riyami A, Elaty MA, Morsi M, Al Kharusi H, Al Shukaily W, Jaju S. Oman world health survey: part 1-methodology, sociodemographic profile and epidemiology of non-communicable diseases in oman. Oman Medical J. 2012 Sep 1;27(5):425-43. 3. Willett W. Nutritional epidemiology. 3rd ed.
Oxford: Oxford University Press; 2012.
4. Satoh H, Kishi R, Tsutsui H. Body mass index can similarly predict the presence of multiple cardiovascular risk factors in middle-aged Japanese subjects as waist circumference. Intern Med. 2010;49:977-82.
5. Lo K, Wong M, Khalechelvam P, Tam W. Waist-to-height ratio, body mass index and waist circumference for screening paediatric cardio-metabolic risk factors: A meta-analysis. Obes Rev. 2016;17:1258-75.
6. Blüher S, Molz E, Wiegand S, Otto KP, Sergeyev E, Tuschy S, et al. Adiposity patients registry initiative and the German competence net obesity. body mass index, waist circumference, and waist-to-height ratio as predictors of cardiometabolic risk in childhood obesity depending on pubertal development. J Clin Endocrinol Meta. 2013 Aug 1;98(8):3384-93.
7. Mokha JS, Srinivasan SR, DasMahapatra P, Fernandez C, Chen W, Xu J, Berenson GS. Utility of waist-to-height ratio in assessing the status of central obesity and related cardiometabolic risk profile among normal weight and overweight/obese children: The Bogalusa Heart Study. BMC Pediatr. 2010;10(1).
8. Schneider HJ, Klotsche J, Silber S, Stalla GK. Measuring abdominal obesity: Effects of height on distribution of cardiometabolic risk factors risk using waist circumference and waist-to-height ratio. Diabetes Care. 2011;34(7).
the association between waist-to-height ratio and incidence of cardiovascular disease: the suita study. J Epidemiol. 2013;23:351-9.
10. Hsieh SD, Yoshinaga H. Do people with similar waist circumference share similar health risks irrespective of height? Tohoku J. Exp Med. 1999;188:55-60.
11. Ashwell M, Hsieh SD. Six reasons why the waist-to-height ratio is a rapid and effective global indicator for health risks of obesity and how its use could simplify the international public health message on obesity. Int. J. Food Sci. Nutr. 2005;56:303-7.
12. Ashwell M, Gunn P, Gibson S. Waist-to-height ratio is a better screening tool than waist circumference and BMI for adult cardiometabolic risk factors: Systematic review and meta-analysis. Obes Rev. 2012;13:275-86.
13. Geneva: World Health Organization. Waist circumference and waist-hip ratio. report of who expert consultation, 2008. 2011. Available at: https://www.who.int/nutrition/publications/obesity/ WHO_report_waistcircumference_and_waisthip_rat io/en/.
14. Yanga F, Lei SF, Chena XD. Receiver-operating characteristic analyses of body mass index, waist circumference and waist to-hip ratio for obesity: Screening in young adults in central south of China. Clin Nut. 2006;25:1030-9.
15. Ashwell, M. The Ashwell shape chart-a public health approach to the metabolic risks of obesity. Int. J. Obes. 1998;22(213).
16. Sung R, Yu C, Choi K, McManus A et al. Waist circumference and body mass index in Chinese children: Cutoff values for predicting cardiovascular risk factors. Int J Obes. 2007;31:550-8.
17. Browning LM, Hsieh SD, Ashwell M. A systematic review of waist-to-height ratio as a screening tool for the prediction of cardiovascular disease and diabetes: 0.5 could be a suitable global boundary value. Nutr Res Rev. 2010;23:247-69.
18. Greiner M, Pfeiffer D, Smith R. Principles and practical application of the receiver-operating characteristic analysis for diagnostic tests. Prev Vet Med. 2000;45:23-41.
19. Obuchowski NA, Lieber ML. Confidence intervals for the receiver operating characteristic area in studies with small samples. Acad Radiol. 1998;5:561-71.
20. Kurpad SS, Tandon H, Srinivasan K, Kurpad SS, Tandon H, Srinivasan K. Waist circumference correlates better with body mass index than waist-to-hip ratio in Asian Indians. Natl Med J India. 2002;16:189-92.
21. Corrêa MM, Tomasi E, Thumé E, Oliveira ER, Facchini LA. Waist-to-height ratio as an
anthropometric marker of overweight in elderly Brazilians. Cadernos de saude publica. 2017;33(5). 22. Neovius M, Linné Y, Rossner S. BMI,
waist-circumference and waist-hip-ratio as diagnostic tests for fatness in adolescents. Int J Obes Lond. 2005;29:163-9.
23. Marjani A. Waist circumference, body mass index, hip circumference and waist-to-hip ratio in type 2 diabetes patients in Gorgan, Iran. J Clindiag Res. 2011;5:201-5.
24. Ashwell M. Charts based on body mass index and waist-to-height ratio to assess the health risks of obesity: a review. Open Obes J. 2011;3:78-84. 25. Xu F, Wang YF, Lu L, Liang Y, Wang Z, Hong X,
et al. Comparison of anthropometric indices of obesity in predicting subsequent risk of hyperglycemia among Chinese men and women in Mainland China. Asia Pac J Clin Nutr. 2010;19:586-93.
26. Zaher ZM, Zambari R, Pheng CS, Muruga V, Ng B, Appannah G, et al. Optimal cut-off levels to define obesity: Body mass index and waist circumference, and their relationship to cardiovascular disease, dyslipidaemia, hypertension and diabetes in Malaysia. Asia Pac J Clin Nutr. 2009;18:209-16. 27. Hubert HB, Feinleib M, McNamara M, Castelli W.
Obesity as an independent risk factor for cardiovascular disease: a 26-year follow-up of participants in the Framingham heart study. Circulation. 1983;67:968-76.
28. Calle EE, Thun MJ, Petrelli JM, Rodriguez C, Weath CW. Body-mass index and mortality in a prospective cohort of U.S. adults. New Engl J Med. 1999;341:1097-105.
29. Ashwell M, Gibson S. Waist-to-height ratio as an indicator of “early health risk”: simpler and more predictive than using a “matrix” based on BMI and waist circumference. BMJ Open. 2016;6:e010159. 30. Deurenberg-Yap M, Chew SK, Deurenberg P.
Elevated body fat percentage and cardiovascular risks at low body mass index levels among Singaporean Chinese, Malays and Indians. Obes Rev. 2002;3:209-15.
31. World Health Organization. Obesity: preventing and managing the global epidemic. Geneva: World Health Organization; (Technical Report Series, 894), 2000. Available at: https://www.who.int/nutrition/publications/obesity/ WHO_TRS_894/en/.
Cite this article as: Anwar S, Aleem B, Rashid HH, Moslhey GJ.Which is a better marker for
overweight: waist height ratio or waist