1
Evaluation of Three Different Selective Media for Enumeration of Clostridium perfringens in Untreated and Treated Wastewater
A.J. Karon
A Technical report submitted to the faculty of the University of North Carolina at Chapel Hill in partial fulfillment of the requirements for the degree of Masters of Science in Public Health in
the Environmental Science and Engineering department
Chapel Hill
2016
Approved by:
Mark Sobsey, PhD
Jill Stewart, PhD
2 ABSTRACT
A.J. Karon: Evaluation of Three Different Selective Media for Enumeration of Clostridium perfringens in Untreated and Treated Wastewater
(Under the direction of Mark Sobsey)
Current and emerging legislation in North Carolina and other regions calls for the
enumeration of Clostridium perfringens as a surrogate indicator for protozoan parasites in
various types of waters. Past studies that have evaluated selective media for the detection of this
bacterium have provided limited, conflicting, and inconclusive results. In this study membrane
filtration was used to enumerate C. perfringens as culturable spores or total culturable cells in 19
samples of untreated and 25 samples of partially treated wastewaters on three candidate media,
Tryptose Sulfite Cycloserine Agar (TSC), CP ChromoSelect Agar (CCP), and membrane
Clostridium perfringens Agar (m-CP) in parallel, and the results were compared. Presumptive
isolates from each agar were further subjected to phenotypic confirmation tests for acid
phosphatase production and stormy fermentation to determine the performance of each agar. The
CCP agar was determined to have the highest enumerative capacity of total C. perfringens cells
when compared to both TSC agar and m-CP agar (p-value < 0.05), but there was no significant
difference in its ability to detect spores when compared to TSC agar (p-value >0.05). The overall
specificity of CCP agar as determined by agreement of results from both confirmation tests was
0.81, while the specificity of TSC agar was only 0.28. Based on its performance, ease of
preparation and use and consistency of colony characteristics, CCP agar is recommended as the
3
Table of Contents
LIST OF TABLES ... 3
LIST OF FIGURES ... 6
INTRODUCTION ... 4
OBJECTIVE ... 9
REVIEW OF THE LITERATURE ... 9
Clostridium perfringens ... 9
Clostridium perfringens Agar Media Comparison ... 11
Phenotypic Confirmation Tests ... 16
METHODS ... 18
Sample Collection ... 18
Sample handling ... 21
Clostridium perfringens Analysis Procedures ... 21
Membrane Filtration Method ... 23
Acid-phosphatase Confirmation Method ... 26
Stormy Fermentation Method ... 26
Clostridium perfringens Data Analysis Procedures ... 27
RESULTS ... 29
DISCUSSION ... 49
Limitations……….55
CONCLUSION ... 556
Future Work ... 567
APPENDIX 1: Raw Data Tables and Contingency Tables ... 578
APPENDIX 2: Clostridium perfringens bench sheet ... 656
4
LIST OF TABLES
Table 1. Summary of Wastewater Treatment Processes and Sample Collection Scheme………20 Table 2. Number and type of samples analyzed by treatment plant………..20 Table 3. Central tendency statistics and ranges for concentrations of presumptive C. perfringens detected by TSC, CCP, and M-CP agars in pasteurized and unpasteurized samples of
untreated sewage and secondary treated effluent………...37
Table 4. Results of Friedman test comparing the matched concentrations of total
C. perfringens and spores in secondary treated sewage effluent as detected by TSC, CCP,
and m-CP agars………..42 Table 5. Results of the Dunn Multiple Comparison post-test comparing the matched
concentrations of total C. perfringens and spores in secondary treated sewage effluent
as detected by TSC, CCP, and M-CP agars………...42 Table 6. Results of the Wilcoxon matched-pairs signed-ranks test comparing the
concentrations of total C. perfringens and spores in untreated sewage as detected by
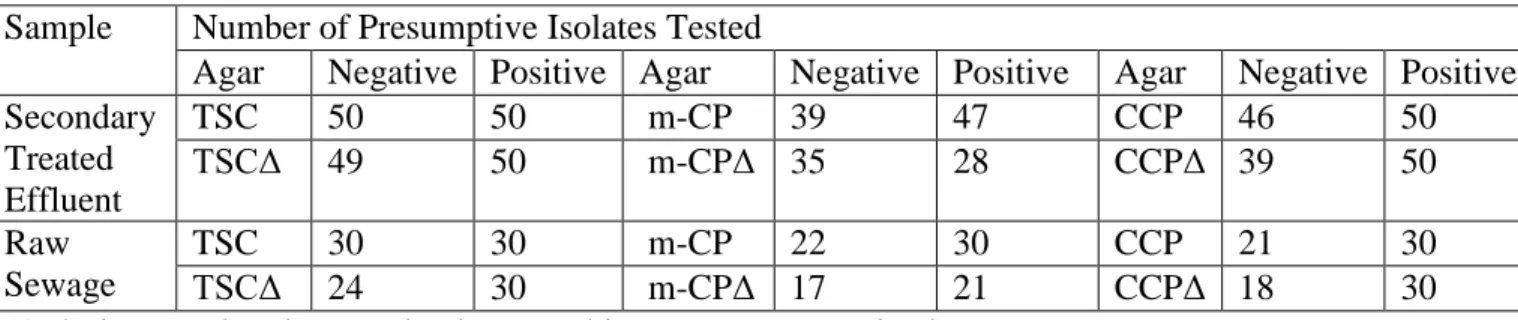
TSC and CCP agars………..43 Table 7. Summary of the number of presumptive isolates tested for acid phosphatase
production and stormy fermentation in iron milk from each agar type and sample type………..45 Table 8. Contingency Table with results from AP and SF Reactions of total combined
presumptive positive and negative C. perfringens colonies in pasteurized and
unpasteurized samples………...…45
Table 9. Sensitivities and specificities of each agar as determined by agreement of presumptive isolates with phenotypic confirmation testing for acid phosphatase production or stormy fermentation in untreated sewage and secondary treated effluent
samples………..…46 Table 10. Positive Predictive Values (PPV) and Negative Predictive Values (NPV) of
each agar as determined by agreement of presumptive isolates with phenotypic confirmation testing for acid phosphatase production or stormy fermentation in
untreated sewage and secondary treated effluent samples..………..47
Table 11. Results of Wilcoxon-Mann-Whitney test to compare if distribution of confirmation test results differ between untreated raw sewage and secondary
treated effluent………..48
Table 12. Results of McNemar’s test to compare the results of the phenotypic confirmation tests of presumptive isolates from each agar medium for both
pasteurized and unpasteurized samples. ………..49
Table 13. Concentrations (CFU/100 mL) of total C. perfringens cells as detected
5
Table 14. Concentrations (CFU/100 mL) of C. perfringens spores as detected by TSC, CCP, and m-CP agars for each sample analyzed………59
Table 15: Contingency Table for AP and SF Reactions of TSC Presumptive Positive C.
perfringens Colonies of Unpasteurized Samples………...…61 Table 16: Contingency Table for AP and SF Reactions of TSC Presumptive Negative C.
perfringens Colonies of Unpasteurized Samples………...…61
Table 17: Contingency Table for AP and SF Reactions of CP ChromoSelect Presumptive
Positive C. perfringens Colonies of Unpasteurized Samples………....61
Table 18: Contingency Table for AP and SF Reactions of CP ChromoSelect Presumptive
Negative C. perfringens Colonies of Unpasteurized Samples………...61
Table 19: Contingency Table for AP and SF Reactions of m-CP Presumptive Positive C.
perfringens Colonies of Unpasteurized Samples………..….62
Table 20: Contingency Table for AP and SF Reactions of m-CP Presumptive Negative C.
perfringens Colonies of Unpasteurized Samples………...……62
Table 21: Contingency Table for AP and SF Reactions of TSC Presumptive Positive C.
perfringens Colonies of Pasteurized Samples………62
Table 22: Contingency Table for AP and SF Reactions of TSC Presumptive Negative C.
perfringens Colonies of Pasteurized Samples………62 Table 23: Contingency Table for AP and SF Reactions of CP Chromoselect Presumptive
Positive C. perfringens Colonies of Pasteurized Samples………...63
Table 24: Contingency Table for AP and SF Reactions of CP Chromoselect Presumptive
Negative C. perfringens Colonies of Pasteurized Samples………...63
Table 25: Contingency Table for AP and SF Reactions of m-CP Presumptive Positive C.
perfringens Colonies of Pasteurized Samples………63 Table 26: Contingency Table for AP and SF Reactions of m-CP Presumptive Negative C.
perfringens Colonies of Pasteurized Samples………63
Table 27: Contingency Table for AP and SF Reactions of total combined presumptive
positive C. perfringens colonies in pasteurized and unpasteurized samples……….64
Table 28: Contingency Table for AP and SF Reactions of total combined presumptive
6
LIST OF FIGURES
Figure 1. Box and Whisker plot of the distribution of mean concentrations of C. perfringens in secondary treated sewage samples for the TSC, CCP, and m-CP agars………30 Figure 2. Box and Whisker plot of the distribution of mean concentrations of C. perfringens spores in pasteurized secondary treated sewage samples for the TSC, CCP, and M-CP agars….31 Figure 3. Log concentrations of total C. perfringens in secondary treated sewage effluent by sample week as detected by the TSC, CCP, and M-CP agars………...32
Figure 4. Log concentrations of C. perfringens spores in pasteurized secondary treated sewage effluent by sample week as detected by the TSC, CCP, and M-CP agars……….32
Figure 5. Box and Whisker plot of the distribution of mean concentrations of C. perfringens in untreated sewage samples for the TSC, CCP, and M-CP agars. ………...34
Figure 6. Box and Whisker plot of the distribution of mean concentrations of C. perfringens spores in pasteurized untreated sewage samples for the TSC, CCP, and M-CP agars…………..35
Figure 7. Log concentrations of total C. perfringens in untreated sewage by sample week as detected by the TSC, CCP, and M-CP agars……….35 Figure 8. Log concentrations of C. perfringens spores in pasteurized untreated sewage by sample week as detected by the TSC, CCP, and M-CP agars………36
7
INTRODUCTION
As water scarcity becomes a more prevalent global issue in the face of climate change
and water source depletion, the need for alternative sources of water for drinking, industrial
purposes, and agriculture is becoming increasingly important. One type of alternative water
resource that is gaining interest world-wide, and especially in drought-prone areas, is treated
wastewater or reclaimed water. The state of North Carolina serves as one example of a state
looking to utilize reclaimed water to ensure a more sustainable future for its water resources
going forward. In 2011, North Carolina passed legislation revising the regulation of reclaimed
water that specified a new, higher quality reclaimed water with expanded allowable uses of such
reclaimed water for agricultural and industrial purposes (subchapter 02U – Reclaimed Water)
(NC DENR, 2011). Following this action, in 2014, the North Carolina legislature again expanded
the allowable uses for this reclaimed water to include mixing with source waters for potable
drinking water supplies at an approved ratio to then be further treated to produce drinking water
(Session Law 2014-113 Senate Bill 163).
The N.C. sponsored legislation enabling expansion of allowable uses for reclaimed water
also established specific quality guidelines for the higher quality reclaimed water, named type 2
reclaimed water, as the only category of reclaimed water that would be allowed for these
expanded uses (subchapter 02U – Reclaimed Water) (NC DENR, 2011). In order to meet the
criteria for Type 2 reclaimed water, these waters had to be treated by tertiary treatment and dual
disinfection (i.e., chlorine disinfection and UV disinfection or allowable substitutes), and have
more extensive quality testing than previously necessary for other treated wastewaters or type 1
reclaimed water. Included among these new quality tests was testing the type 2 tertiary treated
8
indicator for protozoan parasite pathogens. For water to be considered type 2 grade, reclaimed
water treatment had to demonstrate a greater than 4 log10 reduction of C. perfringens from raw
sewage and have a geometric mean of no more than 5CFU/100 mL with a daily maximum of 25
CFU/100 mL of treated water (subchapter 02U – Reclaimed Water,NC DENR, 2011).
While these new regulations contained specifications in regard to the ultimate quality of
the water being created to satisfy the type 2 quality requirements, there was no mention of the
appropriate methods to be used for proper enumeration of C. perfringens in reclaimed water and
wastewater samples. Furthermore, US EPA methods and Standard Methods for the Examination
of Water and Wastewater do not provide or cite official documentation for the best or acceptable
methods for enumerating C. perfringens in treated wastewater samples such as those that will be
produced in North Carolina in the coming years. Several methods have been described by both
US EPA and Standard Methods for the Examination of Water and Wastewater for C. perfringens
enumeration in other types of waters such as surface waters and drinking waters, but the
performance of these methods has not been evaluated, adapted, performance-validated,
documented and certified for this specific application to reclaimed water. Additionally, new
methods for enumeration of C. perfringens in water samples continue to be developed, but there
has been either poor or little proper documentation of any methods being adequate or superior to
any of the others available. This leads to confusion and uncertainties about how to properly
measure C. perfringens in both treated wastewaters and other types of waters that urgently needs
to be clarified. Analytical methods that are documented to be accurate and effective are needed
to enable entities such as North Carolina state water utilities as well as other stakeholders
world-wide who wish to enumerate C. perfringens as an indicator for protozoan parasites in various
9
OBJECTIVE
The purpose of this research was to measure the effectiveness of three different available
selective agars for enumeration of C. perfringens using membrane filtration to determine the best
methods for measuring this bacterium in wastewater and treated wastewater samples. These
agars would then be further validated by subjecting presumptive C. perfringens colony isolates
from them to several different confirmation tests to provide a more rigorous assessment of the
performance of the selective agars.
REVIEW OF THE LITERATURE
Clostridium perfringens
Clostridium perfringens is a Gram-positive, anaerobic, spore-forming, rod-shaped,
non-motile, sulfite-reducing bacterium that inhabits the intestinal tract tracts of humans and other
animals, is shed fecally and is present in raw sewage at concentrations of 10,000-100,000 CFU
per 100 mL (Fujioka 1985, Bisson and Cabelli 1980, Payment and Franco 1993; Sorenson 1989).
It is also found widespread in the environment, although its sources when present in the
environment are uncertain (Petit 1999). It is commonly found in the enteric tracts of humans and
animals and some strains or variants can be pathogenic under certain circumstances and cause
gastrointestinal illness (Petit 1999; McClane 1996). C. perfringens has been recognized as an
indicator of fecal contamination of water for over 100 years (Klein and Houston 1899).
10
after treatment, with vegetative cells found in higher proportions in untreated wastewater, but
spores found in higher proportions after heat or chlorine treatment (Bisson and Cabelli 1980). C.
perfringens was proposed as a possible fecal indicator for protozoan parasites such as Giardia
and Cryptosporidium in fecally contaminated water primarily because of its ability to produce
spores that survive for long periods of time in the environment and are relatively resistant to
disinfection processes like the cysts and oocysts of protozoan parasites (Klein and Houston 1899;
National Academy of Sciences, 2004; Payment and Franco, 1993; Bisson and Cabelli 1980).
Previous studies have also identified C. perfringens vegetative cells and/or spores in
concentrations statistically correlated to enteric viruses, Giardia cysts and Cryptosporidium
oocysts in surface water samples (Payment and Franco 1993, Ferguson et al. 1996). Studies have
further demonstrated that detection of no C. perfringens in surface waters had a positive
predictive values for absence of pathogens in the same waters (Rimhanen-finne et al. 2004). C.
perfringens spores have been detected in increased quantities in water after sewage overflow
events (Ferguson et al. 1996) and in soils after widespread flooding of animal agriculture areas
(Casteel et al., 2006). Though it is most frequently used as an indicator of protozoan parasites, in
some cases C. perfringens in surface water have had no correlation with the presence of
protozoan cysts or oocysts (Rimhanen-finne et al. 2004). However, there have been objections to
use of C. perfringens as a fecal indicator because of a historical lack of a reliable way to quantify
it as well as the persistence of spores in the environment (specifically in soil and sediment) that
may not correlate with the actual degree of fecal contamination in surface waters (Fujioka et al.
1985; Davies 1995; Cabelli 1978). Despite these concerns about its value and effectiveness as a
11
reliably detected and quantified by membrane filtration methods using specific plating media
following the success of the methods originally developed by Bisson and Cabelli (1980).
Clostridium perfringens Agar Media Comparison
Several previous studies have attempted to compare the best methods for detection of C.
perfringens in various settings including both food and various water sources. Three agars are
currently produced and widely available for use in a lab setting that claim to select for C.
perfringens from water samples. These agars are membrane Clostridium perfringens agar
(m-CP) produced by Oxoid and other commercial sources, Clostridium perfringens ChromoSelect
agar (CCP) produced by Fluka, and tryptose-sulphite-cycloserine agar (TSC) produced by EMD
Millipore and other commercial sources. In addition to using the direct count method of
membrane filtration, there is also a most probable number multiple fermentation tube method,
several pour-plate methods, and a pour tube method (Bisson and Cabelli 1979). These other
methods were not considered in this study for direct detection and quantification because they
were not as accessible or easy to use in the context of water testing labs in North Carolina.
Additionally, non-membrane filtration methods have been noted to suffer from deficiencies that
limit their use in detection from water and wastewater samples such as the need for sub-culturing
for confirmed identification, the increased difficulties in analyzing large volumes of water, the
somewhat reduced precision of most-probable-number methodologies compared to colony
counts, and unclear growth appearance or colony morphologies for definitive identification
12
the known property of the bacteria for sulphite reduction that many Clostridia species share
(Bisson and Cabelli 1979).
There are a few key differences that characterize each of the selective agars evaluated in
this study. The m-CP agar uses sucrose as a nutrient and requires supplemental additives:
indoxyl-β-D-glucoside, phenolphthalein diphosphate, polymyxin B and D-cycloserine. The agar
produces yellow/beige colonies that will turn pink after exposure to ammonia fumes. The TSC
agar uses sodium metabisulfite and ferric ammonium citrate to indicate sulfite reduction and
D-cycloserine antibiotic as a supplement that inhibits the growth of some other bacteria that could
cause interference. It produces black colonies with a yellow halo. The CCP agar uses ammonium
iron (III) citrate, a chromogenic mixture, L-cysteine hydrochloride, magnesium heptahydrate,
soy peptone, sucrose, tris buffer, tryptose, yeast extract and D-cycloserine as an antimicrobial
supplement. The colonies this agar grows will turn green in color after an hour of exposure to an
aerobic environment, following anaerobic incubation for colony growth (Manafi 2013).
Several culture methods exist for enumerating C. perfringens from food origins. Studies
have attempted to quantify and explain the differences among the various media that are used to
recover this bacterium from food samples. Of the three selective agars that are used for
membrane filtration, only TSC has been used to culture C. perfringens from food sources (Byrne
et al 2007, De Jong 2003, Hauschild & Hilsheimer 1973, Mead 1985). Food microbiology
studies have assessed TSC in comparison to SFP, OPSP, RCA, BHI, SCA, and DCA agars, in
addition to TYD-C, DRCM, PEM, and LS liquid media (Byrne et al 2007, De Jong 2003,
Hauschild & Hilsheimer 1973, Mead 1985). Although differing slightly in each experimental
setup, each study concluded that TSC was either most useful or equally useful to any of the other
13
De Jong 2003, Hauschild & Hilsheimer 1973, Mead 1985). Two of these studies differed in use
of TSC agar from working with water samples in that they used a pour plate or spread plate
method instead of membrane filtration (Hauschild and Hilsheimer 1973, De Jong 2003). There
were conflicting findings among the researchers as some found that TSC agar was limited in its
ability to allow C. perfringens to form spores, while others found that it was better for recovery
of spores (Byrne et al. 2007, Mead 1985). Another stated limitation of the TSC agar was that it
was found to be a hospitable growth medium for other Clostridia species and therefore
confirmatory testing would be required (Mead 1985).
In water samples, C. perfringens has been cultured using the TSC, m-CP, and CCP agars
that have been previously described. However, there have also been studies documenting the
culturing of these bacteria with a flourogenic TSC medium (TSCF), TSN, SPS, and WB agars
(Araujo 2004, Sartory 1985). The majority of these studies have been conducted on water bodies
used for drinking water, partially treated drinking water, or fully treated drinking water. One
study by Sartory (1985) compared TSC and m-CP agars for C. perfringens in partially treated
sewage and other low quality waters. Only one previous study has compared TSC, m-CP, and
CCP agars, but included a flourogenic substrate in the TSC agar and analyzed only waters used
for potable purposes both from the source and after treatment (Manafi et al. 2013). Results from
this study demonstrated that no statistically significant difference was found among the three
agars with respect to their abilities to enumerate presumptive C. perfringens colonies. Use of the
m-CP media was determined to be onerous for the purpose of identifying presumptive positive
colonies, while the TSC agar with fluorogenic substrate was difficult to count when high
contamination was present. The CCP agar was identified as both the most specific agar and the
14
Most studies comparing the available agars were concerned mainly with the m-CP and
TSC media. Bisson and Cabelli (1979) first developed the m-CP membrane filtration method. At
the time, TYI agar pour plates (using the Bonde pour tube method) were used for enumeration of
C. perfringens in water samples (Bisson and Cabelli 1979). Using the m-CP agar that they
developed, they were able to effectively select C. perfringens from the water samples using
membrane filtration and found counts on these plates to be 10-20% lower than by using the
traditional method, but with higher accuracy (93% confirmation of positives, 98% confirmation
of negatives) (Bisson and Cabelli 1979). They also noted a colony counting limit between 85 and
120 on the upper end and low precision when 20 or fewer colonies were observed. Finally, they
found that the agar was not as successful at culturing the bacteria if 24 hours or more time had
passed between the time the bacteria were added to the water sample and the time that the assay
was conducted (Bisson and Cabelli 1979).
Following the 1979 study, several other researchers have evaluated the m-CP agar that
Bisson and Cabelli developed as well as the TSC agar that had been developed earlier. Some of
the earlier work found TSC and m-CP to have comparable abilities to enumerate C. perfringens
when analyzing untreated, partially treated, and known highly polluted surface waters. Both
agars have been observed to have greater than 90% confirmation of presumptive positives with
few or no false-negative colonies (Sartory 1985). Additionally, it was noted that TSC was
significantly easier to use and a fraction of the price of m-CP agar (Sartory 1985).
Other researchers quantifying the difference between media for culturing C. perfringens
have analyzed drinking water or source water that would later be treated for drinking or in lab
engineered water samples. A 1998 study found the m-CP agar to be more selective than TSC for
15
vegetative cells and spores in these samples (Sartory 1998). These findings were in contrast to
previous findings from food based studies that found TSC a poor medium for culturing spores.
However, the findings in this study were later validated by Maheux et al. (2013) who found high
rates of confirmation of isolates previously cultured on m-CP agar from engineered waters with a
panel of known strains of C. perfringens and also natural C. perfringens present in sewage that
was added to test water.
In natural water sources for drinking and recreational use, TSC has been observed to have
greater success at accurately detecting the presence of C. perfringens in water samples that have
lower concentrations of the bacteria (Sartory, 1998; Manafi 2013). Researchers have also noted
various levels of success with TSC when confirming isolates, ranging from 68% to 87%
confirmation (Aurajo 2004; Sartory 1998). Further, researchers using TSC have had even
broader ranges of conflicting results when confirming presumptive negative colonies, ranging
from 100% confirmation of negatives to only 31.9% confirmation of negative colonies (Aurajo
2004; Sartory 1998). Only one study has evaluated this agar for its ability to detect both spores
and vegetative cells (Sartory 1998). Evaluation of m-CP in the same waters has had similar
mixed results in which some researchers have empirically found both low (<50%) and high
(>95%) confirmation rates of presumptive positive and presumptive negative colonies when
subjecting isolates to phenotypic biochemical testing (Burger et al. 1984; Sartory 1998; Maheux
2013; Armon and Payment 1987).. However, in several studies m-CP has been noted as a less
preferred agar to TSC (Sartory 1998; Araujo 2004; Manafi et al. 2013). M-CP agar has been
noted to have significantly lower enumerative capacity to TSC and observed to have high rates
of false-positivity and false-negativity for both spores and vegetative cells (Sartory 1998; Araujo
16
identify based on the varying shades of pink observed after exposing colonies to potassium
hydroxide (Sartory 1998, Manafi et al. 2013).
Only one peer-reviewed study has evaluated CCP agar. Manafi et al. (2013) compared
the CCP, m-CP and TSC agar containing a fluorogenic substrate (TSCF) to detect spores from
drinking water samples and partially treated drinking water samples. They found C. perfringens
on CCP and the TSCF agars were easy to count and subculture. However, they found all three
agars comparable at quantifying the bacteria in their samples. However, they selected CCP as the
preferred agar because of its ease of preparation and use as well as the ease in identifying
positive colonies from the agar.
It is apparent that the studies conducted to this point have given an inadequate evaluation
of the best methods for detection of C. perfringens from wastewater and treated wastewater
samples via membrane filtration. The bulk of studies that have evaluated the agars of interest
have been related to drinking water and not wastewater. Additionally, results have been
conflicting and the error ranges for confirmation of presumptive positive colonies have varied
widely. According to most of the literature, TSC appears to be a preferred agar to m-CP, but very
little work has been conducted to evaluate the performance and identify the possible strengths
and weaknesses of the newer CCP medium. The review of the current literature validates the
need for more extensive work to be done evaluating which of these agars is most suitable for labs
wishing to enumerate C. perfringens to meet new quality standards regarding reclaimed or other
water sources.
17
Phenotypic confirmation of C. perfringens is traditionally based on tests that demonstrate
its lack of motility, ability to reduce nitrate, ferment lactose, and cause liquefaction of gelatin
(Sartory 2006, Environment Agency UK, Eisgruber 2000). However, researchers have pointed
out that these processes are labor intensive and time consuming and the results of some of these
tests are at times unreliable (Cato et al. 1986; Barrow and Feltham 1993; Eisgruber 2000). These
traits can be tested for by inoculation into motility-nitrate medium (test for motility and nitrate
reduction) and lactose-gelatine medium (test for lactose fermentation and gelatine liquefaction)
(Eisgruber 2000). Another phenotypic confirmation test can be done by the reverse CAMP test
which uses streaking of presumptive C. perfringens isolates on sheep blood agar as described by
Hansen and Elliott (1980). A third confirmation test utilizes an iron milk based medium in which
C. perfringens produces stormy fermentation (Abeyta 1985; Erickson and Deibel 1978). Each of
these confirmation tests require incubation of at least 24 hours. The tests have also been
evaluated on previously isolated strains of C. perfringens and all have produced results
demonstrating different levels of sensitivity or specificity below 100% (Hauschild and
Hilsheimer 1974; Abeyta 1985; Eisgruber et al. 2000; Mead 1985; Hansen and Elliott 1980).
Nitrate-motility media has been found to exhibit sensitivity as low as 78% and iron-milk media
have been found to exhibit sensitivities as low as 71%, while the reverse CAMP test has
exhibited higher observed sensitivity of 94% or greater (Hauschild and Hilsheimer 1974; Mead
1985; Eisgruber et al. 2000; Hansen & Elliot 1980).
The time consuming nature and level of imprecision in these confirmation tests led to the
development of a new rapid phenotypic confirmation test that evaluated presumptive C.
perfringens for acid-phosphatase production. Developed by Ueno et al. (1970), this test exposes
18
acetate buffer. Confirmation is based on an observed color change when a colony that produces
acid-phosphatase is exposed to the reagent. This reaction takes place in minutes and has been
validated multiple times as an acceptable alternative to other phenotypic confirmation tests based
on testing with previously confirmed C. perfringens strains (Ryzinska-paier et al. 2011; Ueno et
al. 1970; Wohlsen et al. 2006; Eisgruber 2000; Sartory 2006; Mead 1981). Several studies have
identified sensitivities for this test to be around 95%, particularly for isolates obtained from
cultures of environmental waters, indicating that the tests is usually very accurate for positive
identification of isolates (Eisgruber 2000; Mead 1981; Sartory 2006; Adcock and Saint 2001).
METHODS
Sample Collection
Treated and untreated wastewater effluents were collected at five wastewater
treatment/water reclamation plants located in central North Carolina. These facilities were: (A)
the Orange Water and Sewer Authority WWTP in Chapel Hill, (B) the Raleigh Neuse River
WWTP, (C) the North Durham Water Reclamation Facility, (D) the Holly Springs WWTP and
(E) the North Cary Water Reclamation Facility.
Initially, seven secondary treated sewage effluent samples were collected from two
wastewater treatment plants (A and B) before sand filtration, and analyzed for Clostridium
perfringens. These samples were collected between May and July of 2013. Many of the final
tertiary treated and dual disinfected effluent samples had no detectable C. perfringens in 100-mL
19
Because the determination of the best methods for quantifying C. perfringens requires reliable
statistical analysis of data on quantifiable levels of the target microorganisms, samples
containing sufficient numbers of these target microbes are required. Consequently,
microbiological analysis was performed with samples collected from earlier stages in the water
reclamation process. It was found that clarified secondary effluent collected prior to sand
filtration and disinfection consistently yielded sufficient but not excessive concentrations of
Clostridium perfringens. These same treatment plant sample locations yielded sufficient
concentrations of Clostridium perfringens at all five wastewater treatment facilities for collected
samples that were partially treated samples as indicated above.
In the second stage of testing, in addition to the samples collected earlier in the treatment
process, raw sewage and final reclaimed water samples were also collected for analysis and are
included in this report. These samples were collected between August 2013 and August 2014.
During this time, 20 secondary treated effluent samples, 5 untreated sewage samples, and 10
final treated reclaimed water samples were analyzed. A third round of sampling for only
reclaimed water and untreated sewage took place between February 2015 and July 2015 in which
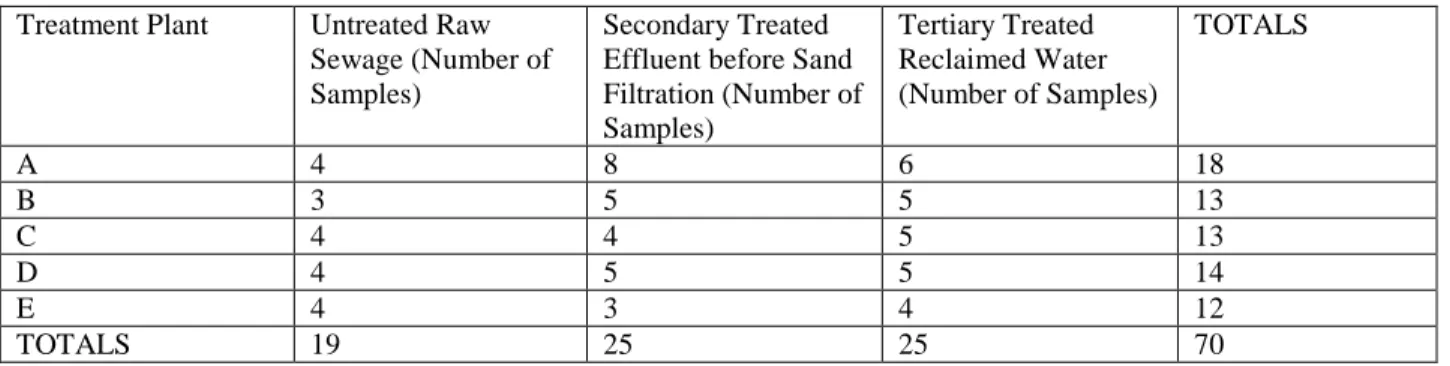
14 samples of both types were analyzed. Overall, 19 untreated sewage samples, 25 secondary
treated effluent samples, and 25 tertiary treated, dual disinfected reclaimed water samples were
analyzed. The summary of the samples is displayed in Table 2 and the sequence of sampling can
be found in Appendix 1 in Tables 12 and 13. It is important to note that not all of the reclaimed
water samples were treated by the identical physical, chemical and biological processes. These
differences are summarized in Table 1 below. This table does not include information on steps
20
and included primary clarification (sedimentation), anaerobic digestion of separated wastewater
solids, aerobic biological treatment of primary effluent by some form of activated sludge
treatment process and secondary clarification after aerobic biological treatment. Each plant,
excepting plant C, uses both free chlorine and UV disinfection in the production of reclaimed
water. Only a single disinfection treatment by UV radiation was used at plant C
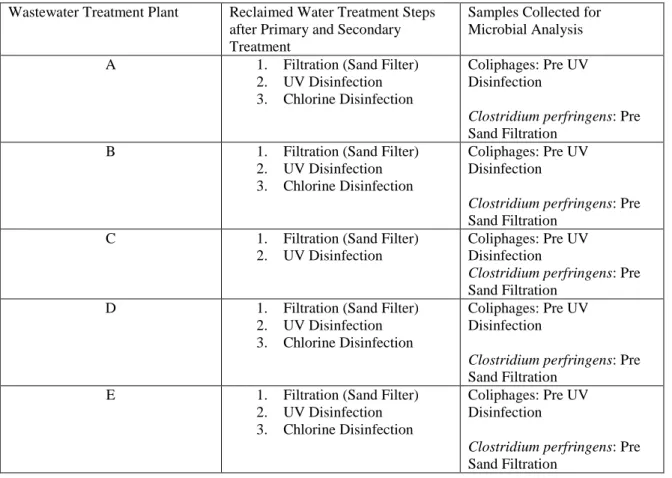
Table 1. Summary of Wastewater Treatment Processes and Sample Collection Scheme
Wastewater Treatment Plant Reclaimed Water Treatment Steps after Primary and Secondary Treatment
Samples Collected for Microbial Analysis
A 1. Filtration (Sand Filter) 2. UV Disinfection 3. Chlorine Disinfection
Coliphages: Pre UV Disinfection
Clostridium perfringens: Pre Sand Filtration
B 1. Filtration (Sand Filter) 2. UV Disinfection 3. Chlorine Disinfection
Coliphages: Pre UV Disinfection
Clostridium perfringens: Pre Sand Filtration
C 1. Filtration (Sand Filter) 2. UV Disinfection
Coliphages: Pre UV Disinfection
Clostridium perfringens: Pre Sand Filtration
D 1. Filtration (Sand Filter) 2. UV Disinfection 3. Chlorine Disinfection
Coliphages: Pre UV Disinfection
Clostridium perfringens: Pre Sand Filtration
E 1. Filtration (Sand Filter) 2. UV Disinfection 3. Chlorine Disinfection
Coliphages: Pre UV Disinfection
21
Table 2. Number and type of samples analyzed by treatment plant
Treatment Plant Untreated Raw Sewage (Number of Samples)
Secondary Treated Effluent before Sand Filtration (Number of Samples)
Tertiary Treated Reclaimed Water (Number of Samples)
TOTALS
A 4 8 6 18
B 3 5 5 13
C 4 4 5 13
D 4 5 5 14
E 4 3 4 12
TOTALS 19 25 25 70
Sample handling
Treated and raw wastewater grab samples were collected from the appropriate WWTP
sampling points in sterile polypropylene bottles, and kept chilled in coolers with ice during
transport to Chapel Hill. Sampling points were the same as those used by the treatment plants in
order to allow for the utilities’ own analysis of water samples during the various stages of the
treatment process. The samples were stored at 4°C upon arrival at the laboratory. Clostridium
perfringens assays were performed on the day of or the day following sample collection.
Samples were collected and analyzed between 5/14/2013 and 04/06/2015.
Clostridium perfringens Analysis Procedures
Procedures for C. perfringens detection and enumeration were based on standard
membrane filter (MF) methods. These methods were originally developed for US EPA by
Cabelli and Bisson (1979). The methods used are attached to this report in the form of a
laboratory ‘bench sheet’ in Appendix 2 which is intended to be an easy-to-follow, step-by-step
protocol that laboratory analysts may use to perform the analyses. Following each assay, other
22
perfringens colonies obtained by initial membrane filter analysis. As many as five individual
presumptive positive and presumptive negative C. perfringens colonies from each of the three C.
perfringens agar media tested were selected from a given sample and purified by re-streaking
onto non-selective Columbia agar media to obtain isolated colonies. Purified colony isolates
were then subjected to a test for acid-phosphatase (AP) production as described by Sartory et al.
(2006). Later on, samples analyzed on this project were subjected to a second confirmatory test
of stormy fermentation (SF) in tubes of iron milk medium to score for sulfite-reducing
Clostridium species, the category to which C. perfringens belongs.
Prior to performing the membrane filtration (MF) method, the Acid-Phosphatase (AP)
test and the Stormy Fermentation (SF) test as later described, the various media and reagents
were prepared. The three agar media used for this investigation were Membrane Clostridium
perfringens (m-CP) agar, CP ChromoSelect Agar (CCP), and Tryptose Sulfite Cycloserine
(TSC) agar. TSC agar medium was obtained from EMD Chemicals Inc. TSC agar was prepared
by adding 3.9 grams of TSC agar base /100 mL of deionized water in a 500 mL bottle,
autoclaving for 15 minutes and cooling to keep molten. The m-CP agar base (from Oxoid
Microbiology Products) was prepared by adding 7.11g of agar base /100 mL of deionized water,
autoclaving for 15 minutes and cooling to keep molten. CP ChromoSelect agar base (from Fluka
Analytical) was prepared by adding 6.28 grams/100 mL deionized water, bringing to a boil on a
hot plate and then removing to cool and keep molten. After cooling, supplements were added to
the various molten agar media as follows. CP Chromoselect and TSC agars got 0.04 grams of
D-Cycloserine per 100 mL of molten agar medium base. The m-CP agar got 0.2 mL of sterile 4.5%
ferric chloride solution, 2 mL of sterile 0.5% phenolphthalein diphosphate solution, 0.8 mL of
23
molten agar base medium. Supplemented media were dispensed in 5-mL volumes in 50 mm
diameter sterile, polystyrene Petri dishes and allowed to harden. Plates were stored at 4oC until
use.
In order to perform the various confirmation tests, the following reagents were required:
2% ferrous sulfate solution and canned evaporated milk for the iron milk medium, deionized
water, glacial acetic acid, sodium acetate (anhydrous), 1-naphtyl phosphate disodium salt, and
Fast Blue B Salt for the acid phosphatase test, as well as and Columbia agar base. Columbia agar
plates were prepared by adding 4.25 grams Columbia agar base per 100 mL deionized water in a
500 mL bottle, autoclaving for 15 minutes, dispensing into sterile polystyrene dishes and
allowing agar medium to harden. Iron milk medium for the SF test was prepared by combining
aseptically 12 oz. of canned evaporated milk, 50 mL of 2% ferrous sulfate solution, and 938 mL
of deionized water, mixing and then dispensing into glass culture tubes. Acid phosphatase
reagent was prepared as described by Ueno et al. (1970) and adapted by Mead et al. (1981) by
combining 20 mL acetate buffer, 0.4g of 1-naphtyl phosphate disodium salt and 0.8g of Fast
Blue B salt in a sterile, plastic 50 mL tube. The acetate buffer was made by combining 200 mL
of deionized water, 0.067 mL of glacial acetic acid and 0.068 grams of sodium acetate. Upon
combining the reagents for the acid-phosphatase solution, the solution was refrigerated for at
least 1 hour. The solution was then centrifuged at 3,500 rpm for 15 minutes at 4°C, and the
resulting supernatant was recovered and stored for later use.
Membrane Filtration Method
24
in reclaimed waters by standard membrane filter (MF) methods. These methods were originally
developed for US EPA by Cabelli and Bisson (1979) and further modified (Armon and Payment,
1988) by changes in the composition of the bacteriological medium, m-CP agar. Based on more
recent evidence of the inferior performance of the MF method when using m-CP medium, two
alternative C. perfringens MF media, TSB and CP ChromoSelect agar, were evaluated in parallel
with modified m-CP (Sartory et al., 1998; Manafi and Siegrist, 2011; Manafi et al., 2013). All
three agar media were applied simultaneously in MF analysis of samples of reclaimed water and
other treated and untreated wastewater. These analyses focused on samples having C.
perfringens concentrations in the range of the treated effluent limits of 5 (as geometric mean)
and 25 (as single sample maximum) per 100 mL as well as at higher concentrations, to facilitate
comparisons of agar media performance by statistical analyses. In the MF method a volume of
sample is vacuum-filtered through a standard 47 mm diameter, approximately 0.45 µM pore size
cellulose ester membrane filter. The membrane filter is placed on the surface of an agar medium
for C. perfringens (modified m-CP, TSC or CP ChromoSelect) in a Petri dish and the dish is then
incubated under anaerobic conditions at 44 °C. C. perfringens and related sulphite reducing
clostridia produce characteristic colonies that are then counted.
On TSC and CP ChromoSelect agars, C. perfringens colonies are black (although some
colonies of other colors are scored as positive as well) or green in color, respectively, and can be
directly counted. On m-CP agar C. perfringens colonies become pink after exposure to
ammonium hydroxide fumes, which is an added step in the procedure when using this medium.
Counted colonies of the distinctive color on their respective agar media are considered total
presumptive C. perfringens per the volume of water sample analyzed. If the method is used to
25
°C for 15 minutes prior to filtration in order to kill vegetative bacteria and provide colony counts
of only culturable spores. The numbers of C. perfringens colonies detected per unit volume of
test water or wastewater on the three different agar media were then compared to evaluate their
performance and to determine the absolute and relative abundance total C. perfringens (unheated
samples) and C. perfringens spores (pre-heated samples) on each agar medium (m-CP, TSC and
CP ChromoSelect).
Samples of reclaimed water, untreated wastewater, and secondary treated wastewater
before sand filtration from the five wastewater treatment plants indicated previously were
analyzed by membrane filtration using the three different agar media and were compared on the
basis of C. perfringens detected as spores only or spores plus vegetative cells. Using aliquots of 1
mL (mixed with phosphate buffer), 5 mL, 10 mL, 20 mL, or 100 mL per sample, depending on
the expected contamination level and sample type, the various samples were vacuum filtered
through a 0.45 μm pore size, 47 mm diameter cellulose ester membrane filters. Each sample
volume was plated in triplicate. Reclaimed water and raw sewage samples were filtered for only
one sample volume, while pre-sand filtered samples were filtered for either two or three different
volumes. If colony count results from a given membrane filter plate were above the detectable
limit, they were deemed too numerous to count and a value of 225 colonies was used in its place.
This colony count value was derived by multiplying by two by the average of the upper
detectable counting limit from plates in which one hundred or more colonies were counted. If a
set of triplicate membrane plates for a raw sewage sample plated on an individual agar medium
experienced no growth, a value of 0.5 colonies was assigned to one of the plates. Because raw
sewage samples had to be diluted to display countable colonies, a plate detecting no C.
26
in a sewage sample, where it is expected that these bacteria will always be present. Thus, the
value of 0.5 was assigned to provide a conservative estimate of how many C. perfringens
colonies would be detected by the agar medium in an undiluted sample.
Acid-phosphatase Confirmation Method
Upon counting colonies of plates for the three test agars, presumptive positive and
negative isolated colonies were then used for performing a confirmation test with
Acid-phosphatase reagent. The method used was that of Sartory et al. (2006), which was adapted from
Ueno et al. (1970) and Mead et al. (1981). Presumptive C. perfringens colonies from membrane
filters were streaked initially onto separate non-selective Columbia agar medium plates (as many
as five presumptive positive and five presumptive negative colonies per sample type, per agar
medium) with a sterile wooden applicator stick. These plates were then grown overnight
anaerobically in a 37°C incubator. On the following day, individual colonies from these plates
were then inoculated onto a sterile cotton pad with a sterile wooden applicator stick and a 0.1 mL
aliquot of Acid-phosphatase reagent was then pipetted onto the colony. If the mixture became a
purple color after about a minute, it was scored confirmed positive by the acid-phosphatase test.
If it did not become purple, it was scored confirmed negative by the AP test.
Stormy Fermentation Method
27
agar media were further subjected to a secondary confirmation test for Stormy Fermentation in
Iron-milk medium tubes. The method for this was adapted from Abeyta et al. (1985). After the
acid-phosphatase tests, a second colony from each of the Columbia agar medium plates was
inoculated into a glass tube of ~9mL of iron-milk medium that was clearly marked to correspond
with the water sample and agar medium from which it originally came as well as its result from
the acid-phosphatase test. The inoculated tubes were then incubated for 24 hours in a 44°C
incubator and checked for stormy fermentation of the media. C. perfringens and other
sulfite-producing clostridia are positive for stormy fermentation. Results were recorded accordingly.
Clostridium perfringens Data Analysis Procedures
The data collected on C. perfringens concentration were analyzed initially using the
GraphPad Instat statistical package from GraphPad Software. All data were analyzed using
nonparametric tests, including the Friedman one-way analysis of variance test and the Dunn
Multiple Comparison Post-Test because the data were not normally distributed. These tests were
performed on direct count results obtained through membrane filtration on the three previously
described selective media. The analysis was conducted for both pasteurized and unpasteurized
samples (vegetative cells and spores and only spores) from diluted raw sewage, partially treated
sewage (before sand filtration) and tertiary treated reclaimed water. To compare the
concentrations of C. perfringens detected by TSC and CCP agars in raw sewage samples, a
Wilcoxon matched-pairs signed-ranks test was used. An alpha value of 0.05 (P <0.05), was used
to establish statistical significance. The data from these tests are displayed in Tables 4-6 below.
28
their ability to detect C. perfringens colonies, several descriptive figures were generated. Box
and whisker plots of C. perfringens concentrations per 100 mL were also used to demonstrate the
distributions of data and the differences between the three test agar media to detect C.
perfringens. These graphs were created in R.Studio (R Studio Team 2015).
In Microsoft Excel, plots were created displaying the sequential samples collected over
time as log10 concentrations of total cells and only spores (Figures 3, 4, 7, 8). Time intervals
between samples in these plots were not representative of actual time intervals. Bar charts of
arithmetic average log10 concentrations were constructed in Excel in order to demonstrate
difference in detection of presumptive C. perfringens total cells and spores by agar medium for
each of the treatment plants (Figures 9-12). Bar charts were also constructed to show
comparative log10 reductions of C. perfringens spores and total cells as detected by each of the
agars based on arithmetic averages of log10 concentrations measured from untreated sewage and
final reclaimed water analyzed from each of the treatment plants (Figures 13-14).
For analysis of the confirmation test results, data were analyzed in Microsoft Excel and
Stata 14 (StataCorp 2015). In Excel, the data were analyzed to determine the extent to which
each C. perfringens confirmation test result agreed with what the isolate was considered
presumptively (either C. perfringens positive of negative) when originally observed and the
colony isolated from its respective agar medium. Microsoft Excel was then used to generate
sensitivities, specificities, positive predictive values, and negative predictive values. The
confirmation tests were also compared against each other using McNemar’s test in Stata14
(StataCorp 2015) to determine if the results of the tests were significantly different from each
29
RESULTS
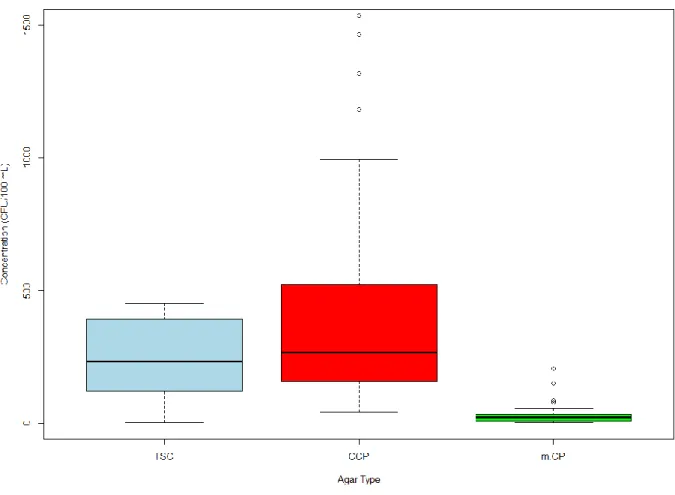
The geometric mean of total C. perfringens concentrations in secondary treated effluent
as detected by the TSC, CCP, and m-CP media were 263 CFU/100 mL (SD: 147), 673 CFU/100
mL (SD:670), and 167 CFU/100 mL (SD: 263) respectively (Table 3). The median C.
perfringens values were 285 CFU/100 mL, 636 CFU/100 mL and 185 CFU/100 mL for each
respective agar (Table 3 and/or Figure 1). For the same secondary treated samples, the ranges of
C. perfringens concentrations on TSC agar were from 6 to 615 CFU/100 mL, on CCP agar from
161 to 2285 CFU/100mL, and on m-CP agar from 11 to 855 CFU/100 mL (Table 3 and/or Figure
1). TSC had the smallest range for detection of total C. perfringens cells in secondary treated
wastewater (Figure 1). CCP had the largest minimum and maximum detection of all agars, and
also had several observations that were outliers from the other samples (Figures 1 and 3). The
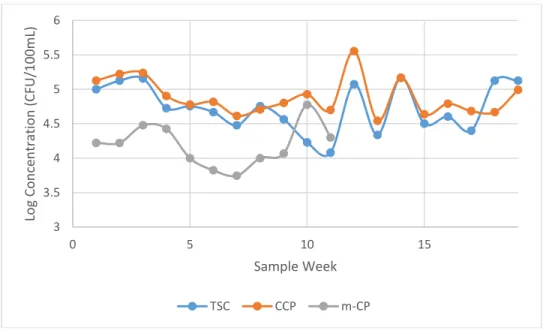
results for concentrations of total C. perfringens in unpasteurized samples of secondary treated
effluent as detected on the different agar media are summarized in Appendix 1 in Table 13 and
they are displayed in sequential samples collected over the sampling period as log10
concentrations in Figures 3 and 4 for total cells and spores, respectively. The intervals between
samples are not representative of actual time intervals as samples were not taken over uniform
time periods.
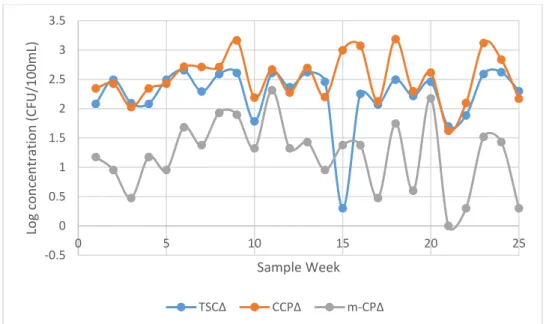
The results for C. perfringens spore concentrations in pasteurized secondary treated
sewage samples as detected on the three agar media tested are shown in Appendix 1 in Table 14.
In these pasteurized secondary treated sewage samples, the geometric mean and median
concentrations of C. perfringens spores for TSC, CCP, and m-CP agars were 176 (SD: 134) and
233 CFU/100 mL, 332 (SD: 441) and 267 CFU/100 mL, and 16 (SD: 48) and 21 CFU/100 mL
30
treated effluent ranged from 2 to 452 CFU/100 mL for TSC, 42 to 1535 CFU/100 mL for CCP,
and 1 to 206 CFU/100 mL for m-CP agar media, respectively (Table 3 and Figure 2). Both CCP
and m-CP agars had weeks in which the observed concentration of presumptive C. perfringens
spores were outliers with respect to the other secondary treated effluent samples that were
analyzed (Figure 2). The overall range of spore concentrations as detected by m-CP was much
narrower than that of the other two agars (Figure 2). The results for C. perfringens spore
concentrations in pasteurized secondary treated sewage samples as detected on the three agar
31
Figure 1. Box and Whisker plot of the distribution of mean concentrations of C. perfringens in secondary treated sewage samples for the TSC, CCP, and m-CP agars (n=25).
32
Figure 3. Log concentrations of total C. perfringens in secondary treated sewage effluent by sample week as detected by the TSC, CCP, and m-CP agars
Figure 4. Log concentrations of C. perfringens spores in pasteurized secondary treated sewage effluent by sample week as detected by the TSC, CCP, and m-CP agars
0 0.5 1 1.5 2 2.5 3 3.5 4
0 5 10 15 20 25
Lo g Con ce n tra tio n (CFU /100 m L) Sample Week
TSC CCP m-CP
-0.5 0 0.5 1 1.5 2 2.5 3 3.5
0 5 10 15 20 25
Lo g co n ce n tra tio n (CFU /100 m L) Sample Week
33
After sampling and analyzing 11 untreated raw sewage samples, m-CP agar was
determined to have significantly lower detection capacity of both total cells and spores than the
other two agars. As a result, analysis of these samples with m-CP agar was halted (Figures 5-8).
In untreated sewage samples, the geometric average C. perfringens concentrations were 5.36*104
CFU/100 mL (SD: 4.91*104), 7.73*104 CFU/100 mL (SD: 7.71*104), and 1.54*104 CFU/100
mL (SD: 1.55*104) for TSC, CCP, and m-CP agars respectively (Table 3 and Figure 5). The
median C. perfringens concentrations as detected by each of the agars in the same untreated
sewage samples were 5.33*104 CFU/100 mL, 6.33*104 CFU/100 mL, and 1.67*104 CFU/100
mL for TSC, CCP, and m-CP agars, respectively (Figure 5 and Table 3). The ranges of total cell
concentrations of C. perfringens in these same sewage samples on TSC were from 1.2 *104 to
1.47 *105 CFU/100 mL, on CCP from 3.50*104 to 3.58*105 CFU/100 mL, and on m-CP from
5.56*103 to 5.97*104 CFU/100 mL. The distributions of total cell detection by TSC and CCP
were skewed upwards for untreated sewage samples (Figure 5). Similar to what was seen when
analyzing the secondary treated effluent, CCP agar had the highest maximum and minimum
concentration detected from the samples of the three media tested and the m-CP agar had the
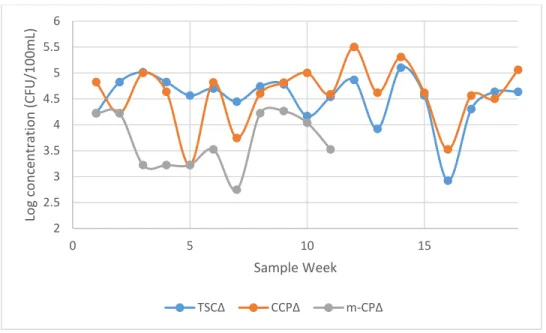
narrowest range of detection of total cells in raw sewage (Figure 5). The results for total C.
perfringens concentrations in samples of untreated sewage as detected on the different agar
media are summarized in Appendix 1 in Table 13 and they are shown in sequential samples
collected over the sampling period as log10 concentrations in Figures 7 and 8 for total cells and
spores, respectively. The intervals between samples not representative of actual time intervals as
samples were not taken over uniform time periods.
In the pasteurized untreated sewage samples, the average and median concentrations of
34
mL, 3.87*104 (SD: 7.64*104) and 4.17*104 CFU/100 mL, and 4.73*103 (SD: 1.40*102) and
3.3*103 CFU/100 mL respectively (Table 3 and Figure 6). C. perfringens spore concentrations in
these samples of pasteurized untreated sewage ranged from 8.3*102 to 1.3*105 CFU/100 mL on
TSC, 1.7*103 to 3.2*105 CFU/100 mL on CCP, and 5.6*102 to 1.8*104 CFU/100 mL on m-CP,
respectively (Table 3). Both CCP and TSC agars had weeks in which the observed concentration
of presumptive C. perfringens spores were outliers with respect to the other untreated sewage
samples that were analyzed (Figure 6). Again, the overall range of spore concentrations as
detected by m-CP was much narrower than that of the other two agars (Figure 6). The
distribution of spore detection from pasteurized untreated raw sewage was skewed upward for
both the CCP and m-CP agars (Figure 6). The individual weekly results for C. perfringens spore
concentrations in pasteurized raw sewage samples as detected on the three agar media tested can
35
Figure 5. Box and Whisker plot of the distribution of mean concentrations of C. perfringens in untreated sewage samples for the TSC, CCP, and m-CP agars (n=19).
Figure 6. Box and Whisker plot of the distribution of mean concentrations of C. perfringens spores in pasteurized untreated sewage samples for the TSC, CCP, and m-CP agars (n=19).
3 3.5 4 4.5 5 5.5 6
0 5 10 15
Lo
g Con
ce
n
tra
tio
n
(CFU
/100
m
L)
Sample Week
36
Figure 7. Log concentrations of total C. perfringens in untreated sewage by sample week as detected by the TSC, CCP, and m-CP agars (n=19)
Figure 8. Log concentrations of C. perfringens spores in pasteurized untreated sewage by sample week as detected by the TSC, CCP, and m-CP agars (n=19)
For reclaimed water, no C. perfringens colonies were detected in the samples from the
four treatment plants with combined chlorine and UV disinfection. In three samples from
treatment plant C, with only UV disinfection of tertiary treated sewage, C. perfringens colonies
were detected on all three agar media, with TSC enumerating 40, 70, and 22 CFU/100 mL, CCP
enumerating 20, 40, and 46 CFU/100 mL, and m-CP enumerating 3, 10, and 39 CFU/100 mL,
respectively. 2 2.5 3 3.5 4 4.5 5 5.5 6
0 5 10 15
Lo
g co
n
ce
n
tra
tio
n
(CFU
/100
m
L)
Sample Week
37
Table 3. Central tendency statistics and ranges for concentrations of presumptive C. perfringens detected by TSC, CCP, and m-CP agars in pasteurized and unpasteurized samples of untreated sewage and secondary treated effluent.
Central Tendency Statistic and Range
Unpasteurized Untreated Sewage (n=19)
Pasteurized Untreated Sewage (n=19)
TSC CCP m-CP TSC CCP m-CP
Geometric Mean (CFU/100 mL)
5.36E+04 7.73E+04 1.54E+04
3.27E+04 3.87E+04 4.73E+03 Median
(CFU/100 mL)
5.33E+04 6.33E+04 1.67E+04
4.33E+04 4.17E+04 3.33E+03 Minimum Value
(CFU/100 mL)
1.20E+04 3.50E+04 5.56E+03
8.33E+02 1.67E+03 5.56E+02 Maximum Value
(CFU/100 mL)
1.47E+05 3.58E+05 5.97E+04
1.27E+05 3.17E+05 1.83E+04 Unpasteurized Secondary Treated
Effluent (n=25)
Pasteurized Secondary Treated Effluent (n=25)
TSC CCP m-CP TSC CCP m-CP
Geometric Mean
(CFU/100 mL) 263 673 167 176 332 16
Median
(CFU/100 mL) 285 636 185 233 267 21
Minimum Value
(CFU/100 mL) 6 161 11 2 42 1
Maximum Value
(CFU/100 mL) 615 2285 855 452 1535 206
Figures 9-12 depict the arithmetic average log10 concentrations and standard errors of C.
perfringens total cells in treated effluent and raw sewage and C. perfringens spores only in
treated effluent and raw sewage, respectively, as detected on each agar medium in samples from
in each treatment plant. According to figures 9 and 11, CCP agar has a higher arithmetic mean
of log10 concentrations of total cells and spores than that of TSC or m-CP in secondary treated
effluent in all treatment plants. The standard errors of CCP and TSC log10 arithmetic mean
concentrations also overlap for several of the treatment plants in both samples. According to
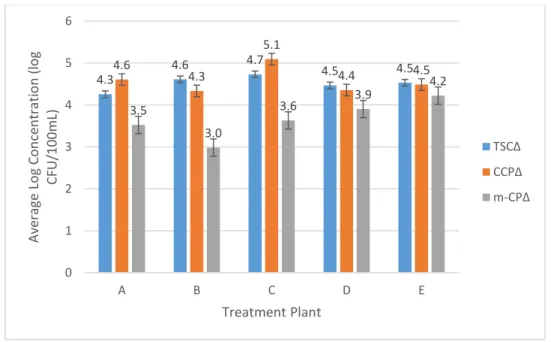
Figures 10 and 12, CCP agar and TSC agar have higher arithmetic mean of log10 concentrations
38
and TSC for these concentrations by treatment plant frequently overlap with each other.
Figure 9. Average log10 concentrations of total C. perfringens with standard errors as detected by the TSC, CCP, and m-CP agars in secondary treated effluent for each treatment plant from which samples were analyzed (n=25)
Figure 10. Average log10 concentrations of total C. perfringens with standard errors as detected by the TSC, CCP, and m-CP agars in untreated sewage for each treatment plant from which samples were analyzed (n=19)
2.3 2.5 2.5 2.4 2.4
2.7 3.0 3.2 2.6 2.8 2.0 2.6 2.8 1.9 2.0 0 0.5 1 1.5 2 2.5 3 3.5 4
A B C D E
Av era ge Lo g Con ce n tra tio n (lo g CF U /100 m L) Treatment Plant TSC CCP m-CP 4.6 4.6 5.0 4.7 4.8 5.0
4.7 5.1 4.8 4.8
4.1 4.1 4.6 4.1 4.1 0 1 2 3 4 5 6
A B C D E
39
Figure 11. Average log10 concentrations of C. perfringens spores with standard errors as detected by the TSC, CCP, and m-CP agars in pasteurized secondary treated sewage effluent for each treatment plant from which samples were analyzed (n=25)
Figure 12. Average log10 concentrations of C. perfringens spores with standard errors as detected by the TSC, CCP, and m-CP agars in pasteurized untreated sewage for each treatment plant from which samples were analyzed (n=19)
2.0 2.5 2.6 2.1 2.3 2.4 2.8 3.0 2.2 2.4 1.0 1.6 1.8 0.9 1.0 0 0.5 1 1.5 2 2.5 3 3.5
A B C D E
Av era ge Lo g Con ce n tra tio n (lo g CF U /100 m L) Treatment Plant TSCΔ CCPΔ m-CPΔ 4.3
4.6 4.7 4.5 4.5
4.6 4.3 5.1 4.4 4.5 3.5 3.0 3.6 3.9 4.2 0 1 2 3 4 5 6
A B C D E
40
To determine the log10 reductions of total C. perfringens cells and C. perfringens spores
at each treatment plant, the average log10 concentrations of the tertiary treated reclaimed water
(tertiary treated reclaimed water concentrations in Tables 13 and 14) were subtracted from the
average log10 concentrations of the untreated sewage. All treatment plants’ tertiary treatment
process included dual disinfection with UV and chlorine except for plant C which used single
disinfection with UV radiation. The average log10 reductions of total C. perfringens cells for each
of the treatment plants based on the CCP agar, which had the highest enumeration levels of C.
perfringens, were 4.60, 4.57, 4.02, 4.68, and 4.83 for treatment plants A, B, C, D, and E
respectively (Figure 13). Likewise, The average log10 reductions of C. perfringens spores for
each of the treatment plants based on the CCP agar, which had the highest enumeration levels of
C. perfringens, were 4.61, 4.33, 4.31, 4.36, and 4.49 for treatment plants A, B, C, D, and E
respectively (Figure 14).
4.6 4.6 4.0 4.7 4.8 5.0 4.7 4.2 4.8 4.8 4.1 4.1 3.6 4.1 4.1 0 1 2 3 4 5 6
A B C D E
41
Figure 13. Average log10 treatment reductions of total C. perfringens with standard errors as detected by the TSC, CCP, and m-CP agars for each treatment plant from which samples were analyzed
Figure 14. Average log10 treatment reductions of C. perfringens spores with standard errors as detected by the TSC, CCP, and m-CP agars for each treatment plant from which samples were analyzed
A Friedman nonparametric test was used to compare the concentrations of C. perfringens
total cells and only spores as detected by the TSC, CCP, and m-CP agars in secondary treated
wastewater (Tables 4 and 5) and raw wastewater (Table 6). The results from these statistical tests
suggested that statistically significant differences in concentrations of C. perfringens total cells
and spores were detected by the three agars. Following the Friedman test, a Dunn Multiple
Comparison post-test was performed to compare each of the agar pairs individually. In the
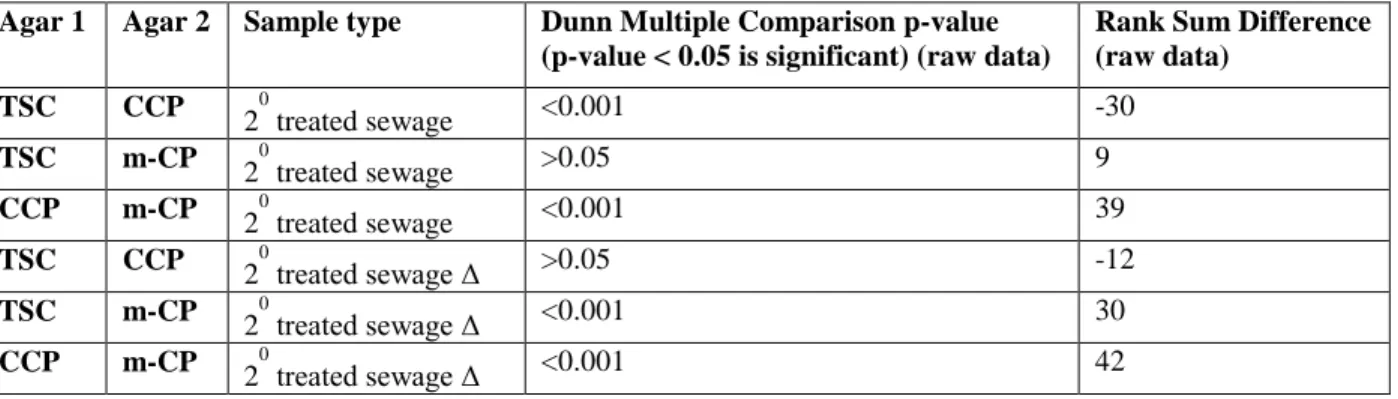
secondary treated sewage sample, the CCP agar was found to have a statistically significantly
greater capacity to enumerate total C. perfringens cells compared to the TSC and m-CP agar
(Table 5; p-value<.001). Both the CCP and TSC agar were found to have a statistically
significantly higher detection rate of C. perfringens spores than the m-CP agar (Table 5; p-value 4.3
4.6
3.7
4.5 4.5
4.6
4.3 4.3 4.4 4.5
3.5 3.0 3.1 3.9 4.2 0 1 2 3 4 5 6
A B C D E
42
<0.001). However, there was no statistically significant difference between the TSC and CCP
agars for capacity to detect C. perfringens spores (Table 4; p-value >0.05).
Compared across the first 11 raw sewage samples, both the TSC and CCP agars were
found to detect significantly higher concentrations of spores and total cells of C. perfringens than
the m-CP agar. Following these statistical analyses of these samples, the next 8 untreated sewage
samples were analyzed only with the CCP and TSC agars and not the m-CP agar. Following the
sample analyses, a Wilcoxon matched pairs signed-rank test was performed to compare the
difference in C. perfringens spores and total cell concentrations in untreated sewage, detected by
the TSC and CCP agars. As shown by the results in Table 5, the CCP agar detected a statistically
significant higher concentration of total C. perfringens cells in raw sewage than did TSC agar (p
= 0.0015). However, there was no statistically significant difference between the two agars in C.
perfringens spore concentration detection in raw sewage (p = 0.2101).
Table 4. Results of Friedman test comparing the matched concentrations of total C. perfringens and spores in secondary treated sewage effluent as detected by TSC, CCP, and m-CP agars
Sample type Friedman test p-value (p-value < 0.05 is significant)
20 treated sewage, no treatment <0.0001
20 treated sewage, pasteurized <0.0001
Table 5. Results of the Dunn Multiple Comparison post-test comparing the matched
concentrations of total C. perfringens and spores in secondary treated sewage effluent as detected by TSC, CCP, and m-CP agars
Agar 1 Agar 2 Sample type Dunn Multiple Comparison p-value (p-value < 0.05 is significant) (raw data)
Rank Sum Difference (raw data)
TSC CCP 20
treated sewage <0.001 -30
TSC m-CP
2 0
treated sewage >0.05 9
CCP m-CP 20
treated sewage <0.001 39
TSC CCP
2 0
treated sewage Δ >0.05 -12
TSC m-CP 20
treated sewage Δ <0.001 30
CCP m-CP
2 0
43 Δ-denotes pasteurization of sample at 65o C for 15 minutes
Table 6. Results of the Wilcoxon matched-pairs signed-ranks test comparing the concentrations of total C. perfringens and spores in untreated sewage as detected by TSC and CCP agars
Agar 1 Agar 2 Sample type Wilcoxon matched-pairs signed-ranks test p-value
Rank Sum Difference (raw data)
TSC CCP Raw Sewage 0.0015 -105
TSC CCP Raw Sewage Δ 0.2101 -63
Δ-denotes pasteurization of sample at 65o C for 15 minutes
Presumptive positive and negative C. perfringens colony isolates for pre-sand filtered
samples and untreated sewage samples were collected from each of the three test agar media for
both pasteurized and unpasteurized samples. A test for acid-phosphatase production (AP) was
performed on colony isolates from each of the agar media and the Stormy Fermentation (SF) test
in iron-milk media tubes was performed as well. In total, 533 presumptive isolates (275
presumptive positive colonies and 258 presumptive negative colonies) from pasteurized and
unpasteurized secondary treated effluent and 303 presumptive isolates (171 presumptive positive
colonies and 132 presumptive negative colonies) from pasteurized and unpasteurized untreated
sewage were subjected to both confirmation tests (Table 7). Table 7 contains the summary of the
number of presumptive positive and negative isolates tested by both confirmation tests for each
agar medium in the two types of samples, pasteurized and unpasteurized. Table 8 displays a
contingency table with the aggregate overall number of times that the two confirmation tests
agreed and disagreed with each other for both presumptive positive isolates and presumptive
negative isolates from all samples, both pasteurized and unpasteurized.
The results of the two C. perfringens confirmation tests had varying levels of agreement
among the agar media. Additionally, the results of the tests for acid-phosphatase production and
for stormy fermentation in iron-milk media differed from each other for many of the presumptive